The extraordinary gamma-ray flare of the blazar 3C 454.3
Abstract
We present the gamma-ray data of the extraordinary flaring activity above 100 MeV from the flat spectrum radio quasar 3C 454.3 detected by AGILE during the month of December 2009. 3C 454.3, that has been among the most active blazars of the FSRQ type since 2007, was detected in the gamma-ray range with a progressively rising flux since November 10, 2009. The gamma-ray flux reached a value comparable with that of the Vela pulsar on December 2, 2009. Remarkably, between December 2 and 3, 2009 the source more than doubled its gamma-ray emission and became the brightest gamma-ray source in the sky with a peak flux of for a 1-day integration above 100 MeV. The gamma-ray intensity decreased in the following days with the source flux remaining at large values near for more than a week. This exceptional gamma-ray flare dissipated among the largest ever detected intrinsic radiated power in gamma-rays above 100 MeV (, for a relativistic Doppler factor of ). The total isotropic irradiated energy of the month-long episode in the range 100 MeV – 3 GeV is . We report the intensity and spectral evolution of the gamma-ray emission across the flaring episode. We briefly discuss the important theoretical implications of our detection.
1 Introduction
Blazars (a special class of Active Galactic Nuclei with the relativistic jet pointing towards the Earth) show variability across their emitted spectrum on timescales of days, months, years. Rarely, intense gamma-ray flares are detected from blazars with fluxes reaching values near that of the Vela pulsar (i.e., the brightest steady gamma-ray source in the sky with a flux of above 100 MeV). Even more rarely, a blazar gamma-ray “super-flare” reaches intensities substantially larger than , as in the case of the June, 1995 flare from PKS 1622-29 (Mattox et al. (1997)). On these rare occasions, the gamma-ray sky is remarkably dominated by a single transient source.
In this Paper, we report the observations by the AGILE satellite of the most recent gamma-ray super-flare from the blazar 3C 454.3 during the period mid-November/mid-December, 2009. During a 1-month period, this source repeatedly reached a flux near for about 2 weeks, and then produced a very intense super-flare on December 2-3, 2009, with . This flare turns out to be even more intense than that detected from PKS 1622-29 (Mattox et al. (1997)), and then qualifies as the most intense gamma-ray flare ever observed from a cosmic source at energies above 100 MeV.
The blazar 3C 454.3 (PKS 2251158; ) has been extensively studied over the last two decades. A wealth of multifrequency observations were obtained especially after the EGRET detections above 100 MeV during the 90’s in the range (Hartman et al. (1992); Aller et al. (1997)). The source entered an active phase in 2000, and was very active in 2005-2006. During the May-June, 2005 period the source showed the strongest optical flare ever recorded in May, 2005, and reached the optical magnitude (Villata et al. (2006); Fuhrmann et al. (2006)). X-ray (Giommi et al. 2006) and hard X-ray observations (Pian et al. (2006)) covering this active phase in 2005 detected large fluxes between 10 and 100 mCrab. 3C 454.3 has been subsequently monitored very extensively at all wavelengths (Villata et al., 2006, 2007, 2009a; Raiteri et al., 2007, 2008a). Starting with the July, 2007 AGILE detection above 100 MeV (Vercellone et al. (2008)), 3C 454.3 has been very active in gamma-rays, and certainly it can be referred as the most active blazar during the last 2 and 1/2 years. A series of papers describe the AGILE gamma-ray observations in 2007-2009 showing repeated flares usually in coincidence with periods of intense optical and X-ray enhanced activity (Vercellone et al. (2008), Vercellone et al. (2009a), Vercellone et al. (2010), Donnarumma et al. (2009)); see also the 1AGL catalog (Pittori et al. (2009)). The multi-year optical evolution of 3C 454.3 has been presented in Raiteri et al. (2008b). Also Fermi detected several gamma-ray flaring episodes above 100 MeV (Hill (2009); Tosti et al. (2008)), and determined an average spectrum for the August-September, 2009 period in the range 200 MeV – 10 GeV showing a distinct break in the power-law spectrum at energies of 2 – 3 GeV (Abdo et al. (2009), Abdo et al. (2010b)).
2 AGILE and the exceptional gamma-ray flare of Dec 02, 2009
The AGILE mission, operational since April 2007 (Tavani et al. (2009)), is characterized by a very compact instrument consisting of a gamma-ray imager detector (GRID, sensitive to energy between 30 MeV and 30 GeV), and a hard X-ray imager (Super-AGILE, sensitive in the energy range 18–60 keV). A non-imaging calorimeter (sensitive in the range 0.4–100 MeV) and an anticoincidence system complete the instrument. The AGILE detectors are characterized by large field of views (2.5 sr for GRID, and 1 sr for Super-AGILE), optimal angular resolution, and good gamma-ray sensitivity especially in the energy range 100 MeV–1 GeV.
During the period April, 2007 until end of October, 2009, AGILE operated in a fixed-pointing mode covering about 1/5 or the entire sky. Due to a re-configuration of the satellite attitude control system, in early November 2009 AGILE changed its scientific operation mode into a “spinning mode”, with the instrument boresight axis sweeping the sky with the angular speed of about 1 degree/sec. All instrument units maintained their functionality, and in particular the GRID detector can access about 80% of the sky in the spinning mode. The observations reported in this Paper were obtained with AGILE operating in the spinning mode.
Because of the AGILE new pointing strategy, the FSRQ 3C 454.3 has been constantly monitored with no gaps since early November 2009, with a typical 2-day exposure value of at 100 MeV. All the gamma-ray fluxes reported in this paper were obtained with a maximum likelihood analysis, using our FM3.119 calibrated filter. We used a standard event selection procedure that takes into account the SAA passage, and a standard Earth albedo photon filtering procedure.
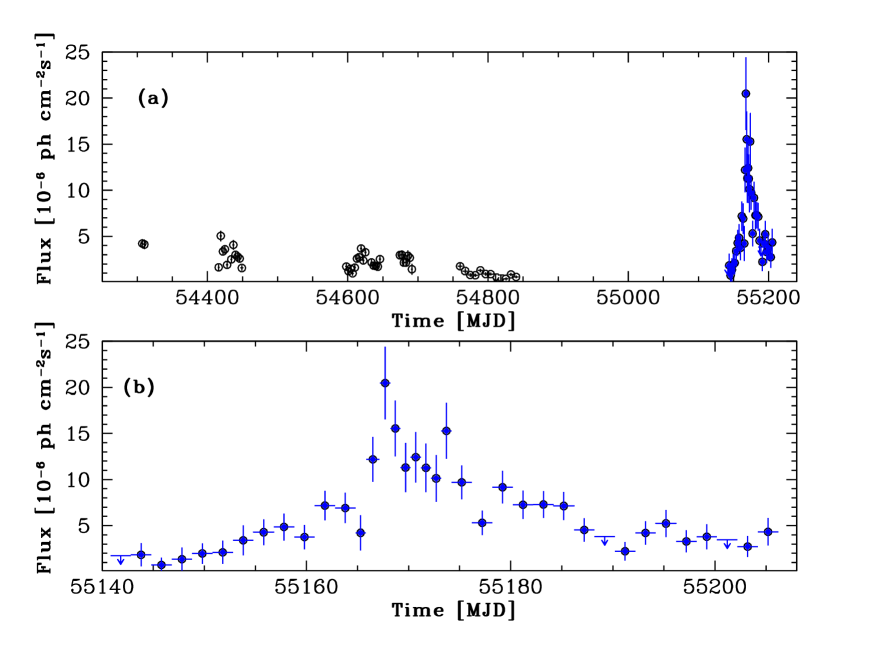
Fig. 1 shows in the upper panel the 2 and 1/2 year gamma-ray lightcurve of 3C 454.3 obtained by integrating all available AGILE gamma-ray data since July, 2007. The lower panel of Fig. 1 shows the detailed AGILE-GRID gamma-ray lightcurve of 3C 454.3 obtained for the period from November 7, 2009 until January 9, 2010. Integrating from 2009-11-10 (MJD = 55145.7) until 2009-12-02 (MJD = 55167.7), the source shows an increasing flux above 100 MeV from a value of 100 ph cm-2s-1 up to a Vela-PSR like flux, 1000 ph cm-2s-1. During the same period (November 21 and December 1-2, 2009), a gradual optical flux increase of more than 1 magnitude in the -band was reported (Villata et al. (2009b)), with a maximum intensity reaching on December 1-2.
An exceptional 1-day gamma-ray emission was detected by AGILE from 3C 454.3 during the time interval 2009-12-02 06:30 UT to 2009-12-03 06:30 UT (Striani et al. (2009b)) with a peak flux of (E 100 MeV). During this time interval 3C 454.3 became the brightest gamma-ray source in the sky with a flux above 100 MeV . This flux exceeded that one of the previous day, showing a rapid increase (about 80%) within 24 hours. Integrating from 2009-11-29 19:00 until 2009-12-01 17:00 (MJD 55164.8 – 55166.7) we obtain the 2-day averaged gamma-ray flux . Integrating from 2009-12-01 17:00 until 2009-12-03 17:00 (MJD 55166.7 – 55168.7) we obtain the flux . The statistical significance of the 2-day averaged flux variability turns out to be above 3 . Following the super-flare episode, the source flux decreased to an average value near 1000 ph cm-2s-1 (E 100 MeV) during the following 10 days, and later decreased to an average flux of 400 ph cm-2s-1 (E 100 MeV).
Multifrequency observations in the IR, optical, X-ray and -ray bands have been reported for this extraordinary gamma-ray flaring activity including those by Fermi/LAT (Escande & Tanaka (2009)), Swift/XRT (Sakamoto et al. (2009)), Swift/BAT (Krimm et al. (2009)), SMARTS/ANDICAM (Bonning et al. (2009)), and the Kanata telescope (Sasada et al. (2009)), and during the following days by INTEGRAL/IBIS (Vercellone et al. (2009b), MIRO (Baliyan et al. (2009)) and ARIES (Gupta et al. (2009)).
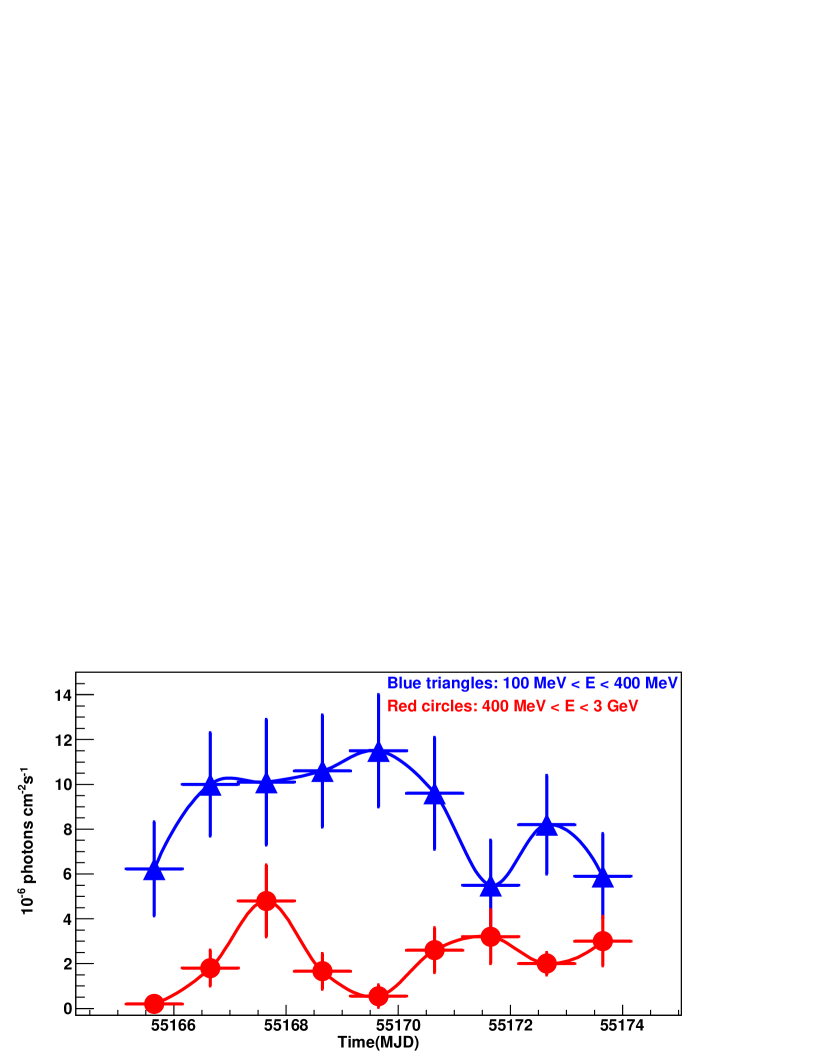
In order to study the gamma-ray emission in the AGILE main spectral bands, we plot in Fig. 2 the 1-day integrated lightcurves in two energy ranges, a “soft” band with MeV (blue curve), and a “hard” band with GeV (red curve). The shape of the lightcurves in the two energy bands shows a possible hint that the source emission hardens across the super-flare episode. Fig. 2 shows, indeed, a substantial increase of the “hard” flux, while a flattening is present in the “soft” lightcurve. The full band lightcurve reported in Fig. 1 seems to be more influenced by the behavior of the hard band emission across the super-flare episode.
![[Uncaptioned image]](/html/1005.4891/assets/x3.png)
We carried out a time-resolved spectral analysis of 3C 454.3 dividing the period of exceptional gamma-ray activity in three time intervals. Fig. 3 shows our results for: (1) a 25-day integrated period before the super-flare (interval-1), (2) the super-flare episode integrated over 2 days (interval-2), and (3) the following 3 days (interval-3). The 3- and 25-day integrations are chosen to provide a good statistical sample.
The spectral behavior during these three intervals seems to confirm the hardening deduced by the “soft” and “hard” gamma-ray properties of the source emission during the super-flare. The super-flare spectrum is well fitted between 100 MeV - 1 GeV by a single power-law with photon index (statistical error only, defined as ). A single power-law fit for the pre- and post-flare spectra gives (interval-1) and (interval-3), respectively111However, it has to be noticed that these values are all consistent within 1-sigma level. The pre- and post-super-flare spectra show a curvature with a peak energy of the spectrum, MeV.
We also performed a refined temporal analysis of the super-flare episode, and studied the gamma-ray lightcurve with temporal bins of different durations (24 hrs, as well as 12 - 6 - 3 hrs). We extracted gamma-ray photons from a radius of for the period 55165-55173 MJD, and obtained the corresponding lightcurves with different binning. Restricting the analysis to the super-flare period (55166-55169 MJD) and to the 6-hr bin lightcurve above 100 MeV, we detect a 3 peak (above a 2-day average) during the 6-hour period 2009-12-02 10:30 UT and 2009-12-02 16:30 UT. This sharp increase (for AGILE due essentially to photons above 400 MeV) is in temporal agreement with the 6-hr increase also reported by Fermi (Escande & Tanaka (2009)).
3 Discussion
3C 454.3 turns out to be the brightest and most active gamma-ray blazar detected above 100 MeV since the beginning of operations of the new generation gamma-ray instruments (AGILE and Fermi). Many gamma-ray flares have been detected from this source in the last two years, and the most recent flaring at the end of the year 2009 is the culmination of a very active phase. The gamma-ray super-flare of early December, 2009 is remarkable for many reasons.
(1) It reaches the strongest ever gamma-ray flux detected from a blazar, with an apparent (isotropic) 1-day peak luminosity of above 100 MeV. We note that for a 3C 454.3 black hole mass of (Woo & Urry (2002)) the observed isotropic gamma-ray luminosity is apparently strongly super-Eddington. However, taking into account the radiation pressure of a fraction of spherical surface for a jet opening angle (Gopal-Krishna et al. (2004)), we obtain an observed radiated luminosity of order of 1/10 of the Eddington limit obtained for spherical accretion (). For an efficiency near 10% of kinetic energy conversion into gamma-ray radiation and maximal extraction of accretion power into jet kinetic power, the deduced accretion rate can reach the Eddington limit during the super-flare episode. By rescaling the peak luminosity value with the relativistic beaming and Doppler factors, we obtain the intrinsic peak luminosity (e.g., Maraschi & Tavecchio (2003)). There are uncertainties for the value of the Doppler factor (with , and the bulk jet velocity), for which values between 20 and 40 are found in literature. We adopt here, for consistency with other recent investigations (e.g., Vercellone et al. (2010)), the value (see also Savolainen et al. (2009)). The corresponding values of the bulk Lorentz factor and the angle between the jet axis and line of sight are in the approximate ranges , and . We adopt the values , and , and obtain .
(2) The peak gamma-ray emission is characterized by a very short risetime (6-12 hrs), and shows a spectral evolution with a hard spectral component that modifies the pre- and post-peak spectra (see Figures 2 and 3).
(3) The total isotropic irradiated energy in the range 100 MeV – 3 GeV during the 2-month period 55146-55205 MJD is . This implies an intrinsic total radiated energy above 100 MeV of . For comparison, the total energy irradiated in the gamma-ray band by the PKS 1622-29 (at z 0.8, assuming the same parameters as for 3C 454.3) during the flare in 1995 was .
The 3C 454.3 super-flare phenomenon is intrinsically broad-band in nature, and a satisfactory picture of the emission mechanism can be obtained only from a complete multifrequency account of the spectral evolution (see Pacciani et al. (2010)). We briefly focus here on the gamma-ray spectral features as shown in Figs. 2 and 3. Among the possible mechanisms that can account for escc a spectral hardening and subsequent decay observed during and following the 3C 454.3 super-flare, we mention here one possibility: the injection of energetic electrons with an energy cutoff larger by a factor of than the applicable to the pre- and post-flare conditions. This extra-acceleration, that has to occur with a comoving timescale less than , influences the whole SED modifying the synchrotron, synchrotron self-Compton (SSC) and external inverse Compton components. The rapid spectral variation inferred from Fig. 3 indeed argues for substantial cooling of the particle distribution function. The additional component of energized particles may be the manifestation of drastic modification of the inner parts of the disk/jet system that produces the rapidly variable high-energy emission. Previous broad-band SED determinations of 3C 454.3 for the gamma-ray activity detected by AGILE in 2007, 2008 and 2009 (Vercellone et al. (2008), Vercellone et al. (2009a), Donnarumma et al. (2009), see also Raiteri et al. 2007 for the detection of little and big blue bumps in the optical spectra) constitute an unprecedentedly constraining database from which further theoretical modelling can be developed.
4 Conclusions
3C 454.3 reveals itself as the most prolific gamma-ray blazar during the last 3 years, and is dominating the gamma-ray sky above 100 MeV since mid-2007. During the period of December, 2009 the source showed a dramatic activity reaching and maintaining for several weeks a flux above 100 MeV comparable or larger than the brightest persistent gamma-ray source such as the Vela pulsar. During the period Dec. 2-3, 2009 3C 454.3 produced a super-flare that turns out to be the brightest blazar emission episode above 100 MeV ever detected. The AGILE satellite followed in a continuous way the daily evolution of the flaring activity of 3C 454.3. Even though a comprehensive picture of the physical mechanism at work can be obtained only from a multifrequency collection of simultaneous data, restricting ourselves to the gamma-ray range in any case provides very important information on the physics of the source. For a detailed theoretical modelling and a broad spectral evolution of the 3C 454.3 exceptional activity see Pacciani et al. (2010).
5 Acknowledgements
We thank an anonymous referee for his/her comments that improved our paper. The AGILE mission is funded by the Italian Space Agency with scientific and programmatic participation by the Italian Institute of Astrophysics and the Italian Institute of Nuclear Physics. Research partially funded through the ASI contract n. I/089/06/2.
References
- Abdo et al. (2009) Abdo, A. A. et al. 2009, ApJ, 699, 817
- Abdo et al. (2010b) —. 2010b, ApJ, 710, 1271
- Aller et al. (1997) Aller, M. F. et al. 1997, in American Institute of Physics Conference Series, Vol. 410, Proceedings of the Fourth Compton Symposium, ed. C. D. Dermer, M. S. Strickman, & J. D. Kurfess, 1423
- Baliyan et al. (2009) Baliyan, K., Ganesh, S., Chandra, S., & Joshi, U. 2009, The Astronomer’s Telegram, 2345, 1
- Bonning et al. (2009) Bonning, E. et al. 2009, The Astronomer’s Telegram, 2332, 1
- Donnarumma et al. (2009) Donnarumma, I. et al. 2009, ApJ, 707, 1115
- Escande & Tanaka (2009) Escande, L., & Tanaka, Y. T. 2009, The Astronomer’s Telegram, 2328, 1
- Fuhrmann et al. (2006) Fuhrmann, L. et al. 2006, A&A, 445, L1
- Giommi et al. (2006) Giommi, P. et al. 2006, A&A, 456, 911
- Gopal-Krishna et al. (2004) Gopal-Krishna, Dhurde, S., & Wiita, P. J. 2004, ApJ, 615, L81
- Gupta et al. (2009) Gupta, A. C., Gaur, H., & Rani, B. 2009, The Astronomer’s Telegram, 2352, 1
- Hartman et al. (1992) Hartman, R. C. et al. 1992, IAU Circ., 5477, 2
- Hill (2009) Hill, A. B. 2009, The Astronomer’s Telegram, 2200, 1
- Krimm et al. (2009) Krimm, H. A. et al. 2009, The Astronomer’s Telegram, 2330, 1
- Maraschi & Tavecchio (2003) Maraschi, L., & Tavecchio, F. 2003, ApJ, 593, 667
- Mattox et al. (1997) Mattox, J. R., Wagner, S. J., Malkan, M., McGlynn, T. A., Schachter, J. F., Grove, J. E., Johnson, W. N., & Kurfess, J. D. 1997, ApJ, 476, 692
- Pacciani et al. (2010) Pacciani, L. et al. 2010, ArXiv e-prints, ApJ Letters accepted
- Pian et al. (2006) Pian, E. et al. 2006, A&A, 449, L21
- Pittori et al. (2009) Pittori, C. et al. 2009, A&A, 506, 1563
- Raiteri et al. (2008a) Raiteri, C. M. et al. 2008a, A&A, 485, L17
- Raiteri et al. (2008b) —. 2008b, A&A, 491, 755
- Raiteri et al. (2007) —. 2007, A&A, 473, 819
- Sakamoto et al. (2009) Sakamoto, T., D’Ammando, F., Gehrels, N., Kovalev, Y. Y., & Sokolovsky, K. 2009, The Astronomer’s Telegram, 2329, 1
- Sasada et al. (2009) Sasada, M. et al. 2009, The Astronomer’s Telegram, 2333, 1
- Savolainen et al. (2009) Savolainen, T., Homan, D. C., Hovatta, T., Kadler, M., Kovalev, Y. Y., Lister, M. L., Ros, E., & Zensus, J. A. 2009, ArXiv e-prints
- Striani et al. (2009a) Striani, E. et al. 2009a, The Astronomer’s Telegram, 2322, 1
- Striani et al. (2009b) —. 2009b, The Astronomer’s Telegram, 2326, 1
- Tavani et al. (2009) Tavani, M. et al. 2009, A&A, 502, 995
- Tosti et al. (2008) Tosti, G., Chiang, J., Lott, B., Do Couto E Silva, E., Grove, J. E., & Thayer, J. G. 2008, The Astronomer’s Telegram, 1628, 1
- Vercellone et al. (2008) Vercellone, S. et al. 2008, ApJ, 676, L13
- Vercellone et al. (2009a) —. 2009a, ApJ, 690, 1018
- Vercellone et al. (2010) —. 2010, ApJ, 712, 405
- Vercellone et al. (2009b) —. 2009b, The Astronomer’s Telegram, 2344, 1
- Villata et al. (2007) Villata, M. et al. 2007, A&A, 464, L5
- Villata et al. (2006) —. 2006, A&A, 453, 817
- Villata et al. (2009a) —. 2009a, A&A, 504, L9
- Villata et al. (2009b) Villata, M., Raiteri, C. M., Larionov, V. M., Konstantinova, T. S., Nilsson, K., Pasanen, M., & Carosati, D. 2009b, The Astronomer’s Telegram, 2325, 1
- Woo & Urry (2002) Woo, J., & Urry, C. M. 2002, ApJ, 579, 530