Experimental determination of the state-dependent enhancement of the electron-positron momentum density in solids
Abstract
The state-dependence of the enhancement of the electron-positron momentum density is investigated for some transition and simple metals (Cr, V, Ag and Al). Quantitative comparison with linearized muffin-tin orbital calculations of the corresponding quantity in the first Brillouin zone is shown to yield a measurement of the enhancement of the , and states, independent of any parameterizations in terms of the unscreened electron density local to the positron. An empirical correction that can be applied to a first-principles state-dependent model is proposed that reproduces the measured state-dependence very well, yielding a general model for the enhancement of the momentum distribution of positron annihilation measurements, including those of angular correlation and coincidence Doppler broadening techniques.
I Introduction
Positron annihilation is one of the key tools in modern investigations of the Fermi surface (FS) of solids west1995 , alongside quantum oscillatory techniques, Compton scattering and angle-resolved photoemission. Unlike other methods, however, the positron probe itself plays a crucial role in the measured distribution, preferentially annihilating with those electrons that are most able to screen its charge. In a typical metal, free from vacancy-type defects, the electrons that are most readily able to screen are, of course, those at the FS, advantageously leading to an enhancement of the signal contributed from electrons at the FS. Attempts to account for this enhanced contribution have, for the most part, relied on detailed studies of the electron-positron interaction within the jellium model kahana1963 ; arponen1979 , which is now essentially well-understood stachowiak1993 . However, such schemes are yet to achieve good agreement with experiment when applied to a wide range of metallic systems. Here, we consider this problem from an experimental perspective, measuring the state-dependent enhancement factor for some simple elemental metals, and present a phenomenological (and empirical) correction to the work of Barbiellini, Alatalo and their co-workers barbiellini1997 ; alatalo1996 that offers excellent agreement with experiment.
The complex many-body interaction between the positron and the electron gas has been intensively studied for many years sormann1996 . When the positron enters a homogeneous electron gas, the attractive Coulomb interaction polarizes the electron gas in the vicinity of the positron, leading to a cusp in the unscreened electron density at the positron’s position and the associated enhancement of the partial annihilation rate of those electrons that screen the charge. The theory of Kahana kahana1963 predicted a momentum-dependent enhancement, in which the enhancement increases towards the Fermi momentum, , and corresponds to the increased capability of electrons near the Fermi level to screen the positron’s charge, compared with lower-lying electron states. However, the inhomogeneity of the electron gas in real lattices can have a strong influence on the enhancement, even hiding the Kahana-like momentum dependence barbiellini1997 ; sormann1996 .
It is worth pointing out that when considering enhancement there are actually two separate, but related issues. Firstly, in the context of calculating the correct positron lifetimes in solids, the enhancement of the total electron density needs to be properly described in order to calculate the positron annihilation rate. Secondly, a description of the enhancement is needed when calculating the two-photon momentum densities (which are the focus of the current paper). The former problem is easier because the contact density can be parameterized in terms of the local electron and positron densities (using the many-body results for jellium), but the latter is a more difficult problem since in the framework of density functional theory there is no formally exact way to calculate the two-photon momentum density singh1985 ; barbiellini2003 (and as such all models in the literature are, in practice, empirical). Local density parameterizations, in which the enhancement is parameterized as a function of the unscreened electron density, , at the positron, have been introduced to account for the inhomogeneity of real systems. In these approaches, the enhancement is usually expressed in terms of the electron gas parameter, , of which it is a monotonically increasing function for typical crystallographic electron densities. Some popular choices are the expressions of Arponen and Pajanne arponen1979 , based on boson formalism and parameterized by Barbiellini and co-workers barbiellini1995 , and those of Boroński and Nieminen (BN) which are based upon an interpolation of Fermi liquid results due to Lantto boronski1986 . Jarlborg and Singh (JS) have used a local-density approach to solve a two-body electron-positron Schrödinger equation inside a spherical correlation cell that yields good agreement with transition metals and their alloys for both momentum densities jarlborg1987 and positron lifetimes barbiellini1991 , and is a common choice to describe the enhancement of the momentum distribution in metals barbiellini2003 ; major2004b . More general parameterizations have been proposed mijnarends1979 ; daniuk1987 ; jarlborg1991 ; sob1982 that include Kahana-like momentum or energy dependence to describe the results of positron measurements. More recently, theoretical prescriptions for the enhancement have been developed that represent a significant departure from the homogeneous electron gas or local-density approaches, based on, for example, the generalized gradient approximation barbiellini1997 , Bloch-modified ladder sormann1996 or weighted-density approximation rubaszek1998 .
Owing to the different screening properties of and - electrons, efforts to include a character, or state-dependent enhancement function have been applied to several transition metals and their alloys sob1982 ; svoboda1983 ; matsumoto1987 ; genoud1990 . Šob applied such a scheme to data measured on a polycrystalline FeAl alloy, finding a de-enhancement of the states by a factor of compared with the - states sob1982 , whereas the application of the same procedure by Svoboda and Šob svoboda1983 to CuZn was found to favor a reduction by a factor of . Theoretically, such explicit state-dependence is rarely included, although for flat -bands it is implicitly present in any energy-dependent model. Recently, Barbiellini and co-workers have developed a theoretical and ab initio state-dependent prescription for calculating the enhancement in a general system barbiellini1997 ; alatalo1996 , which is based on the state-dependent annihilation rates calculated within the generalized gradient approximation (GGA). Although it has been demonstrated that the effects of enhancement do not shift the location in k-space of the Fermi breaks in positron measurements majumdar1965 , the influence of the theoretical treatment of the enhancement, when rigid-band like shifts are applied to the electronic structure and compared with experiment, has not yet been investigated.
Here, we tackle the problem of describing the enhancement of the positron annihilation rates from an experimental perspective. Employing a state-dependent (SD) model for the enhancement similar to that of Ref. barbiellini1997 , we simultaneously fit both the FS and the enhancement from ab initio electronic structure calculations to positron data directly in k-space in order to obtain a quantitative measurement of the enhancement in metals. Additional comparisons with the calculational scheme of Ref. barbiellini1997 are used to quantitatively assess the applicability of such an SD enhancement model for electron-positron momentum distributions. In particular, the accuracy of rigid-band-like approaches in obtaining more realistic representations of the experimental FS are found to be sensitively dependent on the particular enhancement employed in the calculation.
The organisation of this paper is as follows. In Section II, we introduce the method employed in this paper. In Section III, we apply this fitting technique to some transition and noble metals, namely V, Cr and Ag, and in Section IV we address the simple metal Al. Finally, in Section V we apply and investigate a correction to the existing theory of Ref. barbiellini1997 that provides useful predictive power as a general model of enhancement in both transition metals as well as simple metals. The application of this correction to Mo is shown to quantitatively explain the difference in the momentum distributions of Cr and iso-electronic Mo that is observed despite the similarity in their FS.
II Method
II.1 State-dependent enhancement
The quantity measured by two dimensional angular correlation of (electron-positron) annihilation radiation (2D-ACAR) experiments is a once-integrated projection (along a suitable crystallographic direction) of the so-called two-photon momentum density, ,
| (1) |
where is the electron occupation density of state ( is the band index), are the coefficients of a plane-wave expansion of the product of the electron and positron wavefunctions, in which is a vector of the reciprocal lattice, and the -function expresses the conservation of crystal momentum. In a 2D-ACAR measurement, the 3D quantity expressed in Eq. 1 is integrated along a particular direction to yield a 2D projection of , and the projected axis is usually chosen to be a suitable high-symmetry crystallographic axis. The FS enters Eq. 1 as discontinuous breaks in the momentum density when p traverses occupied () to unoccupied () (i.e. when the band crosses the Fermi energy). The folding of crystallographically equivalent p-points of momentum using the so-called Lock-Crisp-West procedure lock1973 yields the ‘reduced momentum density’ (RMD), ,
| (2) |
The of Eq. 1 can be written in terms of the single-particle electron and positron wavefunctions, and as,
| (3) |
Here, is the electron-positron pair wavefunction for state ,
| (4) |
where is the state-dependent positron enhancement factor (for the state ). Setting in Eq. 4 is equivalent to the independent particle model (IPM), although it should be noted that the effects of the positron wavefunction are still included in that case. The usual parameterizations of the enhancement, for example the BN or JS models, are based on local-density parameterizations, in which is a function only of the unscreened local electron density at the location of the positron. Other state-dependent prescriptions exist (e.g. sob1982 ; jarlborg1991 ), although these have relied on the empirical determination of the state dependence of the enhancement.
Barbiellini and co-workers barbiellini1997 have proposed a theoretical prescription for applying a state-dependent positron enhancement factor to ab initio calculations of the electronic structure and momentum density. In their scheme, is obtained through the partial annihilation rates, such that,
| (5) |
where is the partial annihilation rate of the state including correlation effects, and is the partial annihilation rate due to the IPM. The total annihilation rate, , may be calculated from (here shown for the local density approximation, LDA),
| (6) |
where is the classical electron radius, is the speed of light and is the positron density. In their calculations, the GGA was used for the calculation of , which successfully reproduces the experimental annihilation rates rather well barbiellini1995 ; barbiellini1996 .
II.2 Practical approach
We begin by computing the ab initio electronic structure using the linearized muffin-tin orbital (LMTO) method, within the atomic sphere approximation and including combined correction terms barbiellini2003 . The coefficients of Eq. 3 are then computed within the IPM (equivalent to setting in Eq. 4), unfolded in such a way as to resolve the individual contribution owing to the atom index (), and orbital angular momentum quantum number (),
| (7) |
The momentum density in the first Brillouin zone (i.e. the RMD, Eq. 2) is computed for the IPM by,
| (8) |
For the enhancement, we introduce the quantities that describe the enhancement of a state of atomic species and of orbital angular momentum (). These can then be incorporated into the calculation of the RMD by,
| (9) |
Note that in the above equation, the multiply the coefficients, which are inside the sum over included G-vectors, and so the RMD must be re-computed for each and cannot be expanded into a sum of contributions to the momentum density from different -orbitals.
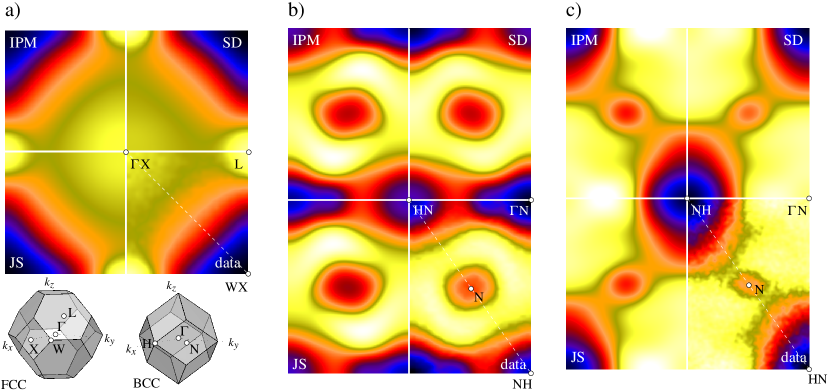
In this way, is a universal quantity, representing the partial enhancement of a state with character . The degree to which it is enhanced depends on the coefficients of the wavefunctions in the LMTO calculation. The enhancement, then, of a pure state of atomic species and orbital character is given by . Note that the band characters (atomic species and orbital character) are strongly -dependent, and of course vary from band to band due to hybridization with other states, so our enhancement model is a general state-dependent model for the enhancement (see, for example, Fig. 1), but has its origins in the convenient properties of the LMTO wavefunctions.
The contribution due to core annihilations is an important consideration for positron lifetime calculations puska1986 . However, the core contribution is small and relatively independent of across the first Brillouin zone (BZ), and can safely be omitted from this calculation. Instead, the contribution from core states in the data is described by a uniform background in the subsequent fitting procedure.
II.3 Minimization procedure
In the rigid-band approach, the agreement between experiment and theory is iteratively maximized with respect to a rigid shift of one or more of the energy bands (typically those that constitute the FS), until convergence at the minimum of the goodness-of-fit parameter is achieved. This is similar to the method of Ref. major2004b , however, there are some important differences. In Ref. major2004b , the radial anisotropy of the two-photon momentum density in p-space served as the comparative quantity, and the enhancement was fixed to that chosen in its initial calculation (in that case, the JS model was used). Here, we perform our comparison in k-space, corresponding to the Lock-Crisp-West-folded data, and explicitly include enhancement of the form outlined above (SD model) in the fitting. The advantage of operating in k-space (aside from the smaller array sizes involved) is principally that we are sensitive directly to the projected Fermi breaks, rather than the many weaker FS signatures that are distributed throughout the p-space spectrum. An additional consideration, however, is the contribution from higher momentum components (Umklapp processes), whose enhancement has presented a challenge for theoretical models (see, for example, Ref. sormann1996 ). It is noted that operating in k-space involves the folding of the Umklapp contributions into the first BZ, both experimentally and theoretically, and that any non-trivial behavior of these contributions is subsequently lost. However, we have checked our results with the equivalent p-space spectra, and in particular near the Umklapp regions (as well as its integral, which represents an analogue of the coincidence Doppler broadening spectra). Crucially, we find the data are equally well-reproduced using such a k-space approach as they are with the traditional JS model.
The fitting parameters constitute the energy shift, , for each band in the fit (typically those that cross ), two scaling parameters for each experimental projection, and , that approximately relate to the -independent core contribution and the number of counts in the 2D-ACAR spectra respectively, and the enhancement parameters, , of which there are typically three for simple systems. These are simultaneously adjusted using the MINUIT package minuit and the computed k-space density is compared with the data until convergence is reached. Note that we fit the ratios of the enhancement parameters, absorbing their magnitude into the scaling parameters (the absolute magnitude of the enhancement parameters is indistinguishable from the scaling parameters in the data).
Our definition and treatment of the scaling parameters have an important consequence. As mentioned above, we do not treat the enhancement of the core electrons, preferring to concentrate on the description of the shape of the RMD. Such an approach means that good agreement can be obtained with the IPM if we consider a negative contribution from core annihilations. Whilst this is clearly unphysical, it stems from the strong overestimation of the enhancement of deeply-bound electrons within the IPM. Here, we are most interested in the band properties of the momentum distribution (i.e. its shape), and in particular its FS signatures. We point out that in the following discussion, even when the IPM appears to give reasonable agreement with our data, the agreement with positron lifetime measurements (see, for example, Refs. barbiellini1991 ; puska1986 ; takenaka2008 ) would be very poor, in contrast to the other enhancement models that are addressed here.
III Transition and noble metals
The transition metals and their alloys have traditionally been the subject of the bulk of experimental investigations of the FS, and a good description of the electron-positron momentum density and enhancement of such systems has been vital in understanding 2D-ACAR, and indeed coincidence Doppler broadening alatalo1996 ; asokakumar1996 ; makkonen2006 data. The JS model was specifically developed with transition metals in mind, and is generally thought to provide a good description of the enhancement for -electron densities (with ) jarlborg1987 ; barbiellini1991 ; major2004b . Here, we begin by applying the SD enhancement model described above to some metals whose FSs have been accurately determined via quantum-oscillatory methods (Ag, V) and one whose FS is inaccessible to conventional FS probes (paramagnetic Cr), first concentrating on the “raw” LMTO calculations of the RMD. Comparisons are made with both the IPM and the JS model for enhancement, as well as a simplified version of the Barbiellini-Alatalo barbiellini1997 ; alatalo1996 enhancement scheme. Following this, we rigidly fit the bands to the experimental data to obtain an experimental measurement of the FS, in order to assess the sensitivity of this approach to the FS.
Three 2D-ACAR projections ([100], [110] and [111]) were obtained from a single crystal of Ag at K, with a resolution full width at half maximum of mrad in the and data axes respectively (corresponding to % of the BZ of Ag). For V, four projections were obtained along the [100], [110], [210] and [211] directions at room temperature with a resolution of mrad (with the exception of the [110] direction, which was collected at K with resolution mrad). Paramagnetic Cr was measured along the [100] and [110] directions at 353 K, well above the Néel temperature (with a resolution function the same as the room temperature V measurements). For each sample presented in this manuscript, the 2D-ACAR spectra have been carefully checked to confirm the absence of any defect or impurity signatures in the spectra.
LMTO calculations were performed over 1505 k-points in the irreducible wedge of the face-centered cubic BZ for Ag, and over 6201 k-points in the irreducible wedge of the body-centered cubic BZ for V and Cr. For each material, the RMD was computed for both the IPM and the JS parameterizations of the enhancement, and convoluted with the appropriate experimental resolution function. This was compared to the experimental data with adjustments only to the scaling parameters, and . The SD model of the enhancement was then obtained by simultaneously fitting the orbital enhancement factors, . In each case, a goodness-of-fit parameter, , was computed as a weighted average of that from each experimental and theoretical projection. Comparisons were also made for the raw band calculation with the model of Refs. barbiellini1997 ; alatalo1996 by computing the annihilation rates associated with each orbital both within the GGA barbiellini1995 and IPM, where the enhancement of each orbital in this model is the ratio of these annihilation rates. However, it should be noted that this scheme still invokes a parameterization of the enhancement in terms of the electron-gas parameter. To compare with our experimental values, we integrate over all -states to obtain the annihilation rate from all electrons of orbital quantum number . In Eq. 6, this corresponds to substituting the (partial) electron density due to each , , and orbital, for to obtain in the GGA, rather than the method of Ref. barbiellini1997 in which is used. In the following, we refer to this as the simplified Barbiellini-Alatalo (SBA) model (in which the ‘simplified’ reflects the integration over all k-states).
III.1 Raw band calculations
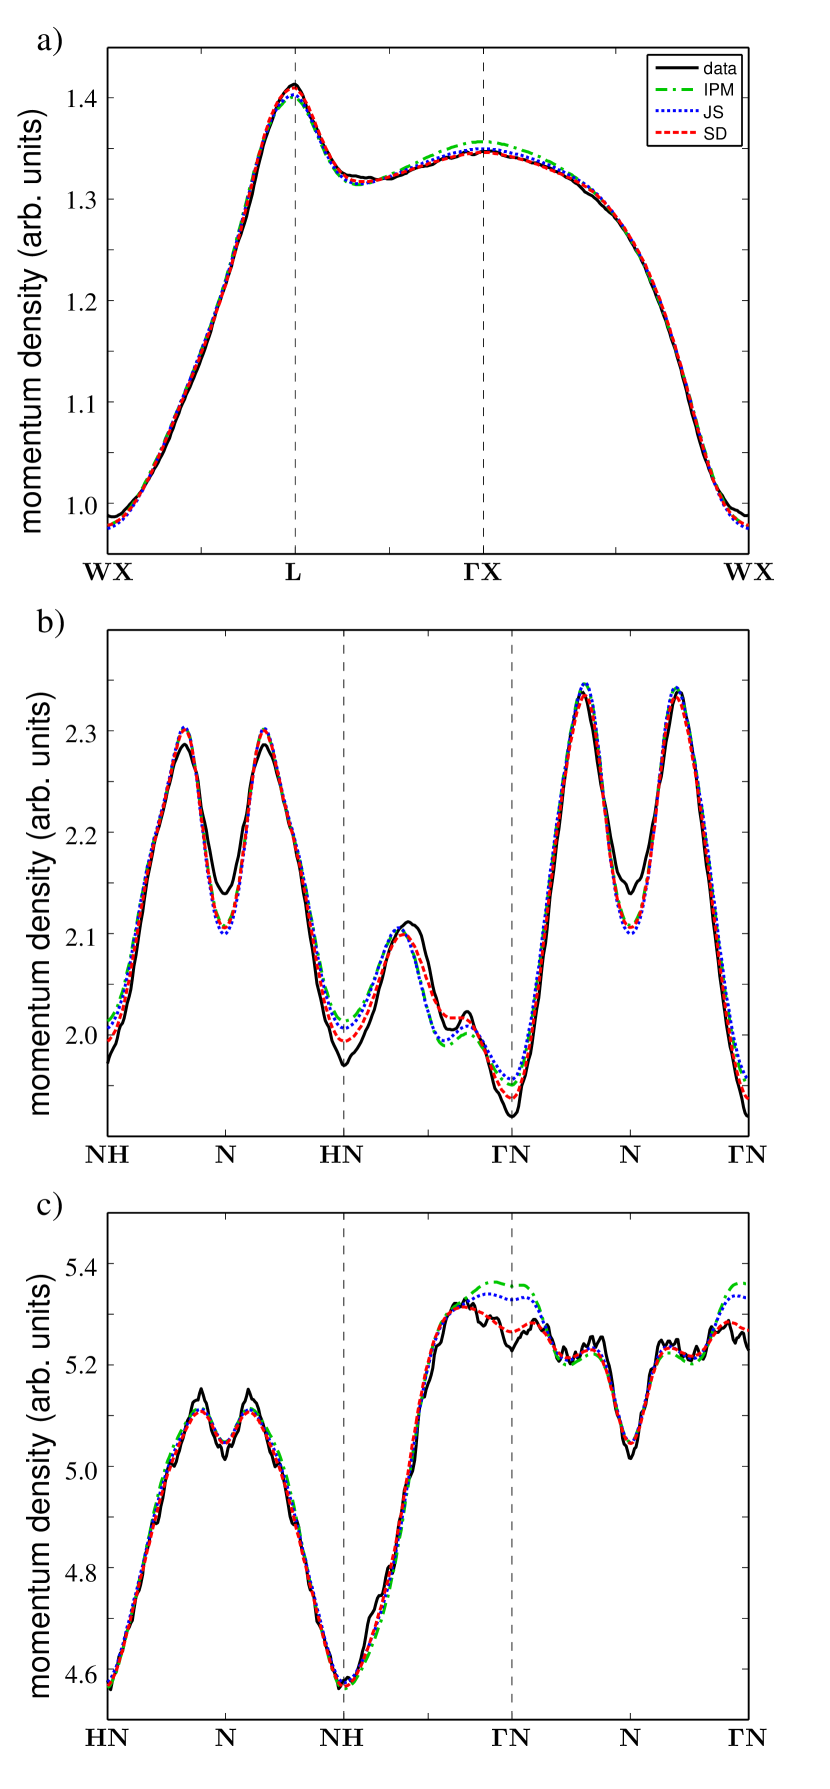
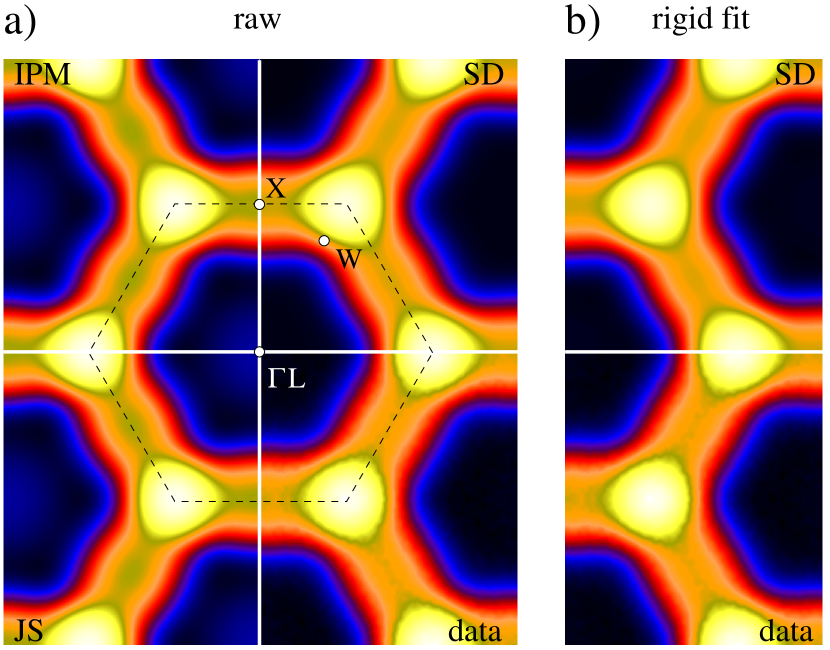
For the raw band calculations, the comparison between theory and experiment depend on (i) a good ab initio description of the electronic structure, and in particular the FS, and (ii) a reliable understanding of the electron-positron enhancement factor. The well-known FS of Ag consists of just a single sheet that is only slightly perturbed from the free-electron sphere, most notably along the [111] direction where the FS intersects with the BZ boundary to form a neck at the -point of the BZ. Band structure calculations within the LDA reproduce the precise measurements of quantum oscillations halse1969 ; coleridge1972 ; coleridge1982 very well and it therefore provides an excellent candidate in which to test models for the enhancement, for which the JS model would be an obvious choice. As demonstrated by Fig. 2a and 3a, the experimental data are well-described by the raw band calculations of the RMD, in which even the IPM (including only positron wavefunction effects) works reasonably well. Quantitatively, as demonstrated in Table 1, the JS enhancement model is found to improve the agreement between experiment and theory, particularly near the projected and points of the BZ. However, the current SD model is able to bring the theoretical RMD into much closer agreement with the data by de-enhancing the and states relative to the states. For Ag, the bands below are predominantly -bands, with some hybridization with the state, but the band that crosses has substantial character. The de-enhancement of states relative to the bands is well-known jarlborg1987 and is attributed to the relative localization of electrons, particularly near the top of the -bands. That the enhancement appears to be quite strong can be explained by a Kahana-like momentum enhancement, in which those electron states nearest are most enhanced. In Fig. 1 the measured SD enhancement is plotted along -, accompanied by the band dispersion and character. As can be seen from Fig. 1b, the enhancement of band 6 grows substantially as the band approaches the Fermi level, replicating the Kahana-like momentum dependence of the enhancement. This is captured in our model by the enhancement of the -like states; as demonstrated by Fig. 1c, the enhancement of both bands 1 and 6 closely follow their respective character. Note that, owing to the weak contribution from high-lying states, a good quantification of their enhancement is not possible.
| Ag | IPM | - | - | - | - | 12.51 |
| JS | - | - | - | - | 10.37 | |
| SD | 0.81 | 1.00 | 0.81 | (0.76) | 6.57 | |
| SBA | 0.92 | 1.00 | 0.64 | (1.08) | 8.98 | |
| V | IPM | - | - | - | - | 19.74 |
| JS | - | - | - | - | 26.56 | |
| SD | 0.69 | 1.00 | 0.78 | (0.57) | 13.32 | |
| SBA | 0.97 | 1.00 | 0.83 | (1.02) | 32.86 | |
| Cr | IPM | - | - | - | - | 8.15 |
| JS | - | - | - | - | 5.82 | |
| SD | 0.82 | 1.00 | 0.54 | (0.87) | 2.54 | |
| SBA | 0.97 | 1.00 | 0.80 | (1.03) | 5.09 | |
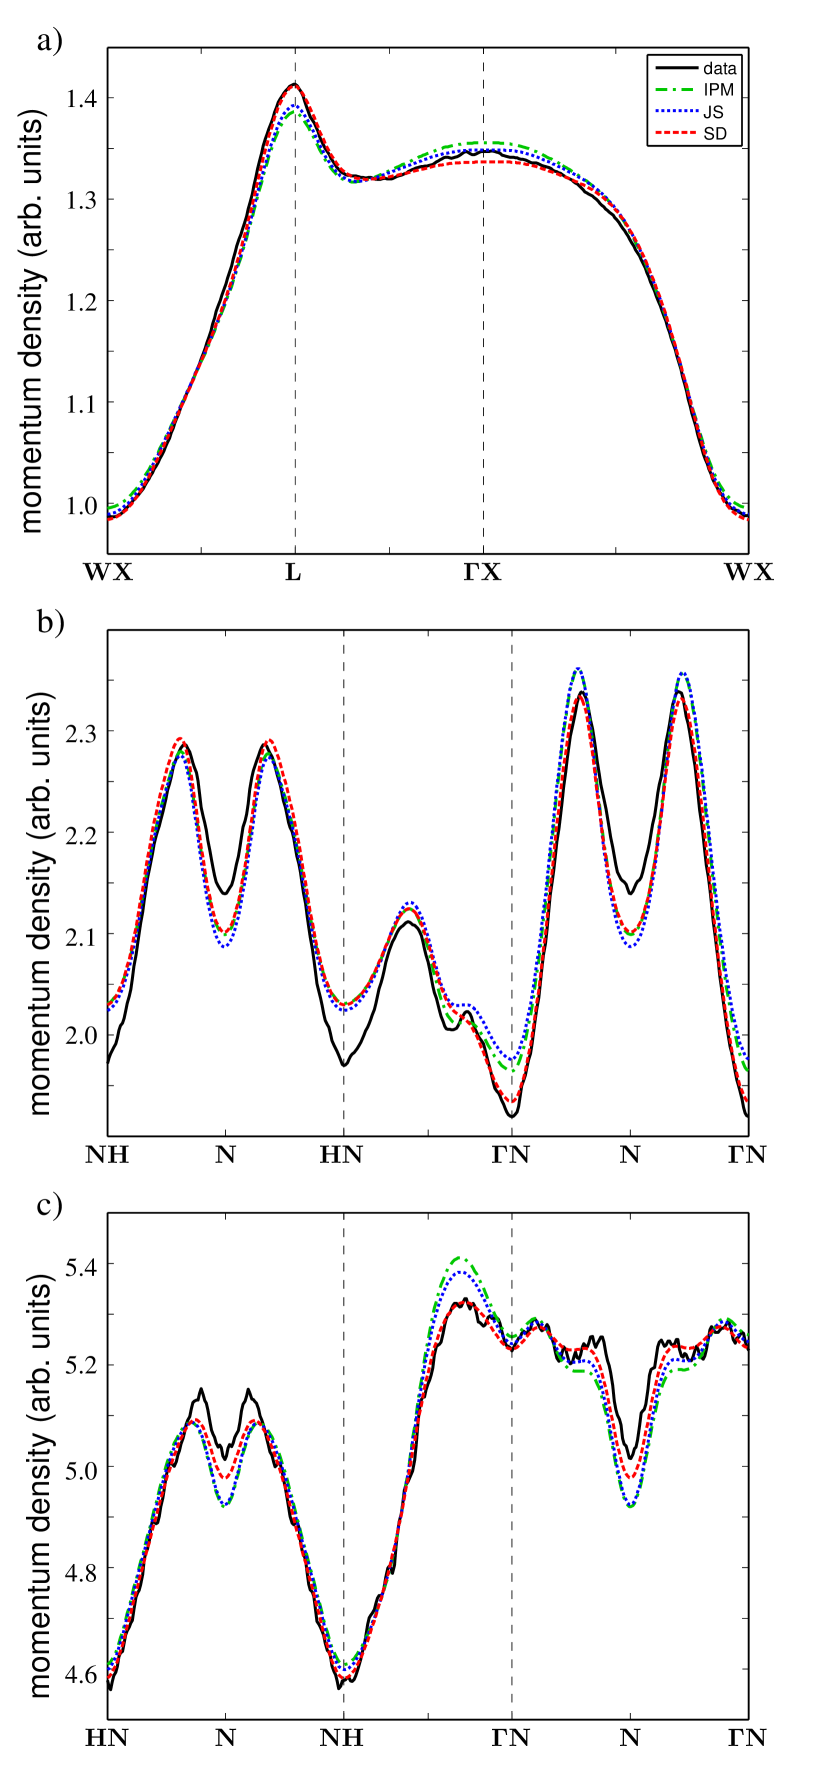
The situation is more complicated for V and Cr, for which the details of the near- electronic structure, including the precise dimensions of the FS, are either not well-reproduced by our band calculations (V), or have not been accurately determined (paramagnetic Cr). Figs. 2b and 2c show representative 2D-ACAR projections of V and Cr (along the [110] direction) respectively, compared with the corresponding theoretical quantities. The FS of V is composed of two sheets. The first sheet (originating from band 2 of predominantly character) forms a small -centred hole octahedron that encloses holes and has remained unobserved in quantum oscillation data, although its presence has been confirmed by 2D-ACAR measurements singh1985b ; pecora1988 ; singh1984 (this sheet is visible in the experimental data in Fig. 2b at the projected point). Band 3, on the other hand, experiences appreciable hybridization with the states above and forms a -centred jungle-gym hole FS as well as some hole ellipsoids that are centred at . These -hole ellipsoids can be clearly seen in the data of Fig. 2b at the projected -point of the BZ, where the density experiences a local dip due to their presence. These features in the IPM and JS calculations are predicted to be substantially too large and too strong (see Fig. 3b), and the enhancement of the high-density surrounding region is not well reproduced. Although, as pointed out by Jarlborg and Singh, the enhancement is expected to be less important for a less-full -band, the JS enhancement is actually found to perform worse than the IPM for V (see Table 1), at least in the shape of the distribution (positron lifetime predictions are substantially better described by the JS model barbiellini1991 ). V was used as a test material by Jarlborg and Singh in their presentation of the JS enhancement model, in which they comment that the IPM already provides a reasonable description of the momentum density jarlborg1987 , and that their model offered only weak improvement. However, their comparisons were made with electronic structure calculations where the bands had been rigidly shifted to agree with de Haas-van Alphen (dHvA) measurements of the -hole ellipsoids parker1974 . Indeed, in Fig. 3b it is obvious that the dimensions of the dips in the momentum density along -- are incorrectly placed with respect to the data. In Section III.2, we address such inconsistencies by rigidly shifting the bands to improve agreement between experiment and theory.
Cr neighbors V in the periodic table, having an extra electron, yet its paramagnetic FS has remained relatively unexplored experimentally, principally owing to the emergence of an ordered spin-density wave phase below K fawcett1988 , where the high temperature precludes quantum oscillatory measurements in the paramagnetic phase, and strong spin fluctuations appear to suppress the measurement of the nested sheets in the ordered phase ditusa2010 . Theoretically, the FS is composed of three sheets, the first of which (band 3) contributes some small electron ‘lenses’ midway between and . Band 4 forms some hole ellipsoids and -centred octahedra, whereas in band 5 there is a -centred electron ‘jack’. Molybdenum, isoelectronic to Cr, shares a similar FS topology, in which the -hole ellipsoids and the electron jack can be clearly visualized in the [110]-projected k-space density of 2D-ACAR measurements fretwell1995 ; hughes2004 . For Cr, these features, shown in Fig. 2c near the projected points, are obscured in the measurement, presumably owing to enhancement effects dugdale1998 . Indeed, the -hole ellipsoids are more evident in the IPM and JS projected densities than they are in the data. Overall, the agreement between the IPM and JS calculations of the RMD and the data is reasonable (see Table 1), but is particularly poor near the projected -points of the BZ as well as midway along the - path (see Fig. 3c). Here, the knobs of the electron jack project on top of one another, and the IPM and JS do not predict the de-enhancement of the momentum density very well in this part of the BZ.
The application of the SD model, however, considerably improves the agreement between experiment and theory by substantially de-enhancing the and states. In Figs. 3b and 3c, this can be most clearly seen at the projected -points of the BZ, as well as the momentum density near the points. For both V and Cr, the hybridization of the valence states with the unoccupied states indicates the importance of the electrons in deciding the topology of the FS, and their proximity to means they have a strong impact on the enhancement of the momentum density in 2D-ACAR measurements. Previous non-iterative comparisons of orbital-weighted band theory and 2D-ACAR data have been made in p-space for V genoud1990 , in which a de-enhancement of the and states by relative to the states was favored. Our results are close to these, where we obtain 0.69 and 0.78 for and states respectively, corresponding to a slightly greater de-enhancement of the lower-lying states. Similarly for paramagnetic Cr, Matsumoto and Wakoh matsumoto1987 estimated (also non-iteratively) that the Cr states were de-enhanced by relative to the states (which were considered together). Our results correspond well with their findings, where we obtain 0.82 and 0.54 for and states, relative to the states. The stronger enhancement of the Cr states (compared with V) may be explained by the higher occupation of the states in Cr (they are almost twice as occupied in Cr).
Finally, we comment on the predictions for state enhancement made by the SBA model. Apart from Ag, which has a much higher electron density than either V or Cr, the orbital enhancement ratios are predicted to be very similar (see Table 1), with a weak de-enhancement of the -states and a modest de-enhancement of the -states relative to the -states. For Ag, a rather more exaggerated de-enhancement is predicted for the -states. Qualitatively, these results are in agreement with our measured values, but differ substantially in magnitude and lead to a slightly higher parameter than the current SD model. Nevertheless, the SBA model provides better agreement with the data than either the IPM or the JS model for Ag and Cr, supplying a more robust predictive scheme for computing the enhancement in 2D-ACAR momentum distributions. That it does not fair so well for V is mostly accounted for by the rather larger corrections to the LDA band structure that are required for V, a topic that will be returned to in the next section. Here, we emphasize that the SBA model is expected to improve the agreement with the data over the IPM or JS models when extensions to the LDA, such as non-local potentials barbiellini1989 or self-energy corrections barbiellini2005 , that improve the description of the FS are included. The most probable origin for the discrepancy between the SBA scheme and our measured SD enhancement is the omission of a Kahana-like energy-dependence or momentum-dependence in the predictive scheme of Ref. barbiellini1997 . As already highlighted, some of the results for the enhancement in the current SD model, particularly the apparent strong enhancement in V and Cr, reflect a Kahana-like enhancement of those electron states near . In our model, where a state is not too dispersive in energy, this is naturally captured by enhancement of that state. The authors of Ref. barbiellini1997 comment that the Kahana-like energy- or momentum-dependence appears to be less important than the state-dependence from their results, a conclusion that this work substantiates, but these results suggest that including such enhancement could produce a good improvement in the agreement between experiment and theory. In Section V, we apply just such an energy-dependent term to the SBA enhancement factor, and demonstrate the improved predictive capacity of such a model.
III.2 Rigid-band fit
In 2D-ACAR investigations of the FS, the traditional method of extracting the FS from experimental data is to contour the data at a level that corresponds to extrema in the first derivative of the data, and it is well known that enhancement effects do not shift the location of these breaks majumdar1965 . While first-principles calculations are often able to make excellent qualitative predictions about the nature of the Fermi surface, when subject to detailed scrutiny in light of precise experimental data it is often found that quantitative differences exist. Shortcomings in the approximations used in the calculations (e.g. exchange-correlation functional, neglect of relativistic effects) mean that in reality it is difficult to get the Fermi surface correct. These differences can often be reduced or eliminated by small shifts of the relevant bands with respect to the Fermi level, and it has recently become feasible, and indeed quite common, to ‘tune’ a band-theoretical calculation in this way (e.g. see Refs. major2004b ; utfeld2009 ; utfeld2010 ). Such an approach requires an accurate description of the positron enhancement, if conclusions regarding details of the FS itself are to be drawn from such a fit, and we now turn our attention to investigate the behavior of our SD model applied to such detailed FS studies.
For the rigid-band fit of the electronic structure, the Fermi level for each band near was fitted to the data. In the case of the SD enhancement model, the orbital enhancement factors were fitted simultaneously. The was computed as before, and the number of electrons enclosed by the fitted FS (i.e. the occupied fraction of the Brillouin zone) was obtained.
The results of the rigid-band fit to the data are displayed in Fig. 4, and demonstrate substantial improvement over the corresponding raw band calculations of Fig. 2. In Table 2, the is shown for each fit, along with the fitted orbital enhancement factors for the SD model. Beginning with some general comments, we note that the orbital enhancement parameters obtained in the SD model are only moderately adapted as a consequence of including the bands in the fit, and the same general trends are observed. Additionally, it is noteworthy that in almost every case the shift in the energy band (see Table 3) is found to be smallest for the SD model (with the exception of band 3 of V).
Fig. 5 shows the RMD along the same path through the BZ as in Fig. 3, and we will now concentrate in more detail on the agreement between experiment and theory. As indicated by the small change in electron count of the shifted bands, the change in the FS itself is small, owing to the appreciable dispersion of band 6 at , and the shift in the Fermi wavevector is (just of the resolution function).
| Ag | IPM | - | - | - | - | 5.53 |
| JS | - | - | - | - | 4.84 | |
| SD | 0.88 | 1.00 | 0.85 | (0.76) | 4.09 | |
| V | IPM | - | - | - | - | 7.77 |
| JS | - | - | - | - | 8.40 | |
| SD | 0.61 | 1.00 | 0.63 | (0.49) | 3.79 | |
| Cr | IPM | - | - | - | - | 2.52 |
| JS | - | - | - | - | 1.85 | |
| SD | 0.83 | 1.00 | 0.61 | (1.27) | 1.28 | |
The improvement is much more dramatic for V (Fig. 5b), in which the size of the -hole features in the data is now well-described by all of the enhancement models, stemming from opposite shifts in bands 2 and 3. After rigidly shifting the bands, the IPM and JS demonstrate similar shifts of the energy bands and a similar goodness-of-fit parameter, leading to an excess in occupied volume of 0.14 and 0.10 of an electron The improvement in the SD model is more pronounced, however. The bands are well known to be placed too low by the LDA with respect to bands. As noted in Ref. major2004b , band 2 (of predominantly character) is pushed up in energy by the fit towards the higher character of band 3, which is pulled down by the fit, correcting this tendency.
| band shifts / mRy | electron +/- | ||||
|---|---|---|---|---|---|
| Ag | band 6 | - | - | ||
| IPM | -21.2 | - | - | +0.08 | |
| JS | -18.3 | - | - | +0.07 | |
| SD | -14.2 | - | - | +0.05 | |
| V | band 2 | band 3 | - | ||
| IPM | +22.3 | -15.8 | - | +0.14 | |
| JS | +26.5 | -15.4 | - | +0.10 | |
| SD | +18.8 | -16.4 | - | +0.17 | |
| Cr | band 3 | band 4 | band 5 | ||
| IPM | -25.1 | +15.6 | +13.2 | -0.02 | |
| JS | -22.9 | +12.2 | +13.2 | -0.01 | |
| SD | -18.5 | +5.0 | +13.2 | 0.02 | |
The energy shifts of the bands are also in good agreement with quantum oscillations. Comparing the semi-axis radii of the ellipsoids with high-quality dHvA parameterizations (see Table 4), we find much improved correspondence with experiment than the raw calculation, and indeed they compare favorably with the shifts of Ref. major2004b . The differences in the results of Ref. major2004b and the current k-space approach reflect the different sensitivity of the two techniques to specific features of the data (for example, compare the - radius with the - radius). It is also worth mentioning that the jungle-gym FS also originates from band 3, and that this will also contribute to the shifts of this band, and so considering the orbits about the -ellipsoids alone may be misleading. Unfortunately, there is a dearth of data for this sheet of FS, and comparisons are hard to draw. As a final point, quantum oscillations appear to be relatively insensitive to the FS of band 2, whereas we find a strong dependence of our fit to that band, in agreement with other positron studies in V singh1985b ; pecora1988 .
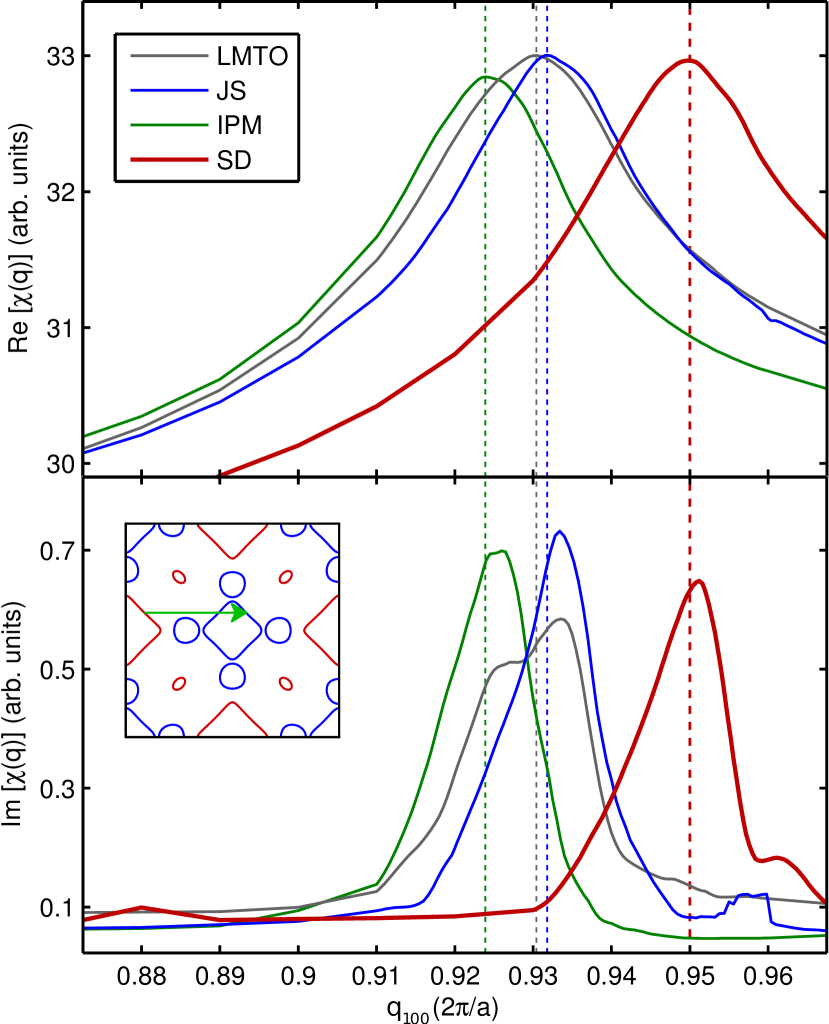
Finally, for Cr (Fig. 5c), the data are reasonably well described by the SD model throughout the BZ, whereas the IPM and JS models struggle near the points in both the raw band calculations and the rigid-band fits. In the absence of high-precision FS data for paramagnetic Cr, owing to the ordering temperature (K) of the spin-density wave, a robust comparison can instead be made of the nesting vector of the paramagnetic FS that is widely believed to determine the ordering (and has remained difficult to establish experimentally). High-resolution neutron diffraction measurements have established the ordering vector to be (see Ref. fawcett1988 and references therein). Our raw LMTO calculations predict (via a computation of the static susceptibility, , see for example Ref. laverock2009 ) a nesting vector (see Fig. 6), which is rather smaller than the neutron measurements. Since quantum oscillations are precluded in the paramagnetic phase (and have recently remained unobserved from the relevant FS sheets in the ordered phase owing to strong spin-fluctuation induced scattering ditusa2010 ), the only data on the FS that has been capable of extracting this nesting vector have been some recent angle-resolved photoemission measurements on Cr(110) thin films schafer1999 ; rotenberg2005 , in which a nesting vector of is reported, in very good agreement with neutron measurements. Our rigid-fit to the data (Fig. 6) culminates in a FS nesting vector of , where the error quoted is the combined error from shifting the two bands to match the experimental results, representing the highest-precision experimental confirmation of the relevant dimensions of the FS of paramagnetic Cr from a bulk measurement. In contrast to this excellent agreement, the shifts of the bands obtained using the IPM and JS models suggest nesting vectors of and respectively.
The conclusions we draw from this section are the following. First, our approach provides a robust empirical means of measuring the orbital electron-positron enhancement factors, that are truly state-dependent (i.e. k-dependent). Second, this measurement is not so strongly dependent on the accuracy of the band calculation, being rather more sensitive to the overall shape of the momentum distribution. Third, simultaneous fitting of the energy bands and the orbital enhancement lead to a tuned FS that is in better agreement with other FS data than is the raw band calculation, as well as in good agreement with previous p-space fitting approaches. Finally, the band shifts that are required to reproduce experimental data (that is in better agreement) are generally smaller for the SD model than the other approaches investigated here, indicating that artificially large rigid shifts in the bands can develop as a consequence of an inadequate description of the enhancement.
| direction | LMTO | Ref. parker1974 dHvA | SD fit | Ref. major2004b fit |
|---|---|---|---|---|
| - | 0.257 | 0.223 | 0.245 | |
| - | 0.254 | 0.212 | 0.231 | |
| - | 0.168 | 0.176 | 0.160 |
IV Simple metals
We now turn to the other regime of enhancement, in which the bands, of character, are closer to the nearly free electron model. Aluminium and the alkali metals (and their alloys) provide a more stringent test for the SD model. The electron-gas parameter of Al is , above the point at which the JS (which does not conserve the low-density limit) and the BN (which does) begin to diverge; as a consequence JS is not expected to perform well here.
The FS of Al is composed of two bands, one which forms a -centred hole sheet from band 2 that lies completely in the first BZ, and from band 3 a so-called ‘dismembered monster’, that consists of square electron rings that run the length of the edges of the first BZ except at the corners (-points) cracknell1969 . Two 2D-ACAR projections along the [110] and [111] directions were measured at room temperature and compared with LMTO calculations performed over 1505 k-points in the irreducible BZ using the IPM, JS and SD enhancement as before.
In Fig. 7, the data for the [111] projection is shown alongside the LMTO calculations of the RMD. The FS structure can be clearly seen in the data (shown in the bottom right panel), where the low density in the center reflects the band 2 hole sheet, and the higher density at the edges of the projected BZ come from the electron rings of band 3. At the corner of the projected BZ (near the -point), the particularly high region is due to the projection of the rings in neighbouring zones along the directions. As can be seen in the left panels of Fig. 7, the IPM and JS models are particularly poor at describing the enhancement at the edges of the zone that connect these strong features. Moreover, a small local peak at that is predicted by both IPM and JS is not observed at all in the data. Quantitatively, as might be expected from the electron density of Al, the JS model fairs poorly for the raw band calculation, and even worse than the IPM (see Table 5). The SD model, however, does an excellent job of describing the RMD of Al, correctly accounting for the absence of the local peak at and the connectivity of the strong features near , and leading to an almost order-of-magnitude improvement in the parameter. Here, the -states are de-enhanced substantially, presumably owing to them lying very low in energy. Unlike the previous -electron systems, the de-enhancement of the (unoccupied) states is not observed for Al.
| raw band | |||||
|---|---|---|---|---|---|
| IPM | - | - | - | - | 15.40 |
| JS | - | - | - | - | 17.20 |
| SD | 0.53 | 1.00 | (1.29) | (0.60) | 2.29 |
| rigid fit | |||||
| IPM | - | - | - | - | 3.93 |
| JS | - | - | - | - | 3.92 |
| SD | 0.60 | 1.00 | (1.09) | (0.72) | 2.12 |
| band shifts / mRy | electron +/- | ||
|---|---|---|---|
| band 2 | band 3 | ||
| IPM | -39.2 | -30.0 | +0.21 |
| JS | -40.0 | -33.7 | +0.22 |
| SD | -11.9 | -10.2 | +0.07 |
When the bands are fitted, the agreement between data and theory for each model is very good. However, for the IPM and JS models the local peak at persists, albeit at a much weaker amplitude. Moreover, consistent with the previous conclusions, the shifts in the energy bands are substantially larger for the IPM and JS models than the SD model (see Table 6), leading to an electron excess of (over a single FS sheet). For the SD model, this discrepancy is much reduced, at just 0.07 electrons. Similarly to Ag, the FS of Al is already well-described by the LMTO calculation, and comparisons with quantum oscillatory data kamm1963 ; larson1967 agree with the raw band and SD rigid-band fit to within ( of the resolution function).
V Phenomenological model
Given the above results, we aim to find a phenomenological model that imparts predictive capability on the calculation of the RMD. Taking the SD fitted FS as a baseline, we attempt to improve on the SBA model of the enhancement. The predictions of the SBA enhancement are, in general, satisfactory, offering a similar description of the experimental RMD (in some cases slightly better, in others slightly worse) to the JS enhancement model. The predictions of the SBA model can be understood largely from the perspective of the localization of the states, in which and states experience similar enhancement over the IPM, with the states in transition metals slightly less than due to their slightly more localized nature in these systems. The states are enhanced much less in the transition metals, associated with the greater localization, and the increasing localization as the -band becomes more filled is reflected by the greater de-enhancement of the -states in Ag when compared with either Cr or V.
The Kahana model for enhancement, applied to a homogeneous electron gas and parameterized in terms of , is not expected to work well for -band systems, in which the effects of the crystal lattice can completely hide the Kahana nature. For this reason, Mijnarends and Singru (MS) mijnarends1979 proposed a scheme parameterized by , where is the energy at the bottom of the conduction band,
| (10) |
where , and are constants determined by the electron gas parameter . For a parabolic band this is identical to Kahana’s formalism. MS demonstrated the applicability of their prescription for the case of Cu, in which substantial improvement was found (in p-space) with this description. The SBA model accounts for the variations in enhancement due to the localization of a particular orbital, and its overlap with the positron wavefunction, but does not consider the proximity of a state to the Fermi level, leading to an over-estimation of the enhancement of more tightly-bound, filled electron shells. Adding such a scheme to the SBA model was not found to universally explain the variations in enhancement for our experimental data without different choices of the constants , and (in fact, following MS, we choose to set in Eq. 10 so that and ).
| SBA | SBA-MS | |||
|---|---|---|---|---|
| V | 20.41 | 23.80 | 0.700 | 4.30 |
| Cr | 2.50 | 9.52 | 0.202 | 1.39 |
| Ag | 4.71 | 3.60 | 0.042 | 4.50 |
| Al | 7.90 | 5.04 | 0.589 | 2.28 |
Of particular interest in this analysis is the enhancement for V and Cr, which are neighbors in the periodic table and would therefore, from the perspective of a homogeneous electron gas, be expected to follow similar trends in their enhancement owing to their similar electron density. As can be seen in Table 2 the measured enhancement of V and Cr is quite different, and yet V and Cr can each be well-approximated by a calculation of the other’s electronic band structure, with a simple extrapolation of to account for the different band-fillings (i.e. the rigid-band approximation works well). The usual prescriptions for enhancement, in terms of the electron density, or even a MS type energy-dependent enhancement, fail to predict such different shell enhancements. Substituting the measured SD enhancement parameters for Cr into the V calculation, and vice versa, is not found to describe the data well, enforcing the idea that the enhancement is substantially and fundamentally different for these two elements. Since V and Cr are electronically very similar, exhibiting the same body-centered cubic structure, the largest difference between the two is in their band filling and FS. In V, lies close to a peak in the density of states with appreciable ( %) -character, leading to a total number of states at of states per Ry per atom. In paramagnetic Cr, on the other hand, the additional electron places in a valley between the bonding and anti-bonding -states with states per Ry per atom. It follows that the number of electrons that are capable of screening the positron impurity (and thus lead to the enhancement of the annihilation rate) in V and Cr is very different, and cannot be captured by considerations of the electron density or energy alone. However, such a concept does provide a route to understanding the different SD enhancement models in V and Cr, and the different constants and in Eq. 10 that are required to explain the data.
In order to test such a correction to the enhancement, we apply a MS-type enhancement to the SBA model, which is then fitted to the experimental data. According to Kahana’s theory, the quadratic part of the enhancement parameterization is fairly weak, with for metallic densities, and can be well approximated by just a linear component (). Here, we adopt just this linear energy enhancement, and set in Eq. 10, leaving just a single fitting parameter that is capable of adjusting the shape of the computed RMD:
| (11) |
The results of such a model, which we refer to as SBA-MS enhancement, are found to enormously improve the agreement between data and theory for all materials (see Table 7), leading to parameters that approach the SD model investigated in Section III. Moreover, for the three transition metal elements addressed in this manuscript, this linear component of energy enhancement is found to scale with the density of states at the Fermi level (Table 7), providing an empirical model for the enhancement of -band elements and compounds. For - electron metals, the enhancement is found to more closely resemble Kahana’s parameters, and two regimes emerge – Kahana’s prediction for - simple metals, and a -dependent set of parameters for electron metals. It is interesting to compare our results for an MS-type enhancement to those applied by Matsumoto and Wakoh for Cr matsumoto1987 , in which they obtain a factor in a non-optimized approach, very close to our 0.20. On the other hand, Genoud genoud1990 , employing an MS-type enhancement independently for , and electrons in V, obtained for and electrons, also in a non-optimized way, which is somewhat smaller than the optimum that we find.
Armed with such a model for the enhancement, we can now assess its validity for another metal, specifically the electron metal Mo, for which we have just a single [110] projection available, insufficient to permit a reliable fit of the parameters of the SD model. Instead, we apply the SBA-MS model to the data, in which the ’s are computed from the partial annihilation rates of state and the energy-dependent enhancement is provided from states / Ry / atom and our preceding fit. For comparison, we also compute the IPM and JS RMD. Both the JS and SBA models of enhancement, by themselves, offer negligible improvement over the IPM, which already provides a reasonable description of the data, and the application of the SBA-MS model improves the agreement only modestly by %. However, lending freedom to the linear component is not found to provide any additional improvement, emphasizing that the original IPM calculation was already satisfactory.
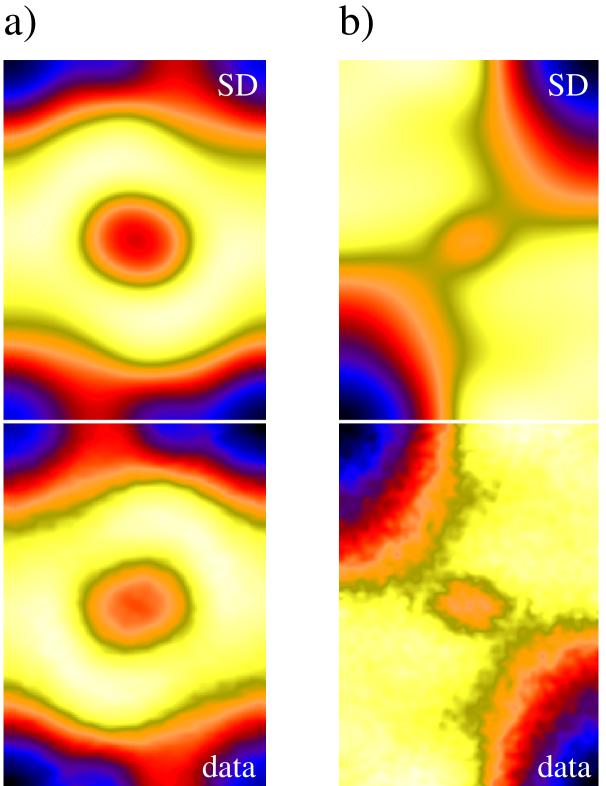
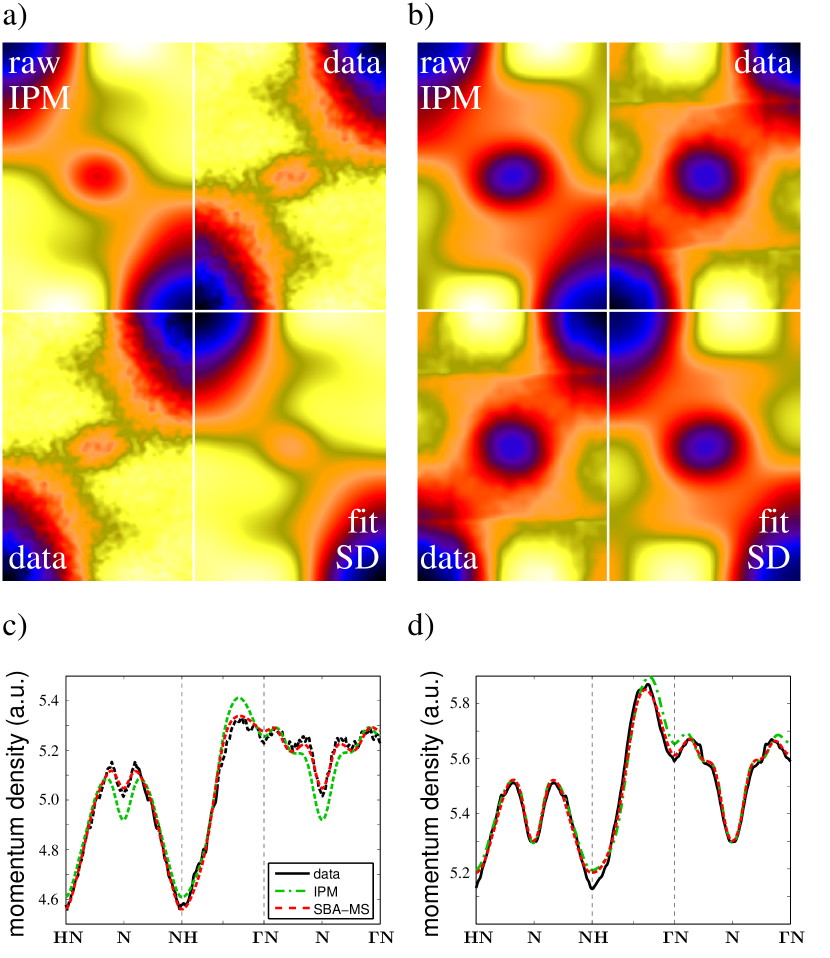
One of the unresolved questions of 2D-ACAR in transition metals is why the k-space density of Cr and Mo (projected along the [110] direction) appear so different, despite the apparent similarity of their isoelectronic and isostructural FS topology dugdale1998 (see Fig. 8a,b). In Ref. dugdale1998 , maximum-entropy filtering techniques were employed to assess the FS breaks in both distributions, ruling out the FS topology as an explanation; the question of whether positron effects or consequences of the proximity to magnetic structure in Cr are to blame were left open and have remained so despite several efforts to resolve the issue, both experimentally and theoretically dugdale2000 ; biasini2000 ; rubaszek2002 . Here, we are able to solve this issue, which stems from a strong over-estimation of the enhancement near in Cr, previously highlighted in Fig. 3. In Fig. 8c,d, the RMD along a path in the BZ is shown for both Cr and Mo for the 2D-ACAR data, and the IPM and SBA-MS models of enhancement. It is clear that the IPM (which resembles the JS model) looks similar for both metals, eliminating positron wavefunction effects (which are included in the IPM) as responsible for the strong difference in the data. On the other hand, the SBA-MS prediction (which closely resembles our measured SD model), accounts for the data very closely, unambiguously establishing enhancement effects as the key.
VI Conclusions
We have presented a detailed investigation of the positron enhancement factor for several metals, providing a quantitative measurement of the state-dependence of the enhancement. By combining this with a rigid shift of the energy bands, we demonstrate that, when the band structure is optimized to 2D-ACAR measurements, the precise location of the Fermi breaks in k-space are sensitively dependent on the accuracy of the enhancement model used in the calculation. Furthermore, we show that, by employing a state-dependent model for the enhancement, much improved agreement between the ‘tuned’ calculation and high-precision quantum oscillatory data can be obtained. In particular, for Cr our positron measurements yield a nesting vector that is in excellent agreement with neutron measurements of the spin-density wave ordering vector, with an estimated accuracy better than 0.5% of the BZ. Although alloys have not been investigated here, this approach also allows for the contribution from different atomic sites to be separated in the experimental data, allowing a determination of the fraction of annihilations from each individual element’s hybridized wavefunctions (for example, see Ref. al3li ).
Comparisons of our (empirical) model with other popular models of the enhancement have been made, particularly with the ab initio state-dependent model of Barbiellini, Alatalo and co-workers barbiellini1997 , for which a semi-empirical energy-dependent correction is proposed that is found to bring the theory into much better agreement with the data. Such a combined model therefore provides an accurate model for the enhancement in momentum density measurements, such as those of 2D-ACAR or coincidence Doppler broadening techniques.
Acknowledgments
We acknowledge the financial support of the EPSRC (UK). We are indebted to the late Maurizio Biasini for providing us with the 2D-ACAR data of Ag, and would also like to thank Bernardo Barbiellini for stimulating discussions.
References
- (1) R. N. West, in Proceedings of the International School of Physics Enrico Fermi — Positron Spectroscopy of Solids, edited by A. Dupasquier and A. P. Mills, jr. (IOS Press, Amsterdam, 1995).
- (2) S. Kahana, Phys. Rev. 129, 1622 (1963).
- (3) J. Arponen and E. Pajanne, J. Phys. F: Met. Phys. 9, 2359 (1979).
- (4) H. Stachowiak and A. Rubaszek, Solid State Phenom. 28-29, 7 (1993).
- (5) B. Barbiellini, M. Hakala, M. J. Puska, R. M. Nieminen and A. A. Manuel, Phys. Rev. B 56, 7136 (1997).
- (6) M. Alatalo, B. Barbiellini, M. Hakala, H. Kauppinen, T. Korhonen, M. J. Puska, K. Saarinen, P. Hautojärvi and R. M. Nieminen, Phys. Rev. B 54 2397 (1996).
- (7) H. Sormann, Phys. Rev. B 54, 4558 (1996).
- (8) A.K. Singh and T. Jarlborg, J. Phys. F: Met. Phys. 15, 727 (1985).
- (9) B. Barbiellini, S. B. Dugdale and T. Jarlborg, Computational Materials Science 28, 287 (2003).
- (10) B. Barbiellini, M. J. Puska, T. Torsti and R. M. Nieminen, Phys. Rev. B 51, 7341 (1995).
- (11) E. Boroński and R. M. Nieminen, Phys. Rev. B 34, 3820 (1986).
- (12) T. Jarlborg and A. K. Singh, Phys. Rev. B 36, 4660 (1987).
- (13) B. Barbiellini, P. Genoud and T. Jarlborg, J. Phys. Condens. Matter 3, 7631 (1991).
- (14) Zs. Major, S. B. Dugdale, R. J. Watts, J. Laverock, J. J. Kelly, and D. C. R. Hedley, J. Phys. Chem. Solids 65, 2011 (2004).
- (15) P. E. Mijnarends and R. M. Singru, Phys. Rev. B 19, 6038 (1979).
- (16) S. Daniuk, G. Kontrym-Sznajd, A. Rubaszek, H. Stachowiak, J. Mayers, P. A. Walters and R. N. West, J. Phys. F: Met. Phys. 17, 1365 (1987).
- (17) T. Jarlborg, B. Barbiellini, E. Boroński, P. Genoud and M. Peter, J. Phys. Chem. Solids 52, 1515 (1991).
- (18) M. Šob, J. Phys. F: Met. Phys. 12, 571 (1982).
- (19) A. Rubaszek, Z. Szotek and W. M. Temmerman, Phys. Rev. B 58, 11285 (1998).
- (20) J. Svoboda and M. Šob, Philos. Mag. B 48, 523 (1983).
- (21) M. Matsumoto and S. Wakoh, J. Phys. Soc. Jpn. 56, 3566 (1987).
- (22) P. Genoud, Ph.D. thesis, Unviersité de Genève (1990).
- (23) C. K. Majumdar, Phys. Rev. 140, A227 (1965).
- (24) C. Utfeld, S. R. Giblin, J. W. Taylor, J. A. Duffy, C. Shenton-Taylor, J. Laverock, S. B. Dugdale, M. Manno, C. Leighton, M. Itou and Y. Sakurai, Phys. Rev. Lett. 103 226403 (2009).
- (25) C. Utfeld, J. Laverock, T. D. Haynes,S. B. Dugdale, J. A. Duffy, M. W. Butchers, J. W. Taylor, S. R. Giblin, J. G. Analytis, J. H. Chu, I. R. Fisher, M. Itou and Y. Sakurai, Phys. Rev. B 81 064509 (2010).
- (26) D. G. Lock, V. H. C. Crisp and R. N. West, J. Phys. F: Met. Phys. 3, 561 (1973).
- (27) B. Barbiellini, M. J. Puska, T. Korhonen, A. Harju, T. Torsti and R. M. Nieminen, Phys. Rev. B 53, 16 201 (1996).
- (28) M. J. Puska, O. Jepsen, O. Gunnarsson and R. M. Nieminen, Phys. Rev. B 34, 2695 (1986).
- (29) F. James, CERN Program Library D506, MINUIT–Function Minimization and Error Analysis, 1994, http://consult.cern.ch/writeups/minuit, http://c-minuit.sourceforge.net.
- (30) H. Takenaka and D. J. Singh, Phys. Rev. B 77, 155132 (2008).
- (31) I. Makkonen, M. Hakala and M. J. Puska, Phys. Rev. B 73, 035103 (2006).
- (32) P. Asoka-Kumar, M. Alatalo, V. J. Ghosh, A. C. Kruseman, B. Nielsen and K. G. Lynn, Phys. Rev. Lett. 77, 2097 (1996).
- (33) M. R. Halse, Phil. Trans. R. Soc. Lond. A 265, 507 (1969).
- (34) P. T. Coleridge and I. M. Templeton, J. Phys. F: Met. Phys. 2, 643 (1972).
- (35) P. T. Coleridge and I. M. Templeton, Phys. Rev. B 25, 7818 (1982).
- (36) A. K. Singh, A. A. Manuel, R. M. Singru, R. Sachot, E. Walker, P. Descouts and M. Peter, J. Phys. F: Met. Phys. 15, 2375 (1985).
- (37) L. M. Pecora, A. C. Ehrlich, A. A. Manuel, A. K. Singh, M. Peter and R. M. Singru, Phys. Rev. B 37, 6772 (1988).
- (38) A. K. Singh and R. M. Singru, J. Phys. F: Met. Phys. 14, 1751 (1984).
- (39) R. D. Parker and M. H. Halloran, Phys. Rev. B 9, 4130 (1974).
- (40) E. Fawcett, Rev. Mod. Phys. 60, 209 (1988).
- (41) J. F. DiTusa, R. G. Goodrich, N. Harrison and E. S. Choi, Phys. Ref. B 82, 075114 (2010).
- (42) H. M. Fretwell, S. B. Dugdale, M. A. Alam, M. Biasini, L. Hoffmann and A. A. Manuel, Europhys. Lett. 32 771 (1995).
- (43) R. J. Hughes, S. B. Dugdale, Zs. Major, M. A. Alam, T. Jarlborg, E. Bruno and B. Ginatempo, Phys. Rev. B 69, 174406 (2004).
- (44) S. B. Dugdale, H. M. Fretwell, D. C. R. Hedley, M. A. Alam, T. Jarlborg, G. Santi, R. M. Singru, V. Sundararajan and M. J. Cooper, J. Phys.: Condens. Matter 10, 10367 (1998).
- (45) B. Barbiellini and T. Jarlborg, J. Phys.: Condens. Matter 1, 8865 (1989).
- (46) B. Barbiellini and A. Bansil, J. Phys. Chem. Solids 66, 2192 (2005).
- (47) J. Laverock, T.D. Haynes, C. Utfeld and S.B. Dugdale, Phys. Rev. B 80, 125111 (2009).
- (48) J. Schäfer, E. Rotenberg, G. Meigs, S. D. Kevan, P. Blaha and S. Hüfner, Phys. Rev. Lett. 83, 2069 (1999).
- (49) E. Rotenberg, B. K. Freelon, H. Koh, A. Bostwick, K. Rossnagel, A. Schmid and S. D. Kevan, New J. Phys. 7, 114 (2005).
- (50) A. P. Cracknell, Adv. Phys. 18, 681 (1969).
- (51) G. N. Kamm and H. V. Bohm, Phys. Rev. 131, 111 (1963).
- (52) C. O. Larson and W. L. Gordon, Phys. Rev. 156, 703 (1967).
- (53) S. B. Dugdale, H. M. Fretwell, K. J. Chen, Y. Tanaka, A. Shukla, T. Buslaps, Ch. Bellin, G. Loupias, M. A. Alam, A. A. Manuel, P. Suortti and N. Shiotani, J. Phys. Chem. Solids 61, 361 (2000).
- (54) M. Biasini, Physica B 275, 285 (2000).
- (55) A. Rubaszek, Z. Szotek and W. M. Temmerman, Phys. Rev. B 65, 125104 (2002).
- (56) J. Laverock, S. B. Dugdale, M. A. Alam, M. V. Roussenova, J. R. Wensley, J. Kwiatkowska, N. Shiotani, arXiv: 1009.2265v1 (2010).