Warm Cores around Regions of Low-Mass Star Formation
Abstract
Warm cores (or hot corinos) around low-mass protostellar objects show a rich chemistry with strong spatial variations. This chemistry is generally attributed to the sublimation of icy mantles on dust grains initiated by the warming effect of the stellar radiation. We have used a model of the chemistry in warm cores in which the sublimation process is based on extensive laboratory data; these data indicate that sublimation from mixed ices occurs in several well-defined temperature bands. We have determined the position of these bands for the slow warming by a solar-mass star. The resulting chemistry is dominated by the sublimation process and by subsequent gas-phase reactions; strong spatial and temporal variations in certain molecular species are found to occur, and our results are, in general, consistent with observational results for the well-studied source IRAS 16293-2422. The model used is similar to one that describes the chemistry of hot cores. We infer that the chemistry of both hot cores and warm cores may be described by the same model (suitably adjusted for different physical parameters).
keywords:
Astrochemistry - Stars: low-mass, formation - ISM: abundances, molecules1 Introduction
The early stages of low-mass star formation are observed at millimetre and submillimetre wavelengths, where both the dust continuum as well as molecular emission from the outer regions of the envelope can be detected. The dynamical aspect of low-mass star formation, with low mass stars forming from dense and cold condensations called prestellar cores, and evolving into Class 0 and I sources, is relatively well defined. What is less well understood is how prestellar cores evolve chemically into protostellar cores which then, eventually, develop protoplanetary disks. Nevertheless, it is now clear that, as in the case of massive star formation, towards the end of the collapse phase the gas and dust are dense and cold enough that (other than H2 and He) material has frozen onto the dust and that surface chemistry has taken place, leading to a rich gas phase chemistry once the star heats the surrounding dust so that icy mantles returned to the gas phase. The warm cores where the icy mantles sublime are often called ‘hot corinos’ (e.g. Ceccarelli 2004, 2007) due to their chemical resemblance with hot cores. Recent observations toward several warm cores around low-mass solar-like protostars have shown that they are rich in large, complex organic molecules (COMs) including methanol CH3OH, methyl formate HCOOCH3, methyl cyanide CH3CN, and more complex species such as ethylene glycol (CH2OH)2 (e.g. Cazaux et al. 2003; Bottinelli et al. 2004; Hollis et al. 2004; Bisschop et al. 2008). For a comprehensive review on complex organic interstellar molecules we refer the reader to Herbst & van Dishoeck (2009). In addition, they show some interesting deuterated species (e.g. Ceccarelli et al. 1998a; Caux et al. 2005), and long-chain unsaturated hydrocarbons and cyanopolyynes (Sakai et al., 2008). In fact, the envelope of Class 0 sources can be divided chemically into two zones: the zone where all the ices sublime (dust temperature K), i.e. the warm core region, and the outer cold envelope (dust temperature K) (e.g. Ceccarelli 2005). The chemistry in the outer envelope is similar to that in pre-stellar cores, which are cold ( K) and dense ( cm-3) condensations believed to be precursors of the Class 0 sources (Bergin & Tafalla, 2007). Many molecules in the outer envelope are frozen onto the grain mantles, so that their abundances are often lower than those in molecular clouds. In the inner regions, sublimation is clearly important.
The first model of the thermal structure of a low-mass protostellar envelope was developed by Ceccarelli et al. (1996). In this model, the authors considered the chemistry and resulting line emission within the inside-out collapse model (Shu, 1977) but down to much smaller scales of AU. In their model, the gas temperature in the innermost regions of the envelope reaches K resulting in the sublimation of H2O from grain mantles.
More recent models (e.g. Ceccarelli et al. 2000b; Maret et al. 2004) suggest that molecular emission (e.g. from H2CO) is emitted by two components: a cold H2CO-poor outer envelope and a warm H2CO-rich core. The model calculations show a dramatic increase in the abundances of H2CO, H2O, and SiO in the inner, warmer, and denser region of the envelope. This abrupt change occurs when the dust temperature exceeds 100 K and grain mantles sublime.
Evidently, in situations where a cool outer envelope and a warmer core exist, sublimation - and the subsequent gas-phase chemistry that this causes - will be important. Also, the sublimation will be a time- and space-dependent event as the central protostar warms up. Given the role of sublimation, it is important to take account of recent laboratory studies of the sublimation of ices (Collings et al., 2003a, 2004) which show that different species enter the gas phase at different temperatures, and that the sublimation occurs not continuously through a gradual warm-up but in several well-defined and narrow temperature bands. Such a process may give rise to a rather different gas-phase chemistry than a process in which instantaneous sublimation of all species in a mantle occurs, as found to be the case for hot cores (Viti et al., 2004).
Our purpose in this paper is, therefore, to model the sublimation process, taking account of the laboratory data, in the context of warm cores in low-mass star-forming regions. We wish to assess whether the more complex sublimation mechanisms indicated by the laboratory studies significantly affect the detectable chemistry in these objects, as compared to models in which the desorption is instantaneous for all species. The model we use is developed from a similar model used for the study of hot cores in regions of massive star formation (Viti et al., 2004). Further, if the two similar models can successfully describe cores in both types of star-forming region, then this may be taken as support for the view that star formation is carried out by essentially the same process, regardless of mass. We describe our model in Section 2, the results are given in Section 3, and we make some conclusions in Section 4.
2 The Model
In order to investigate the chemical evolution of low-mass star forming regions, we have used a time-dependent gas-grain chemical model adapted from the Viti et al. (2004) hot core model. In this work, our model follows the chemical evolution of a free-fall collapsing cloud in the process of forming a low-mass star, then explores the chemical evolution of the remnant of the warm core located in the vicinity of the newly formed star. The core is represented by a uniform slab subdivided into 5 shells represented by 5 depth points of increasing visual extinction from the edge of the core to its centre. The results are obtained from a two-phase calculation: Phase I, the collapsing phase, in which diffuse, mainly atomic material of initial number density cm-3 at a temperature of 10 K undergoes collapse following the so-called modified free-fall collapse described in Rawlings et al. (1992) until the number density reaches the typical density of a warm core (treated as a free parameter). The initial elemental abundances relative to hydrogen that we have adopted are listed in Table 1 (Viti et al., 2004). During this time, gas-phase chemistry occurs and atoms and molecules are depleted on to grain surfaces and hydrogenate when possible. The depletion efficiency is determined by the fraction of the gas-phase material that is frozen on to the grains. This fraction is arranged by adjusting the grain surface area per unit volume, and assumes a sticking probability of unity for all species. The fraction of material on grains is then dependent on the product of the sticking probability and the amount of cross-section provided per unit volume by the adopted grain size distribution. Note that, as the chemistry is time-dependent, different species form at different times, and as a consequence the material frozen out on the grains at any one time is representative not of the whole gas but of selected species. Apart from direct hydrogenation, the only other surface reactions we include are the formation of CH3OH and H2CO from CO and of CH3CN from the reaction of methane, CH4, with HCN, as it has been shown that gas phase reactions are not sufficient to form CH3OH and CH3CN (e.g. Tielens & Hagen 1982; Watanabe et al. 2003; Garrod et al. 2008).
In Phase II, the warming-up phase, we follow the chemistry of the remnant core, after the star is born, for 107 yrs, assuming a uniform density throughout the core. In this phase, the central star heats up the surrounding gas and dust, causing sublimation of the icy mantles. In the present work, we simulate this heating effect in the same way as in Viti et al. (2004). We assume that the presence of an infrared source in the centre of the core or in its vicinity causes an increase in the gas and dust temperature. The temperature is a function of the luminosity (and therefore age) of the protostar as in Viti et al. (2004), but here we adjust the luminosity/mass power law to account for lower protostellar masses than in the hot core case. The temperature reaches its maximum (assumed to be 100 K) at years which is the assumed (typical) age of Class 0 sources (André et al., 1993).
During the warming-up phase (Phase II) of the core, the mantle species desorb in various temperature bands. Collings et al. (2003a, 2004) reported results of Temperature Programme Desorption (TPD) experiments for a large number of molecules. They showed that molecular ices can be divided into five categories: (i) CO-like; (ii) H2O-like; (iii) intermediate; (iv) reactive; (v) refractory. For each category one can estimate the fraction of a particular molecular species that is desorbed in various temperature bands. These bands are from 1) the pure species; 2) a monomolecular layer on H2O ice; 3) desorption during the amorphous-to-crystalline H2O ice conversion (the ‘volcano’ effect); 4) co-desorption when the H2O ice desorbs; and 5) desorption of the bare grain surface (see Collings et al. 2004 for more details).
Based on the previously mentioned experimental results, Collings et al. (2003b) constructed a rate model to explain desorption processes in a phenomenological manner over relevant astronomical time scales. By running this chemical kinetic simulation of water-ice desorption, we calculated the different desorption temperatures using a power-law temperature profile fitted to a Sun-like star. Viti et al. (2004) used the observed luminosity function of Molinari et al. (2000), and correlated the effective temperature of the gas with the age of the accreting protostar through a simple power law. Nomura & Millar (2004) solved the radiative transfer equation for a clump warmed by a central star assuming that the radial profile of the temperature is defined as the inverse square law , which is comparable to the profile obtained by Schöier et al. (2002) in which . In our model, the temperature evolves in both time and space. The temperature profile in our model, shown in Eq.(1), is derived by combining the approach of Viti et al. (2004) with that of Nomura & Millar (2004):
| (1) |
where is the temperature profile of gas and dust in the core surrounding the stellar object, is the evolutionary age of the collapsing core, is the distance from the core centre, and is the core radius. and are two constants derived from the boundary conditions, in this case, the temperature at 150 AU from the star at = 0 (T = 10 K) and = 105 yrs (T = 100 K). The latter condition corresponds to the temperature obtained by Schöier et al. (2002). We find that the temperature profile of a typical warm core capable of reproducing with high accuracy the empirical assumptions we consider is given by
| (2) |
Eq. (2), was then inserted in the chemical kinetic program (Collings et al., 2003b) to estimate the position of the different desorption bands. From this equation it can be seen that the temperature rises slower than in the case of high mass stars (Viti et al., 2004) affecting, as a consequence, the times at which the desorption of the different species occur. The desorption mechanisms, throughout the core, are time- as well as space-dependent processes. The closer to the heating source the earlier the desorption occurs. The volcano and co-desorptions will occur at slightly different temperatures (and times) depending on the depth within the core but they are around 84 K (at 5104 yrs, for the inner shell) and 95 K (at 7104 yrs, for the inner shell) respectively. These results are in line with those previously calculated for hot cores where the desorption temperatures decrease as a function of slowing down of the heating rate so that the lower the stellar mass, the lower the volcano and co-desorption temperatures (see Table 2 in Viti et al. 2004).
Our chemical network is a modified version of the UMIST database (Le Teuff et al., 2000) with 127 gas phase species and 42 mantle species interacting in 1871 chemical reactions. Photo-reactions were included, taking into account both the external interstellar radiation field and the internal cosmic ray induced UV field. Both direct and indirect ionisation by cosmic rays were also included, using a cosmic ray ionisation rate, , of s-1 (Lepp, 1992). Observations of emission lines (e.g from H2CO and H2O) toward low-mass protostellar objects reveal that there is a gradient in both density and temperature. The dust temperature reaches 100 K in cores where the densities vary between cm-3, such as the case of IRAS 16293-2422 (e.g Ceccarelli et al. 2000a, b; Ceccarelli 2004) and cm-3 for NGC 1333-IRAS 4A, B (Maret et al., 2004), and their radii range from 200 AU down to 27 AU.
In order to investigate the sensitivity of the chemistry to the physical parameters of warm cores around low-mass stars, we ran a grid of chemical models where we varied (i) the final density of the collapsing core and (ii) the percentage of the accreted species on to grain surfaces. A characteristic of our chemical model is that we simultaneously follow the chemistry as a function of time and depth: the mantle evaporation is temperature-dependent and the temperature profile is dependent on both the distance from the core centre and time. Table 1 summarises the various physical parameters used in our model. The ice composition at the end of Phase I will depend both on the final density of the collapsing core and the percentage of accreted species on the dust. Typical abundances (with respect to the total number of hydrogen nuclei) for high density and high depletion, for the most relevant species i.e H2O, CO, H2CO, CH4, CH3OH, are 4.010-4, 3.710-5, 3.610-9, 1.410-4, and 3.810-7 respectively. The computed abundance of CH4 in the ice is high and arises as a consequence of our assumption that hydrogenation (in this case, of carbon) is efficient. Detection by ISO of CH4 ice show lower values (van Dishoeck, 2004). However, the ISO beam encompasses material outside the core and the ISO observations are of young stellar objects in which sublimation may have already reduced the CH4 component. Hence, the detection may be under-estimating the CH4 ice abundance within the pre-stellar core.
| Physical parameters | |
|---|---|
| Core density | - cm-3 |
| Core maximum temperature | 100 K |
| Core radius | 30 - 150 AU |
| Depletion percentage | 85 - 100% |
| Initial elemental abundances | |
| Carbon | |
| Oxygen | |
| Nitrogen | |
| Sulphur | |
| Helium | |
| Magnesium | |
3 Results
3.1 Chemical trends
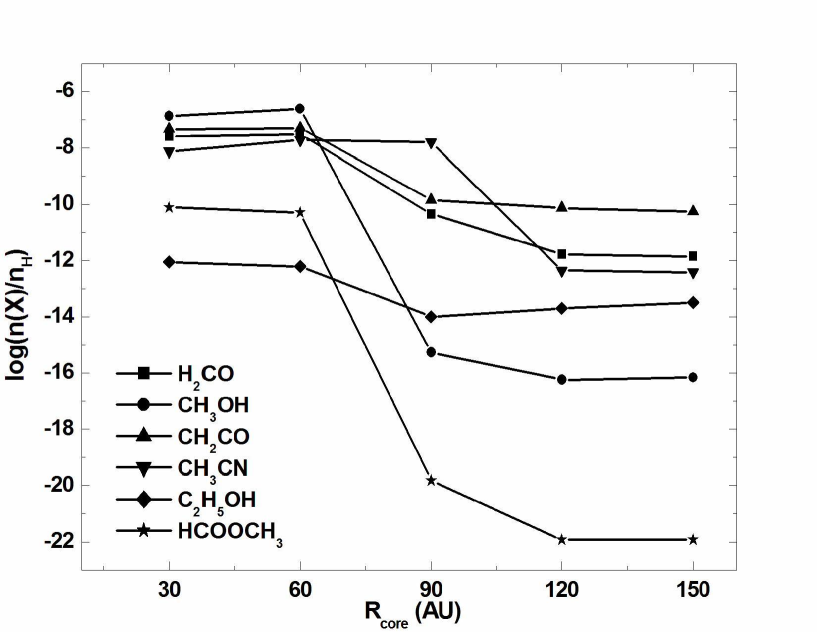
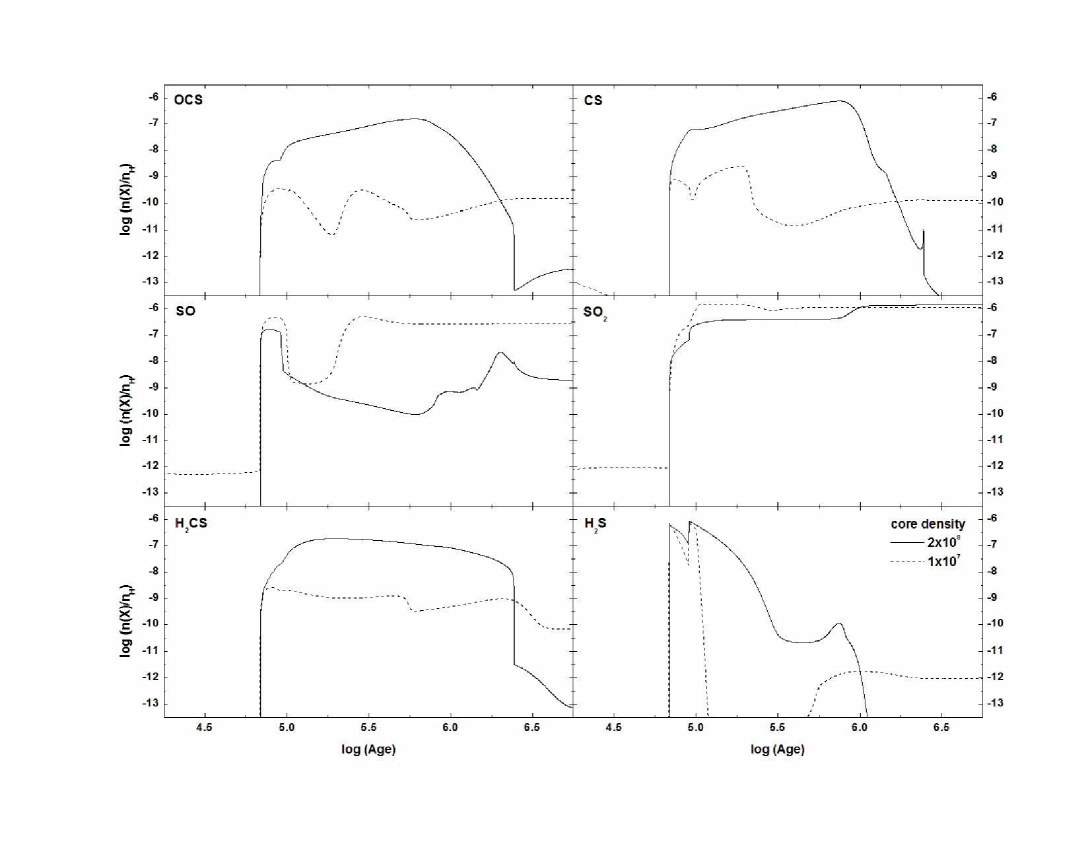
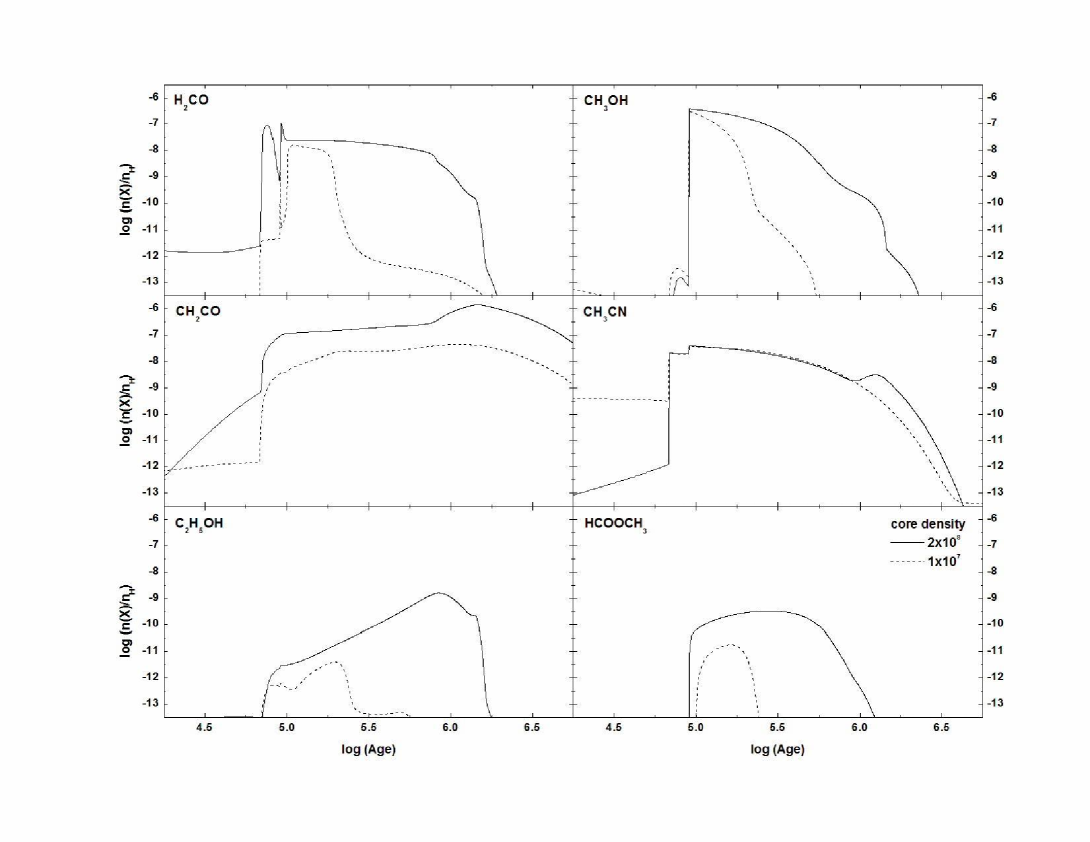
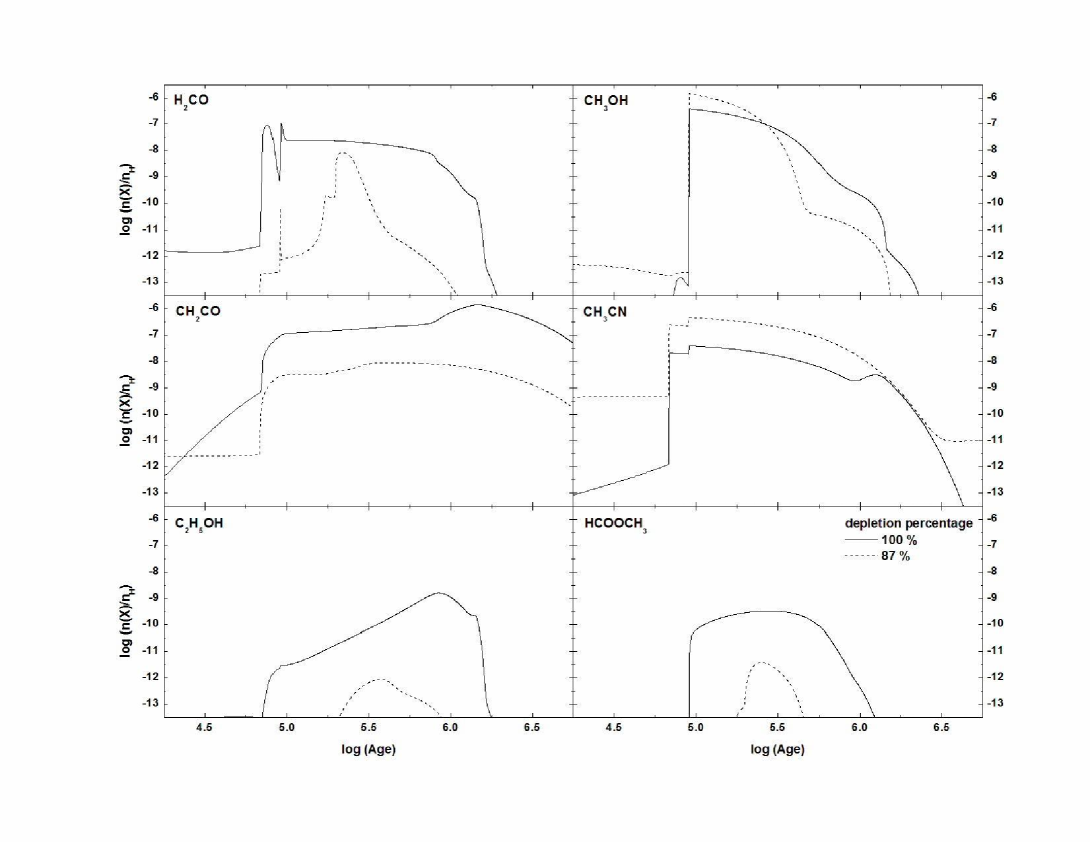
Figure 1 shows how the computed fractional abundance (with respect to the total number of hydrogen nuclei) of selected species varies as a function of the radius of the core at around 4104 yrs: not surprisingly the inner parts of the core show an increase of the molecular fractional abundances for most of the species while they are very low in the outer regions of the core. Such trends are also present as a function of time as shown in Figures 2 and 3, where fractional abundances of selected species as a function of (logarithmic) time at visual extinction of 140 mags for a warm core at two different densities, are presented (cm-3, solid line, and cm-3, dashed line).
All the species in our sample show sudden increases in their abundances corresponding to their multi-step sublimation from grain mantles (see Collings et al. 2004). However, the fractional abundances of H2CO and CH3OH are interesting because they show extra ‘jumps’ which cannot be explained by sublimation from grains. The increase in the abundances of H2CO and CH3OH around these jumps is associated with the ‘volcano’ desorption of CH4 from grains. The increase in H2CO and CH3OH seen in conjunction with the CH4 ‘volcano’ desorption is due to a sequence of gas-phase reactions involving CH4. Although, in our model, both H2CO and CH3OH are formed on grains, via the successive hydrogenation of CO (as confirmed both experimentally and theoretically (e.g. Tielens & Hagen 1982; Watanabe et al. 2003) there is still a contribution from gas-phase chemistry, especially for H2CO. Our detailed chemical analysis shows that at the time of the jump, the formation of H2CO is dominated by the oxidisation of CH3 which is in turn formed efficiently by the destruction of CH4 by He+ ions. Methanol is found to be a secondary product of CH which is mainly formed (at that time) via two ion-molecule reactions involving CH4; one with H and the other with N2H+. Destruction of CH leads to CH which reacts with water to form CH3OH which recombines to give methanol. These sequences of reactions which involve CH4 contribute to the observed amount of both H2CO and CH3OH at the ‘jump’. In fact, the ‘jump’ in abundance for methanol is rather small because the CH3OH recombination reaction is rather inefficient (see Geppert et al. 2006)
For most species, the abundances are lower at lower density with the exceptions of SO and SO2. SO is mainly produced by reactions involving atomic and molecular oxygen during early and late times respectively, while it is destroyed by HCO+ via radical-molecule reactions which are more pronounced during late times. SO is also destroyed while forming SO2 via oxidisation and radical-molecule reactions, during both early and late times. At high densities, SO is destroyed more efficiently than in less dense cores. For less dense cores, the chemistry reaches steady state earlier and the evaporation peaks are more pronounced.
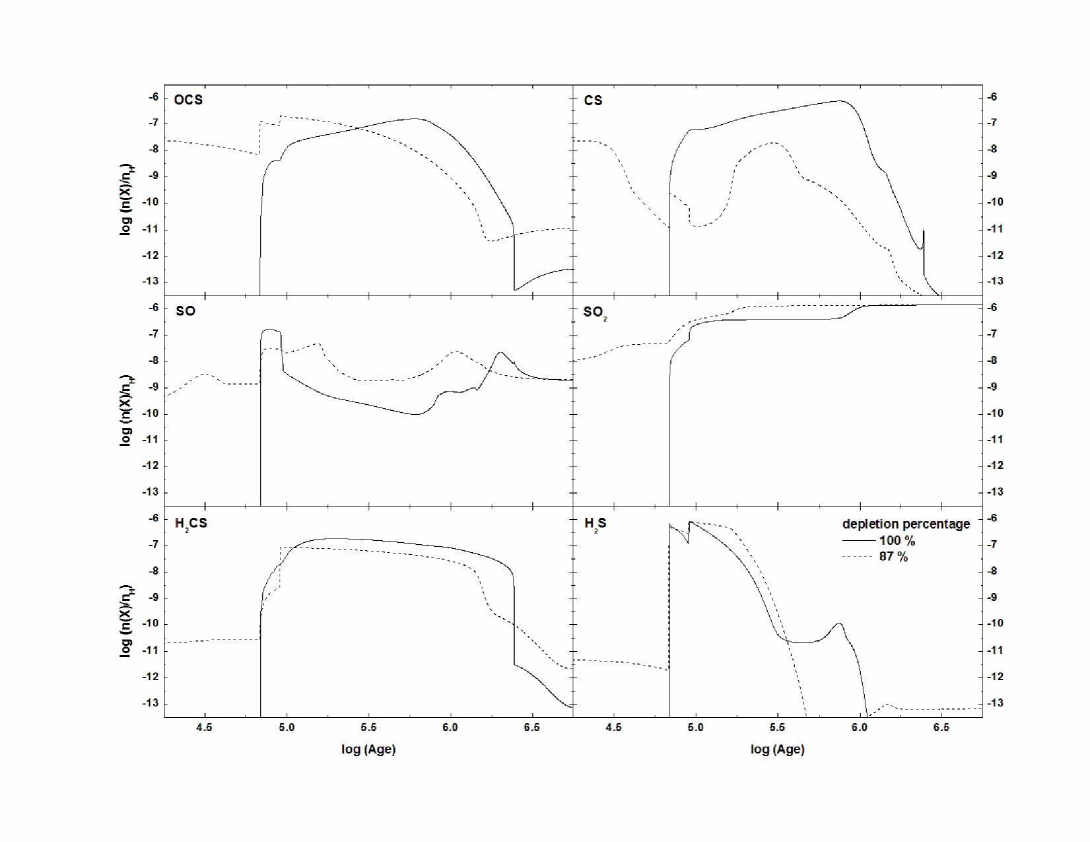
In Figures 4 and 5 we show models with depletion efficiencies of 100% and 85% respectively. Lowering the depletion efficiency reduces the yield of most species. However, some species (Fig. 4; e.g. SO, SO2) show higher abundances at lower depletion efficiencies: this is due to the higher abundance of atomic sulphur in the gas phase during Phase I which leads to an appreciable amount of SO and SO2 even before the warm core forms. In general, models where all heavy elements are frozen out give abundances that are more in line with the observed abundances (see Table 2 and Section 3.2). We have also run a model where sulphur does not hydrogenate as it freezes but remains in atomic form (Wakelam et al., 2004) and, as expected, we find that this affects the early stages of Phase II by lowering the abundance of H2S by a factor of 30; however, by 105 yrs the bulk of the sulphur is locked in CS, SO and SO2, regardless of its initial form.
From our results so far it is clear that, as in the case of hot cores, sulphur-bearing species show the most variation, whether with time, radius, density or depletion. Ratios of sulphur-bearing molecules may therefore be used as tracers of the physical characteristics of warm cores. The SO/CS, SO/H2CS, and SO/OCS ratios are less than 1 at early times ( yrs), while those of H2S/SO2 and H2S/H2CS are higher than 2 at later times ( yrs). The slowing down of the temperature increase allows more species to survive in the gas-phase, and hence show higher abundances at late times. This result is in line with the prediction of both Hatchell et al. (1998) and Viti et al. (2004) for the change of the abundances of sulphur-bearing species. The key difference between low and high mass cores is the abundance of H2S as a function of time: this species decreases much more drastically with time for low-mass cores. Note that H2S drives the sulphur bearing chemistry (see Hatchell et al. 1998; Viti et al. 2004). These ratios may therefore, in principle, be used as evolutionary indicators for warm cores, although, as Wakelam et al. (2004) point out, care needs to be taken because sulphur-bearing ratios at early times strongly depend on the nature of sulphur in the icy mantles.
3.2 Comparison with hot core chemical models
The main aim of this study was to determine whether the predicted chemistry of warm cores differs substantially from that of hot cores and in particular whether we can identify molecules that would be enhanced in warm cores but not in hot cores. Viti et al. (2004) ran chemical models of hot cores for different stellar masses. In this work we compare our results for a one solar mass warm core with those of Viti et al. (2004) for hot cores. Typical hot cores (as modelled by Viti et al. 2004) have temperatures of 300 K, sizes of about 0.03 pc, and densities of the order of 107 cm-3; in this paper we concentrate on the inner part of a typical warm core (or ‘hot corino’) and thus employ much smaller sizes, higher densities and lower temperatures (see Table 1). These differences in initial conditions lead to two main differences in the chemistry: firstly we find that in general hot cores possess higher fractional abundances, at late times ( yrs), while those abundances are higher in warm cores at early stages. This is most likely due to the higher densities in warn cores (leading to a richer chemistry both in both phases) and the different evaporation times (leading to different species being present in the gas phase at different times). Secondly, the evolutionary profiles of the species show almost the same trends shifted toward later times for hot cores. The observed jump in the abundances of species (such as H2CO) in warm cores (e.g. Ceccarelli et al. 1996, 2000a, 2000b) is not observed for the hot core case, which may indicate that these jumps are essential features in the warm core evolutionary profiles for those species. COMs show high abundances comparable to those found in hot cores, in particular for CH3OH, CH3CN and C2H5OH. From the above discussion we conclude that the set of species used as evolutionary indicators for hot cores may be used for the same purpose in warm cores.
3.3 Comparisons with observations of low-mass cores
While we do not attempt here to model any particular observed warm core, the physical parameters of one of our models with density of 2.0 108 cm-3 seem to be consistent with those observed toward the well-studied warm core around the solar type Class 0 source IRAS 16392-2422 (e.g Ceccarelli et al. 1999; Ceccarelli 2004, 2007). These authors find that at a radius of AU and density cm-3, the dust temperature is K. Hence we may qualitatively compare our results to the observations of this core. Ceccarelli et al. (2000a, b) recorded sudden (spatially abrupt) increases in the abundances of a few observed species such as H2O, SiO, and H2CO. Schöier et al. (2002) found that in order to reproduce the physical properties of the dust and gas components constituting the material in the circumstellar envelope of IRAS 16293-2422 a jump in the abundance of H2CO and other species was indeed needed. Both of these papers proposed that these jumps, recorded around 80-90 K, result from the evaporation of mantle species in the hot-core like region around the protostar. Our model with density of 2.0 108 cm-3 does indeed reproduce the jumps in the profiles of H2CO and CH3OH, around 84 K, confirming their findings.
A tentative comparison between our model calculations averaged through the core and observational fractional abundances in IRAS 16293-2442 is shown in Table 2, at time around 8.5 104 yrs, when the dust temperature reaches K. Because our model calculations are for a core of radius 150 AU, we compare our results with the observations of the inner core by Schöier et al. (2002), apart from the measurement of CH3CN that was taken from Bisschop et al. (2008).
| Species | This work | Observations |
|---|---|---|
| OCS | ||
| SO | ||
| SO2 | ||
| H2CO | ||
| CH3OH | ||
| CH3CN |
Sulphur-bearing species are, on average, in good agreement with observations during the early evolutionary stages ( yrs) and hence they are good tracers for young cores with temperatures K. On the other hand, we find that large complex molecules show good agreement with observations at later times ( yrs) where the temperature exceeds 100 K. This result supports the view of grain mantles as factories of complex species and it underlines the importance of an accurate desorption treatment in the chemical modelling to provide abrupt changes in molecular abundances.
4 Conclusions
We report here results from a chemical model of a warm core (or hot corino) around a low-mass star. The core contains a protostellar object of solar mass whose radiation warms its inner part. This leads to sublimation of icy mantles deposited during the preceding collapse phase. We have introduced a detailed model of sublimation based on extensive laboratory results of Collings et al. (2004). These experiments imply that sublimation from mixed ices during the warming process occurs in several well-defined temperature bands. We have computed the positions of these bands for the solar-mass model and follow the resulting chemistry in a time- and space-dependent manner.
Although we have not attempted to model any specific astronomical source, the physical parameters we have used are sufficiently similar to those inferred from observations of a well-studied object, IRAS 16293-2422, for us to compare the model results with observations. The predicted and inferred molecular abundances agree reasonably well.
The model that we have used is essentially a hot core model in which several physical parameters have been adjusted to be appropriate to warming by a solar-mass protostar. The generally satisfactory behaviour of the model results suggests that the chemical processes for both warm cores in low-mass star forming regions and hot cores in high mass star forming regions are similar.
Observations of warm cores show the existence at particular values of AV of very substantial ‘jumps’ in abundance (by several orders of magnitude) in certain molecular abundances. We find that these jumps arise as a consequence of sublimation and subsequent rapid gas-phase chemistry. Such jumps do not occur in models that describe sublimation as an instantaneous process, rather than the staged process we have introduced.
We predict that ratios of certain sulphur species should be excellent tracers of physical conditions in warm cores, regardless of the (unknown) total sulphur abundance.
5 Acknowledgements
Z. Awad would like to thank both the ORS and the Perren studentship schemes for funding. The authors thank the referee for helpful comments on the original version of this paper.
References
- André et al. (1993) André P., Ward-Thompson D., Barsony M., 1993, ApJ, 406, 122
- Bergin & Tafalla (2007) Bergin E. A., Tafalla M., 2007, Annu. Rev. A&A, 45, 339
- Bisschop et al. (2008) Bisschop S. E., Jørgensen J. K., Bourke T. L., Bottinelli S., van Dishoeck E. F., 2008, A&A, 488, 959
- Bottinelli et al. (2004) Bottinelli S., Ceccarelli C., Neri R., Williams J. P., Caux E., Cazaux S., Lefloch B., Maret S., Tielens A. G. G. M., 2004, ApJ Letter, 617, L69
- Caux et al. (2005) Caux E., Parise B., Castets A., Ceccarelli C., Tielens A., 2005, in Lidman C., Alloin D., eds, The Cool Universe: Observing Cosmic Dawn Vol. 344 of Astronomical Society of the Pacific Conference Series, The HDO Abundance in the Solar-Type Protostar IRAS 16293-2422. p. 206
- Cazaux et al. (2003) Cazaux S., Tielens A. G. G. M., Ceccarelli C., Castets A., Wakelam V., Caux E., Parise B., Teyssier D., 2003, ApJ Letter, 593, L51
- Ceccarelli (2004) Ceccarelli C., 2004, in Johnstone D., Adams F. C., Lin D. N. C., Neufeeld D. A., Ostriker E. C., eds, Star Formation in the Interstellar Medium: In Honor of David Hollenbach Vol. 323 of Astronomical Society of the Pacific Conference Series, The Hot Corinos of Solar Type Protostars. p. 195
- Ceccarelli (2005) Ceccarelli C., 2005, in Lis D. C., Blake G. A., Herbst E., eds, Astrochemistry: Recent Successes and Current Challenges Vol. 231 of IAU Symposium, Observations of Low-Mass Protostars: Cold Envelopes and Hot Corinos. pp 1–16
- Ceccarelli (2007) Ceccarelli C., 2007, in Molecules in Space and Laboratory Molecular complexity in solar type protostars: the Hot Corinos
- Ceccarelli et al. (2000a) Ceccarelli C., Castets A., Caux E., Hollenbach D., Loinard L., Molinari S., Tielens A. G. G. M., 2000a, A&A, 355, 1129
- Ceccarelli et al. (1998a) Ceccarelli C., Castets A., Loinard L., Caux E., Tielens A. G. G. M., 1998a, A&A, 338, L43
- Ceccarelli et al. (1999) Ceccarelli C., Caux E., Loinard L., Castets A., Tielens A. G. G. M., Molinari S., Liseau R., Saraceno P., Smith H., White G., 1999, A&A, 342, L21
- Ceccarelli et al. (1996) Ceccarelli C., Hollenbach D. J., Tielens A. G. G. M., 1996, ApJ, 471, 400
- Ceccarelli et al. (2000b) Ceccarelli C., Loinard L., Castets A., Tielens A. G. G. M., Caux E., 2000b, A&A, 357, L9
- Collings et al. (2004) Collings M. P., Anderson M. A., Chen R., Dever J. W., Viti S., Williams D. A., McCoustra M. R. S., 2004, MNRAS, 354, 1133
- Collings et al. (2003b) Collings M. P., Dever J. W., Fraser H. J., McCoustra M. R. S., 2003b, Ap&SS 285, 633
- Collings et al. (2003a) Collings M. P., Dever J. W., Fraser H. J., McCoustra M. R. S., Williams D. A., 2003a, ApJ, 583, 1058
- Garrod et al. (2008) Garrod R. T., Weaver S. L. W., Herbst E., 2008, ApJ, 682, 283
- Geppert et al. (2006) Geppert W. D., Hamberg M., Thomas R. D., Österdahl F., Hellberg F., Zhaunerchyk V., Ehlerding A., Millar T. J., Roberts H., Semaniak J., Ugglas M. A., Källberg A., Simonsson A., Kaminska M., Larsson M., 2006, Chemical Evolution of the Universe, Faraday Discussions, volume 133, 2006, p.177, 133, 177
- Hatchell et al. (1998) Hatchell J., Thompson M. A., Millar T. J., MacDonald G. H., 1998, A&A, 338, 713
- Herbst & van Dishoeck (2009) Herbst E., van Dishoeck E. F., 2009, Annu. Rev. A&A, 47, 427
- Hollis et al. (2004) Hollis J. M., Jewell P. R., Lovas F. J., Remijan A., 2004, ApJ Letter, 613, L45
- Le Teuff et al. (2000) Le Teuff Y. H., Millar T. J., Markwick A. J., 2000, A&A Suppl. Series, 146, 157
- Lepp (1992) Lepp S., 1992, in Singh P. D., ed., Astrochemistry of Cosmic Phenomena Vol. 150 of IAU Symposium, The Cosmic-Ray Ionization RATE*. p. 471
- Maret et al. (2004) Maret S., Ceccarelli C., Caux E., Tielens A. G. G. M., Jørgensen J. K., van Dishoeck E., Bacmann A., Castets A., Lefloch B., Loinard L., Parise B., Schöier F. L., 2004, A&A, 416, 577
- Molinari et al. (2000) Molinari S., Brand J., Cesaroni R., Palla F., 2000, A&A, 355, 617
- Nomura & Millar (2004) Nomura H., Millar T. J., 2004, A&A, 414, 409
- Rawlings et al. (1992) Rawlings J. M. C., Hartquist T. W., Menten K. M., Williams D. A., 1992, MNRAS, 255, 471
- Sakai et al. (2008) Sakai N., Sakai T., Hirota T., Yamamoto S., 2008, ApJ, 672, 371
- Schöier et al. (2002) Schöier F. L., Jørgensen J. K., van Dishoeck E. F., Blake G. A., 2002, A&A, 390, 1001
- Shu (1977) Shu F. H., 1977, ApJ, 214, 488
- Tielens & Hagen (1982) Tielens A. G. G. M., Hagen W., 1982, A&A, 114, 245
- van Dishoeck (2004) van Dishoeck E. F., 2004, Annu. Rev. A&A, 42, 119
- Viti et al. (2004) Viti S., Collings M. P., Dever J. W., McCoustra M. R. S., Williams D. A., 2004, MNRAS, 354, 1141
- Wakelam et al. (2004) Wakelam V., Caselli P., Ceccarelli C., Herbst E., Castets A., 2004, A&A, 422, 159
- Watanabe et al. (2003) Watanabe N., Shiraki T., Kouchi A., 2003, ApJ Letter, 588, L121