Type I X-ray bursts and burst oscillations in the accreting millisecond X-ray pulsar IGR J17511–3057
Abstract
We report the discovery of burst oscillations at the spin frequency in ten thermonuclear bursts from the accreting millisecond X-ray pulsar (AMXP) IGR J17511–3057. The burst oscillation properties are, like those from the persistent AMXPs SAX J1808.4–3658 and XTE J1814–338, anomalous compared to burst oscillations from intermittent pulsars or non-pulsing LMXBs. Like SAX J1808.4–3658 they show frequency drifts in the rising phase rather than the tail. There is also evidence for harmonic content. Where IGR J17511–3057 is unusual compared to the other two persistent pulsars is that oscillations are not detected throughout all bursts. As accretion rate drops the bursts get brighter and their rise/decay time scales become shorter, while the oscillation amplitude falls below the detection threshold: first in the burst peak and then also in the rise. None of the bursts from IGR J17511–3057 show evidence for photospheric radius expansion (which might be expected to suppress oscillation amplitude) which allow us to set an upper limit to the distance of 6.9 kpc. We discuss the implications of our results for models of the burst oscillation mechanism.
keywords:
Keywords: accretion, accretion disks — binaries: close — stars: individual (IGR J17511–3057) — stars: neutron, pulsars — X–rays: stars1 Introduction
It is thought that many low-mass X-ray binaries (LMXBs) contain rapidly rotating neutron stars. However measuring the neutron star spin has been a challenge for more than 30 years. So far we have been able to measure the spin of only 25 out of more than 150 LMXBs (see, e.g., Liu et al., 2007, for a catalog) thanks to episodes of X-ray pulsations at the neutron star spin frequency. These episodes can last for periods as short as a few seconds or as long as days to weeks.
When pulsations occur in the persistent X-ray emission, the sources are known as accreting millisecond X-ray pulsars (AMXPs). Today there are 13 of these systems (see Altamirano et al., 2010a; Markwardt & Strohmayer, 2010, for the latest discovery) and their pulsations are thought to be powered by accretion, in a scenario in which matter from the accretion disk is channeled by the magnetic field lines onto the magnetic pole, forming a hot spot visible in X-rays.
When pulsations occur during surface thermonuclear explosions (known as Type I X-ray bursts, see, e.g Strohmayer & Bildsten, 2006, for a review), the sources are known as nuclear-powered X-ray pulsars (NPXPs) or burst oscillation sources. Prior to the discovery of IGR J17511–3057 there were 14 confirmed NPXPs (including the four which are also AMXPs, and excluding those which require confirmation, see Watts et al., 2008a; Altamirano et al., 2010b; Galloway et al., 2010), of which two are persistent AMXPs and two are intermittent AMXPs (see below). For clarity, in the rest of this work we will refer to the accretion-powered pulsations as “pulsations” and to the nuclear-powered pulsations as “burst oscillations”.
Burst oscillations presumably develop when the burning or its aftermath becomes in some way asymmetric. However the exact mechanism that generates burst oscillations is not yet known, and they are not observed in every burst even in sources that do show them. All theoretical models proposed to date fail to explain certain aspects of the data, and it seems increasingly likely that the magnetic field in the surface layers (largely neglected by current models) may play an important role.
In this regard systems that are both AMXPs and NPXPs are particularly useful. The magnetic field in these sources is obviously dynamically important, since it channels accretion flow onto the stellar surface. This allows us to gauge field strength and any effect that channeling may have in establishing either temperature or fuel distribution gradients in the surface layers (Strohmayer & Bildsten, 2006; Watts et al., 2008b; Watts, 2008; Lamb et al., 2009).
Prior to the discovery of IGR J17511–3057, there were only four systems that were both AMXPs and NPXPs. If one compares the duty cycle of their pulsations, these systems can be divided into two separate groups. The first group contains the AMXPs SAX J1808.4–3658 (Wijnands & van der Klis, 1998) and XTE J1814–338 (Markwardt & Swank, 2003; Strohmayer et al., 2003); these systems show pulsations persistently during all their outbursts (see Hartman et al., 2009; Papitto et al., 2007, respectively). The second group contains the AMXPs HETE J1900.1–2455 (Kaaret et al., 2006) and Aql X-1 (Casella et al., 2008); pulsations from these sources were only detected intermittently. HETE J1900.1–2455 has been in outburst for almost 4.5 years, but showed pulsations only intermittently during the first few months of activity (Galloway et al., 2007, 2008a). The intermittent AMXP Aql X-1 is particularly extreme: pulsations were detected only for sec out of the Msec of available data (Casella et al., 2008).
These two groups of sources differ not only in their pulsation duty cycle, but also in the characteristics of their burst oscillations. The intermittent pulsars show burst oscillations with similar characteristics to those observed in all non-AMXPs (Zhang et al., 1998; Galloway et al., 2008b; Watts et al., 2009a). Burst oscillations are detected in only a subset of bursts. They show no harmonic content and are detected more often during decay than burst rise. Frequency drifts, which are common, are slow. Burst oscillation amplitudes tend to increase with energy. The persistent pulsars, by contrast, are both rather anomalous. They show burst oscillations in all bursts, throughout the whole burst (i.e. starting at the rise, continuing at the peak – except during photospheric-radius expansion peaks (PRE)– and during the decay). SAX J1808.4-3658 shows very large fast frequency drifts in the burst rise that overshoot the spin frequency (Chakrabarty et al., 2003), while XTE J1814-338 is remarkable for its frequency stability and phase-locking (Strohmayer et al., 2003; Watts et al., 2005, 2008b). XTE J1814-338 has burst oscillations whose amplitude rises with energy (Watts & Strohmayer, 2006), and the oscillations also have substantial harmonic content.
These differences support the idea that magnetic field plays an important part in determining burst oscillation properties, either directly or by generating composition/temperature/fuel depth gradients in the surface layers. Understanding how burst oscillation properties vary between and within the groups of persistent AMXPs, intermittent AMXPs and non-AMXPs is the first step to shedding light onto the mechanism (or mechanisms) that produce brightness asymmetries during X-ray bursts. In this paper we report the discovery of burst oscillations from the persistent AMXP IGR J17511–3057. We present a detailed analysis of the burst oscillation properties and discuss how they fit into the existing population.
1.1 IGR J17511–3057
IGR J17511–3057 was first unambiguously identified by the INTEGRAL gamma ray mission on September 12th, 2009 (Baldovin et al., 2009). However, the source was initially detected one day before by RXTE PCA Bulge scans as a rising flux attributed to two known sources in the same 1∘ field of view: XTE J1751–305 and GRS 1747–312 (the former is a known Hz AMXP, see Markwardt et al., 2002). The first PCA pointed observation was performed on September 12th, and revealed coherent pulsations at 245 Hz (Markwardt et al., 2009a). Quasi-simultaneously with the PCA observation, Swift observed in the direction of the AMXP XTE J1751–305 and did not detect any source at its known Chandra position, or any other position in the 22 arcmin diameter FoV (Markwardt et al., 2009a). All these observations together confirmed that the source in outburst was not the known AMXP XTE J1751–305 but a new one. A preliminary orbital solution yielded a pulse frequency of 244.8337(1) Hz, an orbital period of 207.4(8) minutes, and a projected semi-major axis of 274(1) lt-ms. The mass function was 0.00107(2) , giving a minimum companion mass of .
Swift observations at the beginning of the outburst detected thermonuclear (Type I) X-ray bursts (Bozzo et al., 2009). RXTE follow-up observations led to the detection of burst oscillations during these thermonuclear bursts (Watts et al., 2009b). Chandra-HETG observations were performed on September 22nd (Nowak et al., 2009), leading to a refined position (, ). Using the new coordinates, Riggio et al. (2009) and Papitto et al. (2009) reported an improved orbital ephemeris (using RXTE and XMM-Newton data, respectively). Very recently, Papitto et al. (2010) presented a detailed analysis of the X-ray spectra of IGR J17511–3057 using 70 ksec of XMM-Newton data. Near infrared follow-up observations identified the counterpart at a magnitude of K (Torres et al., 2009a, b). Very recently, Bozzo et al. (2010) reported on the Swift monitoring observations during the outburst.
2 OBSERVATIONS AND DATA ANALYSIS
2.1 Light curves and color diagrams
We use data from the Rossi X-ray Timing Explorer (RXTE) Proportional Counter Array (PCA; for instrument information see Zhang et al., 1993; Jahoda et al., 2006). There were 85 pointed observations (ObsIDs: 94041-01 and 94042-01) containing to ksec of useful data per observation. We use the 16-s time-resolution Standard 2 mode data to calculate X-ray colors. Hard and soft color are defined as the 9.7–16.0 keV / 6.0–9.7 keV and 3.5–6.0 keV / 2.0–3.5 keV count rate ratio, respectively, and intensity as the 2.0–16.0 keV count rate. Type I X-ray bursts were removed, background was subtracted and deadtime corrections were made. Colors and intensities were normalized by those of the Crab Nebula (see Kuulkers et al., 1994; van Straaten et al., 2003, and Table 2 in Altamirano et al. 2008 for average colors of the Crab Nebula per PCU).
2.2 Energy spectra of the persistent emission
For the PCA, we used the Standard 2 data of PCU 2, which was active in all observations. The background was estimated using the PCABACKEST V6.0 (see FTOOLS). We calculated the PCU 2 response matrix for each observation using the FTOOLS routine PCARSP V10.1. For the HEXTE instrument, spectra were accumulated for cluster B (as cluster A stopped rocking in October 2006), excluding the damaged detector and averaging both rocking directions to measure the background spectrum. Dead time corrections of both source and background spectra were performed using HXTDEAD V6.0. The response matrices were created using HXTRSP V3.1. For both PCA and HEXTE, we filtered out data recorded during, and up to 30 minutes after passage through the South Atlantic Anomaly (SAA). We only used data when the pointing offset from the source was less than 0.02 degrees and the elevation of the source with respect to the Earth was greater than 10 degrees. Using XSPEC V11.3.2i (Arnaud, 1996), we fitted simultaneously the PCA and HEXTE energy spectra using the 3.0–25.0 keV and 20.0–200.0 keV energy bands, respectively. We used a model consisting of a disk blackbody and a power law, absorbed with an equivalent Hydrogen column density of 1.11022 cm-2 (Papitto et al., 2009, 2010).
2.3 Type I X-ray bursts
We searched the Swift X-ray telescope (XRT) and the burst alert telescope (BAT) data for the occurrence of X-ray bursts. We found a total of 3 bursts. Spectral analysis of these bursts have been reported by Bozzo et al. (2010). We refer to Bozzo et al. (2010) for more information on the Swift data. Here we only report on the search for burst oscillations.
We searched the Standard 1 mode PCA data (2–60 keV, 0.125 seconds time resolution, no energy resolution) of all observations and found 10 Type I X-ray bursts (see Table 1). In the following sections we describe the spectral and timing procedures separately.
2.3.1 Time resolved spectroscopy of bursts detected with PCA
We created energy spectra every 0.125 and 0.250 sec from the Event mode (E_125us_64M_0_1s) data of all the PCUs that were on during the burst. Given the high count rates during the peak of the bursts, we corrected each energy spectrum for dead-time using the methods suggested by the RXTE team111http://heasarc.gsfc.nasa.gov/docs/xte/recipes/pca_deadtime.html. For each energy spectrum, we created the corresponding response matrix using the latest information available on the response of the instrument at the relevant times. As is common practice, we used as background the energy spectrum of the persistent emission taken seconds before each burst222We used 100 sec of the persistent emission to calculate the spectrum. However, we found no significant differences in the fits when the persistent-emission before or after the burst was used, or when using data-segments of different lengths -between 100 and 500 seconds.. We used a black-body model to fit the resulting burst spectra; this choice allows us to compare our results with previous work on burst spectra in other sources. With the procedure described above we are assuming that the X-ray spectra, after the persistent emission has been subtracted, are Planckian and that the observed luminosity of the source is:
so the unabsorbed bolometric X-ray flux is determined using
where , T, R and D are the Stefan-Boltzmann constant, the black-body temperature, the neutron star photosphere radius, and the distance to the source, respectively. The ratio is the normalization of the black-body model (bbodyrad – see XSPEC manual for details). We note that from the () statistical point of view, the spectra of X-ray bursts are generally well described by black-body emission. However, the emission from the neutron star and its environment (e.g., accretion disk) is expected to be more complex than simple black-body emission (see, e.g., van Paradijs, 1982; London et al., 1984; Kuulkers et al., 2003, and references therein) and T is a color temperature.
2.3.2 Burst oscillations
Burst oscillation analysis was conducted using 125 s time resolution PCA event mode data, barycentered using the refined position (, , see Nowak et al., 2009). We looked for data overruns which sometimes occur during bright bursts, but found none. We then extracted data in the 2-25 keV range where the bursts are dominant.
Burst oscillation fractional rms amplitudes were computed using the procedure outlined in Section 2.1 of Watts et al. (2005). We measure the Z2 statistic, an unbinned version of the standard power spectrum. From this the best estimate of the pure source-only signal power in the absence of measurement noise, , is taken to be that for which the cumulative probability of obtaining the measured power , . Errors on are given by the points where is 0.159 and 0.841 (equivalent to for a normal distribution). The fractional rms amplitude is then given by
| (1) |
where is the total number of photons, and is the number of background photons.
We first computed burst average fractional rms amplitude, assuming a constant frequency, for the entirety of each burst. To reduce the contribution from the accretion-powered pulsations (which will contribute to the pulsed fraction if accretion continues unaffected during the burst), we used data from the period where the burst flux exceeds twice the pre-burst level. If the accretion flow and the fractional rms amplitude of the persistent pulsations remain unchanged during the burst, then the magnitude of the correction is given by
| (2) |
where and are the number of source photons from the burst and accretion processes respectively, with and being the fractional rms amplitudes of the two different processes. The total number of source photons is .
The average fractional rms amplitude for each burst, computed in this way, is given in Table 1. We find significant drifts in the frequency of the burst oscillations during many of the bursts: the amplitude that we report is for the constant frequency where the statistic is maximized. Fitting the frequency drifts would slightly increase the measured amplitude. Burst average fractional rms amplitudes for the first harmonic were also computed.
To monitor the variation in frequency and amplitude over the course of each burst, we computed dynamical power spectra using overlapping 4s windows, to detect any frequency drifts. We also calculated fractional rms amplitudes for overlapping segments of 5000 photons (to ensure comparable statistics throughout the bursts). This is the same procedure as that adopted in Watts et al. (2005). Amplitudes are only calculated for bins where the measured power exceeds 14 (equivalent to a 3 single trial detection).
3 RXTE Results
3.1 The outburst evolution and the occurrence of X-ray bursts
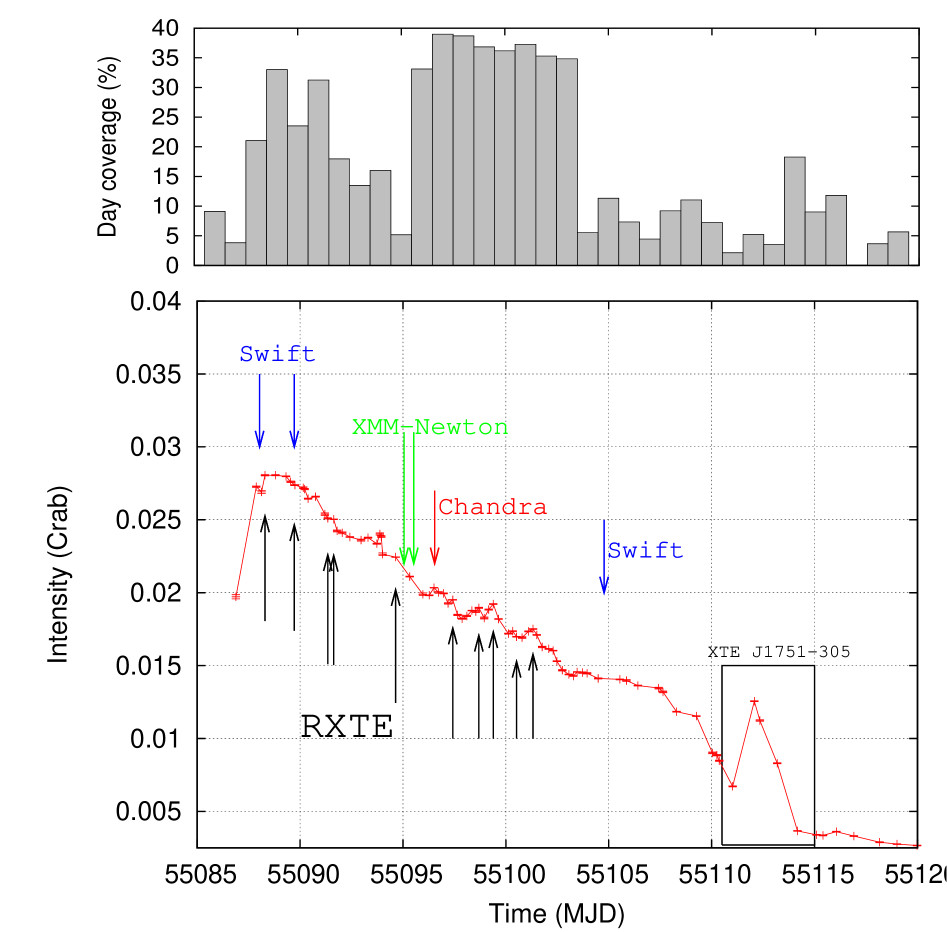
Figure 1 shows the 2–16 keV light curve of IGR J17511–3057. The outburst was detected on September 12th, 2009 (MJD 55086) by INTEGRAL and by RXTE. On this day IGR J17511–3057 was already about 20 mCrab; its intensity increased for about 2 more days, reaching a peak luminosity of mCrab (corresponding to a 4.5% (d/6.9)2 Eddington luminosity as estimated from spectral fits in the 2–200 keV range). After that, the intensity decreased almost linearly until MJD , when the intensity appears to decrease faster in time. The weakening of the source was interrupted by an apparent flare which started on MJD and lasted for about 3 days. This flare-like increase of intensity was not from IGR J17511–3057, but due to the nearby AMXP XTE J1751-304 (Markwardt et al., 2009b) in the PCA field of view.
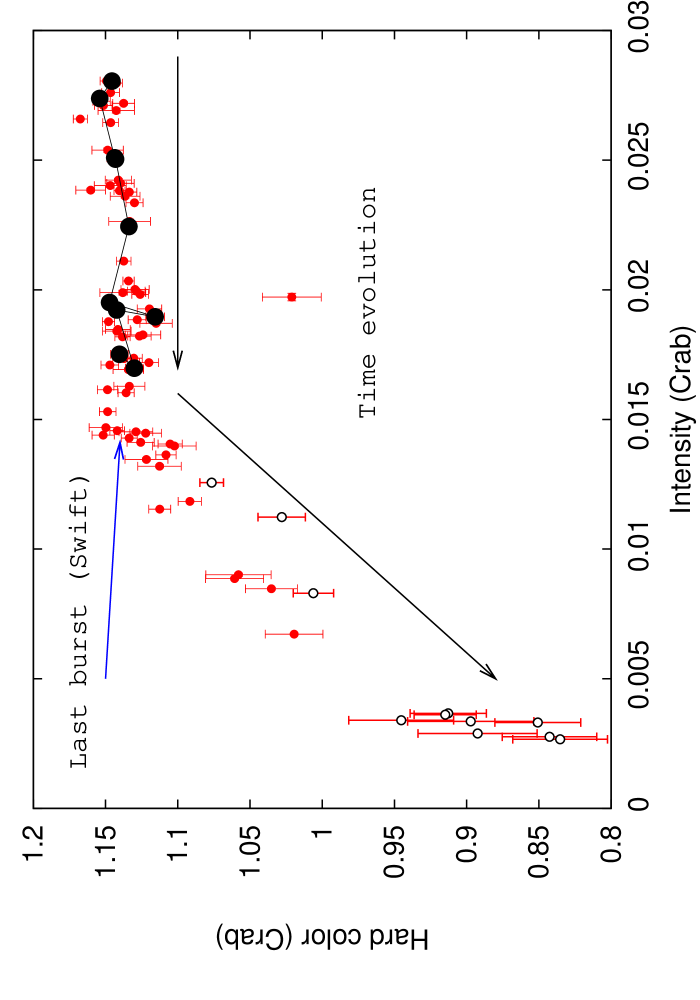
In Figure 1 we mark the episodes of X-ray bursts as detected by RXTE (10 bursts), Swift (3 bursts, see Bozzo et al., 2010), Chandra (1 burst, see Nowak et al., 2009) and XMM-Newton (2 bursts, see Papitto et al., 2009, 2010). After MJD no other bursts were detected by any satellite, suggesting a drop in burst rate. However, note that this drop in burst rate also coincides with the moment when the PCA sampling decreased significantly (see upper panel of Figure 1). In Figure 2 we plot the hardness–intensity diagram using all PCA available data of IGR J17511–3057. At the beginning of the outburst decay, the hard color remains constant as the intensity decreases. A break occurs when the intensity reaches mCrab; the hard color then starts to decrease approximately linearly with intensity.
3.2 X-ray burst spectral characteristics
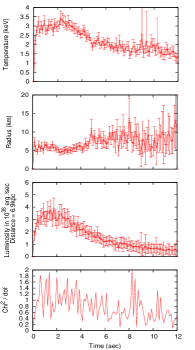
We found 10 Type I X-ray bursts in the PCA data; all of them were well fitted with a black-body model (with average /dof between 0.8 and 1.2 during the first 5-10 seconds of the burst). All bursts showed similar temperature, radius and bolometric flux profiles (see Table 1). The temperature and flux profiles were all single peaked, with no evidence for precursors. All bursts reached their maxima within 1.2 seconds. The rise times (from 25% to 90% of peak flux, as defined in Galloway et al., 2008b) of all bursts were between 0.6 to 1.2 sec. The maximum blackbody temperature (kT) was always between 2.5 and 3.5 keV and peak bolometric fluxes were in the erg s-1 cm-2 range. In all cases, the black-body radius remained approximately constant for the first seconds of the burst, then increased until reaching an average value of km (assuming a distance of 6.9 kpc). All bursts were also similar as far as decay shape. Unlike other cases where double-exponential or power law decays are favored, a simple exponential gives a statistically good fit in most cases. Decay times were in the range 5-8s. The total energy of each burst was always in the range d erg. The burst timescales , defined as the ratio between / , were all in the range 5.5-9s. In Figure 3 we show the temperature, radius and luminosity profiles for the brightest burst in our sample (i.e., Burst 9, see Table 1).
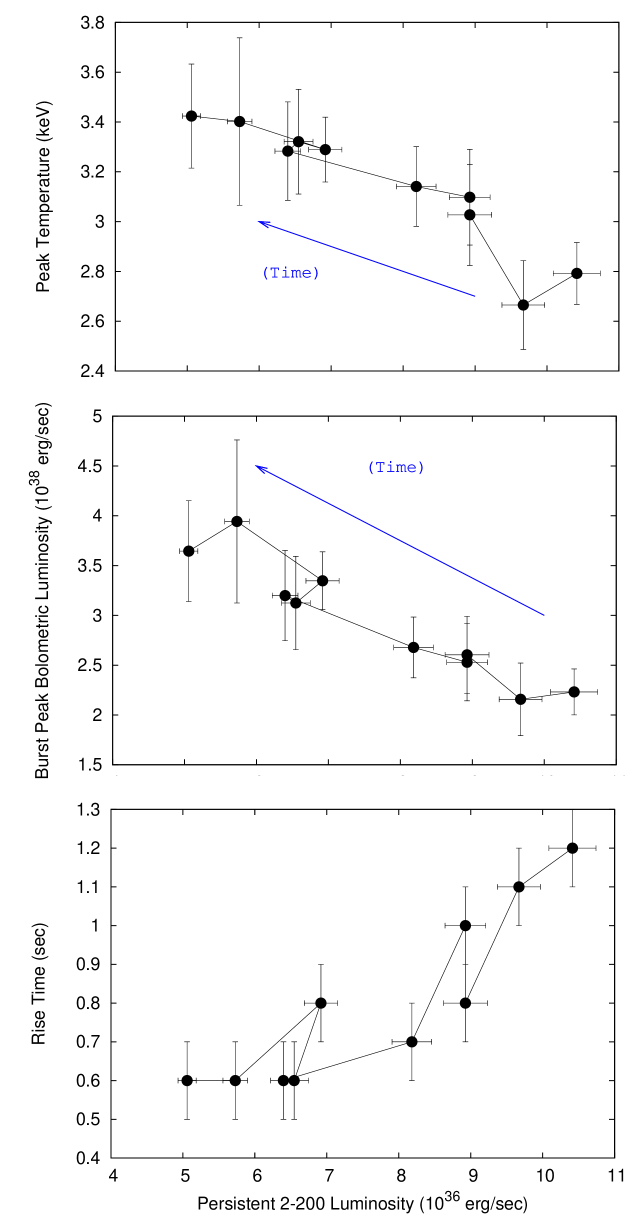
In Figure 4 we show the black-body temperature (upper panel), the bolometric luminosity at the peak of each burst (middle panel) and the burst rise time (lower panel) against the 2-200 keV luminosity of the source before the bursts, respectively. Both the temperature and the bolometric luminosity appear to anti-correlate with the persistent luminosity of the source; however, there is a clear correlation between the burst rise time and the persistent luminosity. To further investigate the significance of the anti-correlations, we calculated the Spearman rank correlation coefficients; we found coefficients of and for the temperature and the burst-peak luminosity, respectively (the two-sided significance of their deviations from zero equals and , respectively). We also studied the significance of the correlation between rise time and persistent luminosity and found Spearman rank correlation coefficient of , with a two-sided significance of its deviations from zero. Clearly, the apparent relations in Figure 4 are all significant.
3.3 Distance to IGR J17511–3057
None of the bursts showed indications of photospheric radius expansion. By using the highest measured bolometric peak flux of erg s-1 cm-2 we can estimate an upper limit on the distance. We find a distance kpc when using the empirically determined Eddington luminosity of erg s-1 (this is an average value estimated from PRE bursts from sources situated in globular clusters, see Kuulkers et al., 2003). This is consistent with the estimations from XMM-Newton data recently reported by Papitto et al. (2010). Using the same model as Galloway et al. (2008b)333The approximation was recently used by Galloway et al. (2008b) to compare a sample of more than a thousand X-ray burst from different sources. The distance is given by: where is the mass of the neutron star in solar masses, is the mass fraction of hydrogen in the neutron star atmosphere and z(R) is the term that takes into account the gravitational redshift at the photosphere (were , is the gravitational constant, the speed of light and the radius measured at the photosphere – see Galloway et al., 2008b). and standard values for the mass and the radius of the neutron star (i.e. and km), we found kpc and kpc for hydrogen mass fractions of and , respectively. Higher values of the radius and the mass give higher upper limits (at the very conservative case of , km and , we find kpc).
3.4 Burst oscillations
Burst oscillations are detected significantly in all bursts observed from this source, at a frequency very close to the known spin frequency. The properties of the burst oscillations in IGR J17511–3057 are summarized in Table 1. In Figure 5 we show the fractional rms amplitude (upper panels) and the dynamical power spectra for each burst (lower panels) as a function of time.
Burst oscillations are detected throughout the bursts only for the weaker bursts seen in the earlier part of the outburst. As the intensity (and probably accretion rate) drops and the bursts become brighter, and the characteristics of the burst oscillations change. Burst oscillation amplitude drops below the detectability threshold first in the peak of the bursts, and then also in the rise. The fractional rms amplitude of the burst oscillations, when detected, lies between 5 and 15%. Amplitude tends to be stronger in the tail than during the rise and peak. The burst-integrated fractional amplitude (see dotted horizontal line in the top panels of Figure 5) drops as the persistent luminosity decreases and the X-ray bursts become stronger. This drop can be attributed to the fact that the oscillations are no longer detected throughout the burst. Harmonic content is detected during some bursts (see Table 1); this is consistent with what has been found for the AMXP XTE J1814-338 (Strohmayer et al., 2003; Watts et al., 2005)
The burst oscillations show evidence for frequency drifts of Hz in the rise. The frequency tends to start below the spin frequency, reach a maximum in the peak and then stabilize very close to the spin frequency in the tail. In some cases the burst oscillation frequency in the tail appears to be higher than the spin frequency (see for example bursts 3, 9 and 10), however this is potentially within the error bars on our contours and also within possible errors on spin frequency due to the timing noise. A detailed analysis of the frequency drifts and the relation to the spin frequency (phase-locking), including any evidence for overshoot of the spin frequency (as observed for SAX J1808.4-3658, see Chakrabarty et al., 2003) will be presented in a companion paper (Patruno et al. in prep).


![[Uncaptioned image]](/html/1005.5299/assets/x11.png)
![[Uncaptioned image]](/html/1005.5299/assets/x12.png)
![[Uncaptioned image]](/html/1005.5299/assets/x13.png)
![[Uncaptioned image]](/html/1005.5299/assets/x14.png)
4 Swift XRT/BAT results
4.1 Upper limits on burst oscillations in the XRT data
Of the 3 Swift bursts (see, e.g., Bozzo et al., 2010), we examined bursts 1 and 2, which occurred at UTC times 2009-09-14T00:50:27 and 2009-09-15T17:17:19, respectively. Swift XRT Windowed Timing (WT) mode are available for those bursts, with a time stamp resolution of 1.766 ms (Nyquist-limited sampling frequency of 283.126 Hz). We found no BAT ”failed” triggers that coincide with these X-ray burst, i.e., only data from XRT instrument is available for these bursts. In the 1–7 keV band, the source peak count rate is 140 ct/s during both bursts, with a pre-burst background of 8.5 ct/s. We examined FFT power spectra with 2 s durations from T-10 s to T+50 s around the burst epochs listed above. No oscillations were detectable. At the pulse frequency, the 95% upper limit is 14% rms during the peak of the burst. The upper limit is less constraining in the tail of the burst, with typical values of 20–25%.
4.2 Upper limits on burst oscillations in the BAT data
We examined the Swift BAT data for the third burst, which was reported to occur at time 2009-09-30T18:31:57 (UTC, see Bozzo et al., 2010). We searched for oscillations in the BAT event data, which has a time stamp resolution of 100 s. In a light curve with 1 s bins, we found a significantly enhanced BAT count rate in the time range T-3 to T+6 compared to the reported burst time. Since BAT is typically a background-dominated instrument, we attempted to maximize the signal to background ratio in order to maximize sensitivity to oscillations. Automatic background subtraction using the BAT mask weighting technique reduces the effective area by about 44%. Instead, we used the raw events and use bracketing 5 s background intervals on both sides of the burst. We found that the energy range 12–18 keV maximizes the signal to background ratio for this burst. Below about 12 keV, the BAT energy calibration is less well known, and various effects like passive absorption and detector energy thresholds introduce further complications. Above 18 keV, there are still detectable burst counts, but the dominant background introduces more noise. Finally, we removed noisy detectors, disabled detectors, and detectors whose fractional area exposure to this source was less than 50%. Detectors with less fractional exposure contribute primarily background. After these cuts, the background rate was 1806 ct/s in 13096 detectors (out of 32768 possible detectors). We constructed a single FFT power spectrum in the 9 s window described above and detected no significant oscillations. We set a 95% upper limit to oscillations at the pulse frequency of 10.4% rms of the net burst emission. We also constructed individual 2 s power spectra to search for shorter term variability at the pulse frequency, but did not detect any.
5 Discussion
We have presented a detailed analysis of the ten X-ray bursts detected by RXTE from the recently discovered AMXP IGR J17511–3057. These bursts were recorded from the peak of the outburst onwards as accretion rate fell by a factor . The bursts become brighter and shorter as accretion rate falls. This behavior is consistent with the fraction of He in the bursts increasing as the accretion rate falls, as H has more time to burn to He via the hot CNO cycle prior to ignition (consistent with the 4% Eddington luminosity/accretion rate we observe. See, e.g., Bildsten, 1998, 2000).
Burst oscillations were detected in all of the bursts from IGR J17511–3057 recorded by RXTE. In this sense IGR J17511–3057 is like the other two persistent AMXPs and unlike both the intermittent AMXPs and the non-pulsars, where burst oscillations are detected in only a subset of bursts. This may be due to the fact that we observe the persistent AMXPs over a smaller range of accretion rates than the other sources; alternatively it may be associated with the persistent presence of a channeling magnetic field.
The burst oscillations from IGR J17511–3057 lie within Hz of the known spin frequency, confirming the already well-established link between burst oscillation frequency and spin frequency. The oscillations also exhibit frequency drifts. We observe rapid drift in the burst rise, starting below the spin rate and ending up very close to it. There is some suggestion of overshoot which will be explored more rigorously in a companion paper. The burst oscillation frequency stabilizes very close to the spin frequency early in the tail. This behavior is unusual compared to that seen in the intermittent and non-pulsars, where the drift is slower and often persists throughout the tail (see, e.g., Muno et al., 2002a; Watts et al., 2009a). The drifts seen in IGR J17511–3057 are similar to those seen in the AMXP SAX J1808.4–3658 (Chakrabarty et al., 2003); the highly stable burst oscillations seen in XTE J1814–338 remain unique (Strohmayer et al., 2003; Watts et al., 2008b).
Oscillations remain above the detectability threshold throughout the bursts for the weaker bursts. As the bursts get brighter, however, the oscillations fall below the detectability threshold - first in the peak, and eventually also in the rise. In many sources (including the AMXP SAX J1808–3658) the vanishing of oscillations in the peak is associated with the onset of PRE. PRE could in principle obscure or shear out any asymmetry (see, e.g. Cumming, 2005); alternatively convection during PRE bursts may suppress the oscillation mechanism (Cooper, 2008). However this is not the case for IGR J17511–3057, since none of the bursts show evidence for PRE. Another possibility is that there is strong frequency drift in the rise and peak: this would reduce the possibility of detection since our search assumes a constant frequency. To test this we searched for signals in shorter time windows than those used in Section 2.3.2, but found no evidence to support this hypothesis. Increased He fraction in the ignition column (as accretion rate falls so there is more time to burn H to He via the hot CNO cycle) may be important, but how this could affect the detectability or generation of oscillations in the rise and peak is not clear.
The disappearance of oscillations in the peak and rise of bursts without PRE is also seen in some non-pulsars (Galloway et al., 2008b) but this is the first time that it has been seen in bursts from a persistent AMXP444Strohmayer et al. (2003) found that oscillations disappeared in the peak of the brightest burst from XTE J1814–338 (which occurred at the lowest accretion rate). This burst showed some evidence for PRE, however the spectral evidence was not conclusive.. This may point to a common mechanism for suppressing the development of oscillations, other than PRE, that operates independently of magnetic field. However we note that PRE events lasting for less than 1-2 seconds would not have been detectable: this time interval is shorter than the periods of time ( a few seconds) for which oscillations are below the detectability threshold. To our knowledge there is no theoretical constraint on how short PRE events could be; the possibility that sec PRE events might suppress the burst oscillation mechanism for timescales of a few seconds cannot be excluded and should be studied in more detail.
Burst oscillation amplitude reaches a maximum of about 15% rms at the fundamental frequency. This is comparable to amplitudes seen in other sources (pulsars and non-pulsars). It is also similar to the amplitude of the accretion-powered pulsations from this source. In this respect IGR J17511–3057 behaves like the other persistent AMXPs with burst oscillations. Several of the burst oscillation trains from IGR J17511–3057 also show a detectable first harmonic. The only other source to show this consistently is the AMXP XTE J1814–338. Burst oscillations from the intermittent pulsars and the non-pulsars do not in general have detectable harmonic content (see, e.g., Muno et al. 2002b, although see also Bhattacharyya & Strohmayer 2005 which discusses the existence of harmonic content in the rising phase of bursts from the non-pulsar 4U 1636–536).
6 Conclusions
The burst oscillations of IGR J17511–3057 are, like those of the other two persistent AMXPs with burst oscillations, atypical compared to burst oscillations from the intermittent and non-pulsars. Particularly notable are the frequency drifts and the fact that several of the burst oscillation trains have detectable harmonic content. These differences between the AMXPs and the other sources suggest that the presence of a channeling magnetic field is important to the burst oscillation mechanism, either directly or by establishing composition or temperature gradients.
IGR J17511–3057 has however also broadened the spectrum of properties exhibited by AMXP burst oscillations. This AMXP is the first for which oscillation amplitudes drop below the detectability threshold in bright bursts, without the bursts exhibiting simultaneous PRE. This phenomenon is also seen in non-pulsars, and points to a mechanism for suppressing burst oscillations - other than PRE - that is less affected by the presence of a dynamically important magnetic field.
Acknowledgment: We thank M. Nowak for sharing the X-ray burst time of occurrence in their Chandra data, respectively. AP acknowledges support from the Netherlands Organization for Scientific Research (NWO) Veni Fellowship. ML acknowledges support from the Netherlands Organization for Scientific Research (NWO) Rubicon Fellowship.
References
- Altamirano et al. (2008) Altamirano D., van der Klis M., Méndez M., et al., 2008, \apj, 685, 436
- Altamirano et al. (2010a) Altamirano D., Cavecchi Y., Patruno A., et al., 2010a, ArXiv e-prints (1005.3527)
- Altamirano et al. (2010b) Altamirano D., Linares M., Patruno A., et al., 2010b, \mnras, 401, 223
- Arnaud (1996) Arnaud K.A., 1996, In: Jacoby G.H., Barnes J. (eds.) Astronomical Data Analysis Software and Systems V, vol. 101 of Astronomical Society of the Pacific Conference Series, 17–+
- Baldovin et al. (2009) Baldovin C., Kuulkers E., Ferrigno C., et al., 2009, The Astronomer’s Telegram, 2196, 1
- Bhattacharyya & Strohmayer (2005) Bhattacharyya S., Strohmayer T.E., 2005, \apjl, 634, L157
- Bildsten (1998) Bildsten L., 1998, In: Buccheri R., van Paradijs J., Alpar A. (eds.) NATO ASIC Proc. 515: The Many Faces of Neutron Stars., 419–+
- Bildsten (2000) Bildsten L., 2000, In: S. S. Holt & W. W. Zhang (ed.) American Institute of Physics Conference Series, vol. 522 of American Institute of Physics Conference Series, 359–369
- Bozzo et al. (2009) Bozzo E., Ferrigno C., Kuulkers E., et al., 2009, The Astronomer’s Telegram, 2198, 1
- Bozzo et al. (2010) Bozzo E., Ferrigno C., Falanga M., et al., 2010, \aap, 509, L3+
- Casella et al. (2008) Casella P., Altamirano D., Patruno A., Wijnands R., van der Klis M., 2008, \apjl, 674, L41
- Chakrabarty et al. (2003) Chakrabarty D., Morgan E.H., Muno M.P., et al., Jul. 2003, \nat, 424, 42
- Cooper (2008) Cooper R.L., 2008, \apj, 684, 525
- Cumming (2005) Cumming A., 2005, \apj, 630, 441
- Galloway et al. (2007) Galloway D.K., Morgan E.H., Krauss M.I., Kaaret P., Chakrabarty D., 2007, \apjl, 654, L73
- Galloway et al. (2008a) Galloway D.K., Morgan E.H., Chakrabarty D., 2008a, In: R. Wijnands, D. Altamirano, P. Soleri, N. Degenaar, N. Rea, P. Casella, A. Patruno, & M. Linares (ed.) American Institute of Physics Conference Series, vol. 1068 of American Institute of Physics Conference Series, 55–62
- Galloway et al. (2008b) Galloway D.K., Muno M.P., Hartman J.M., Psaltis D., Chakrabarty D., 2008b, \apjs, 179, 360
- Galloway et al. (2010) Galloway D.K., Lin J., Chakrabarty D., Hartman J.M., 2010, \apjl, 711, L148
- Hartman et al. (2009) Hartman J.M., Watts A.L., Chakrabarty D., 2009, \apj, 697, 2102
- Jahoda et al. (2006) Jahoda K., Markwardt C.B., Radeva Y., et al., 2006, \apjs, 163, 401
- Kaaret et al. (2006) Kaaret P., Morgan E.H., Vanderspek R., Tomsick J.A., 2006, \apj, 638, 963
- Kuulkers et al. (1994) Kuulkers E., van der Klis M., Oosterbroek T., et al., 1994, \aap, 289, 795
- Kuulkers et al. (2003) Kuulkers E., den Hartog P.R., in’t Zand J.J.M., et al., 2003, \aap, 399, 663
- Lamb et al. (2009) Lamb F.K., Boutloukos S., Van Wassenhove S., et al., 2009, \apj, 706, 417
- Liu et al. (2007) Liu Q.Z., van Paradijs J., van den Heuvel E.P.J., 2007, \aap, 469, 807
- London et al. (1984) London R.A., Howard W.M., Taam R.E., 1984, \apjl, 287, L27
- Markwardt & Strohmayer (2010) Markwardt C.B., Strohmayer T.E., Jul. 2010, \apjl, 717, L149
- Markwardt & Swank (2003) Markwardt C.B., Swank J.H., 2003, \iaucirc, 8144, 1
- Markwardt et al. (2002) Markwardt C.B., Swank J.H., Strohmayer T.E., i. Zand J.J.M., Marshall F.E., 2002, \apjl, 575, L21
- Markwardt et al. (2009a) Markwardt C.B., Altamirano D., Swank J.H., et al., 2009a, The Astronomer’s Telegram, 2197, 1
- Markwardt et al. (2009b) Markwardt C.B., Altamirano D., T.E. S., Swank J.H., 2009b, The Astronomer’s Telegram, 2237, 1
- Muno et al. (2002a) Muno M.P., Chakrabarty D., Galloway D.K., Psaltis D., 2002a, \apj, 580, 1048
- Muno et al. (2002b) Muno M.P., Özel F., Chakrabarty D., 2002b, \apj, 581, 550
- Nowak et al. (2009) Nowak M.A., Paizis A., Wilms J., et al., 2009, The Astronomer’s Telegram, 2215, 1
- Papitto et al. (2007) Papitto A., di Salvo T., Burderi L., et al., 2007, \mnras, 375, 971
- Papitto et al. (2009) Papitto A., Riggio A., Burderi L., et al., 2009, The Astronomer’s Telegram, 2220, 1
- Papitto et al. (2010) Papitto A., Riggio A., Burderi L., et al., 2010, ArXiv e-prints (1005.4827)
- Riggio et al. (2009) Riggio A., Papitto A., Burderi L., et al., 2009, The Astronomer’s Telegram, 2221, 1
- Strohmayer & Bildsten (2006) Strohmayer T., Bildsten L., 2006, Compact stellar X-ray sources, 113–156
- Strohmayer et al. (2003) Strohmayer T.E., Markwardt C.B., Swank J.H., in’t Zand J., 2003, \apjl, 596, L67
- Torres et al. (2009a) Torres M.A.P., Jonker P.G., Steeghs D., Simon J.D., Gutowski G., 2009a, The Astronomer’s Telegram, 2216, 1
- Torres et al. (2009b) Torres M.A.P., Jonker P.G., Steeghs D., et al., 2009b, The Astronomer’s Telegram, 2233, 1
- van Paradijs (1982) van Paradijs J., 1982, \aap, 107, 51
- van Straaten et al. (2003) van Straaten S., van der Klis M., Méndez M., 2003, \apj, 596, 1155
- Watts (2008) Watts A.L., 2008, In: R. Wijnands, D. Altamirano, P. Soleri, N. Degenaar, N. Rea, P. Casella, A. Patruno, & M. Linares (ed.) American Institute of Physics Conference Series, vol. 1068 of American Institute of Physics Conference Series, 199–206
- Watts & Strohmayer (2006) Watts A.L., Strohmayer T.E., 2006, \mnras, 373, 769
- Watts et al. (2005) Watts A.L., Strohmayer T.E., Markwardt C.B., 2005, \apj, 634, 547
- Watts et al. (2008a) Watts A.L., Krishnan B., Bildsten L., Schutz B.F., 2008a, \mnras, 389, 839
- Watts et al. (2008b) Watts A.L., Patruno A., van der Klis M., 2008b, \apjl, 688, L37
- Watts et al. (2009a) Watts A.L., Altamirano D., Linares M., et al., 2009a, \apjl, 698, L174
- Watts et al. (2009b) Watts A.L., Altamirano D., Markwardt C.B., . T.E.S., 2009b, The Astronomer’s Telegram, 2199, 1
- Wijnands & van der Klis (1998) Wijnands R., van der Klis M., 1998, \nat, 394, 344
- Zhang et al. (1993) Zhang W., Giles A.B., Jahoda K., et al., 1993, In: Proc. SPIE Vol. 2006, p. 324-333, EUV, X-Ray, and Gamma-Ray Instrumentation for Astronomy IV, Oswald H. Siegmund; Ed., 324–333
- Zhang et al. (1998) Zhang W., Jahoda K., Kelley R.L., et al., 1998, \apjl, 495, L9+
| B1 | B2 | B3 | B4 | B5 | B6 | B7 | B8 | B9 | B10 | |
| ObsIDa | *-01-02 | *-01-06 | *-01-12 | *-01-07 | *-02-12 | *-02-200 | *-02-100 | *-03-00 | *-03-030 | *-03-04 |
| Num. of PCUs On | 2 | 1 | 1 | 1 | 3 | 1 | 1 | 4 | 1 | 2 |
| Start time | ||||||||||
| (MJD+55088.) | 0.32967163 | 1.72041237 | 2.27323586 | 2.61714558 | 6.61841723 | 9.60216584 | 10.77723818 | 11.31361260 | 12.63290021 | 13.28983887 |
| Rise time (s) | ||||||||||
| Decay timescale | ||||||||||
| (s) | ||||||||||
| Tau | ||||||||||
| ( s) | ||||||||||
| Peak count/rateb | ||||||||||
| Peak Luminosityc | ||||||||||
| ( erg s-1 (d/6.9kpc)2) | ||||||||||
| Total energy releasedc | ||||||||||
| ( erg) | ||||||||||
| Duration | ||||||||||
| (s) | ||||||||||
| Persistent | ||||||||||
| ( erg s-1 (d/6.9kpc)2) | ||||||||||
| Osc. rms amplitudee | ||||||||||
| (fundamental) | 10.8 0.4 | 11.2 0.6 | 8.7 0.6 | 9.6 0.6 | 7.6 0.3 | 5.5 | 6.8 0.6 | 6.7 0.3 | 5.2 | 5.5 0.4 |
| Osc. rms amplitudee | ||||||||||
| (1st harmonic) | 2.3 | 2.2 | 2.3 | |||||||
| g | 0.09 | 0.09 | 0.08 | 0.08 | 0.08 | 0.06 | 0.07 | 0.07 | 0.06 | 0.06 |