A New Calculation of Ne IX Line Diagnostics
Abstract
We describe the effect that new atomic calculations, including fully-relativistic R-matrix calculations of collisional excitation rates and level-specific dielectronic and radiative recombination rates, have on line ratios from the astrophysically significant ion Ne IX. The new excitation rates systematically change some predicted Ne IX line ratios by 25% at temperatures at or below the temperature of maximum emissivity ( K), while the new recombination rates lead to systematic changes at higher temperatures. The new line ratios are shown to agree with observations of Capella and CrB significantly better than older line ratios, showing that 25-30% accuracy in atomic rates is inadequate for high-resolution X-ray observations from existing spectrometers.
Subject headings:
atomic data, line: formation, X-rays: stars1. Introduction
X-ray spectral models for collisionally ionized plasmas have improved steadily over the past 30 years. As spectral lines dominate the emission from an X-ray emitting collisional plasma over a wide range of temperatures (Cox & Tucker, 1969), a relatively large number of lines must be included to create an accurate model. However, most early X-ray observations had limited spectral resolution, , and approximate calculations of individual transitions were generally adequate (Raymond & Smith, 1977; Mewe, 1972; Landini & Monsignori Fossi, 1972). As laboratory and observational methods have improved, more complete calculations have been produced (Smith et al., 2001; Kaastra, Mewe & Nieuwenhuijzen, 1996; Dere et al., 1997), although questions remain as to whether or not these are sufficiently accurate for astrophysical applications. With the launches of Chandra and XMM-Newton, individual emission lines from a wide range of elements are regularly resolved and used in diagnostics, especially from the grating instruments on these missions (Canizares et al., 2000; Brinkman et al., 2001). The strongest lines are from He-like and H-like ions and the Fe L-shell ions. Since both terrestrial and astrophysical plasmas are dominated over a broad temperature range by emission from the complex Fe L-shell ions, a collaboration of atomic physicists established the Iron Project (Hummer et al., 1993) to perform high-accuracy R-matrix calculations of these ions. However, no equivalent systematic calculation of line emissivities for all He-like or H-like ions exists. We present here an initial study of Ne IX comparing new high accuracy calculations of collisional and radiative transition rates to a number of existing results.
We began this project with He-like ions because they provide powerful diagnostics on the physical conditions of the plasma. Neon is an obvious choice as it is an astrophysically abundant element not affected by dust depletion, with emission lines around 1 keV that can be easily detected by both Chandra and XMM-Newton. Furthermore, experimental measurements of Ne IX spectra are available to test the models (Wargelin, 1993). In collisional equilibrium models, at least 1% of neon is He-like in plasmas with temperatures between and K (Mazzotta et al., 1998), and thus Ne IX emission is present in numerous types of astrophysical sources.
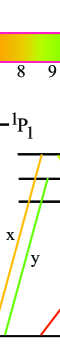
The transitions from the n=2 He-like energy levels are particularly favorable for use as diagnostics, because their rates vary widely. Figure 1 shows the fine-structure levels arising from n=2 together with the transitions: w, x, y, and z, with eight orders of magnitude variation between the w (resonance line) and the z (strongly forbidden line) transition rates. The emission lines from these transitions in He-like ions have been used in a number of ways, including not only in the well-known G-ratio () for temperature and ionization state and R-ratio () for density (Gabriel & Jordan, 1969), described below, but also as diagnostics for photoionization (Porquet & Dubau, 2000), photoexcitation (Mewe & Schrijver, 1978; Kahn et al., 2001), and non-Maxwellian velocity distributions (Gabriel et al., 1991). Early observations of He-like ion lines, including Ne IX, in solar active region and flare X-ray spectra have provided general diagnostics for density and temperature, but with complications due to line blending, resonance scattering, and atomic data (Doschek, 1990; McKenzie, 1987). More recently, for stellar coronae, Ne IX emission lines have been used to measure relative Ne abundances (Drake et al., 2001; Huenemoerder, Canizares & Schulz, 2001) and optical depths (Ness et al., 2003a), as well as temperatures and densities (Ayres et al., 2001; Osten et al., 2003; Ness et al., 2003b). Measurements of changing line ratios during stellar flares are used to estimate the temperature and density in the heated plasma (Güdel et al., 2002; van den Besselaar et al., 2003; Raassen et al., 2003).
He-like emission line ratios have been calculated by a number of authors, including Bautista & Kallman (2000), who considered both collisional and photoionized plasmas, Smith et al. (2001), who focused on O VII, by Porquet et al. (2001), computing models for C V, N VI, O VII, Ne IX, Mg XI, and Si XIII. Smith et al. (2001) showed that including higher- states, especially level-resolved dielectronic recombination to high- states, could significantly affect the G-ratio at higher energies. Porquet et al. (2001) included the effect of a radiation field on the forbidden and intercombination lines, but these calculations were based on distorted wave (DW) electron-impact excitation rate calculations. Zhang & Sampson (1987) considered resonance effects manually added to a DW calculation, but only for the states. These were included by Smith et al. (2001), with little resulting effect.
Despite advances in atomic calculation methods and the frequent use of He-like diagnostics, Bautista & Kallman (2000), Smith et al. (2001) and Porquet et al. (2001) all used rates taken from the DW calculations, primarily from Sampson, Goett & Clark (1983). Although some modern R-matrix calculations are now available (Bautista, 2003; Delahaye et al., 2006), the compilation by Sampson, Goett & Clark (1983) is one of the few complete collections of He-like ion rates that includes all ions of astrophysical interest at X-ray energies. A signal that these data may not be adequate, however, came from a detailed study of Ne IX lines from Capella, where Ness et al. (2003b) found that the G-ratio diagnostic suggested a temperature less than K, despite the well-known and strong peak in Capella’s emission measure distribution at K. A similar discrepancy was found by Testa et al. (2004) from the G-ratios of O VII and Mg XI. Meanwhile, Osten et al. (2003) inferred a low electron density for CrB from the Ne IX R-ratio diagnostic, despite finding larger values from other diagnostics. These problems suggested to us that resonances, which tend to increase the collisional excitation rate of non-dipole transitions at low energies, could be significant. We knew these were not included in the existing line ratio calculations of Smith et al. (2001) that used the DW method. However, the R-matrix method will automatically generate all relevant resonances, and can be extended by carrying out a DW calculation for larger principal quantum as well. A number of such calculations exist, including Bautista (2003), Delahaye et al. (2006), and Chen et al. (2006). For this work, we used the R-matrix calculation of Chen et al. (2006) for Ne IX, which include the largest number of states (up to ).
2. Method
Once all the necessary atomic data have been compiled, calculating line strengths for collisional plasmas is straightforward with the APEC code (Smith et al., 2001). APEC uses an explicit rate matrix formulation including collisional and radiative transitions between levels, as well as dielectronic and radiative recombination from the next higher ionization state to the ground and excited levels of the ion under consideration. The APEC code does not contain atomic data within the code itself, but instead reads from a database of FITS files that can be modified as needed. This makes comparisons between different atomic calculations easy, as any changes in the database are entirely independent of the code.
2.1. Collisional Excitation Rate Calculation
For , we use the collisional rate coefficients of Chen et al. (2006). These electron collisional excitation calculations use a fully-relativistic close-coupling approach. As discussed in Chen et al. (2006), the additional resonance excitation included in this calculation brings the model G-ratio values into much better agreement with the laboratory results measured at the LLNL Electron-Beam Ion Trap (EBIT) experiment (Wargelin, 1993).
Smith et al. (2001) showed that high- transitions (up to ) can be significant to the high-temperature values of the G-ratio. The variation appears to be largely due to dielectronic recombination (see §2.3) into high- states, but for completeness we added collisional excitation rates for levels calculated with the DW FAC code (Gu, 2003).
2.2. Radiative recombination
APEC initially used photoionization rates to calculate the rate of radiative recombination to ground and excited states of Ne IX, via the principle of detailed balance, primarily from Verner & Yakovlev (1995) for ground-state photoionization and Clark, Cowan & Bobrowicz (1986) for excited-state results. Recently Badnell (2006a) calculated level-separated radiative recombination rates for all atoms with and ion stages up to and including Na-like ions recombining to Mg-like ions. These data are significantly improved from the original rates in APED, and they extend to higher individual levels ( compared to ). We therefore use the Badnell (2006a) calculation in this paper. We note that a comparison of the existing APEC results and Badnell (2006a) shows that the two calculations agree to better than 30% for plasmas with temperatures between and K for the rates to the individual levels and the total recombination rate to Ne IX.
2.3. Dielectronic Recombination (DR)
Dielectronic satellite recombination involves two electron transitions. The incoming free electron, with energy , recombines into an excited level with energy of ion while also exciting a bound electron into energy level , leaving the ion in a doubly-excited state. Unlike radiative recombination, this is a resonant process since . The doubly-excited ion then relaxes when one electron transitions to a lower state (often a state with the lowest unoccupied orbital) and either ejects the second electron or emits a “satellite line” photon. This latter case is the DR process, and the photon emitted appears as a red-shifted “satellite” of the transition that would occur without the presence of the second excited electron. The ion is then left in an excited state, which usually decays via a radiative transition.
All DR calculations include the explicit generation of many different satellite transitions; depending upon the configurations included, the number of transitions can range into the millions or more. Each transition has a temperature-dependent rate that generates a particular DR satellite line and leaves the ion in a specific excited state. In practice the DR rates are summed either to generate the total DR excitation rate for each excited state (eliminating information about the satellite lines), or to obtain the total DR rate for the ion (eliminating information about DR excitation). Of course correctly calculating the output spectrum requires individual transition data, which are difficult to obtain. At sufficiently high resolution, the satellite lines can be separated from the primary transitions, so for this project we ignore the satellite lines and use DR data that have been summed to create level-specific recombination rates. However, as noted by Bautista & Kallman (2000), the G-ratio measured with spectrometers with low- or medium-resolution may be affected by blending of the primary lines with DR satellites. For the DR data, we use rates from the recent calculation of Badnell (2006b)111These can be downloaded from http://www-cfadc.phy.ornl.gov/data_and_codes/aurost/aurost_recomb/home.html , which include transitions up to for recombinations to Ne IX.
3. Results
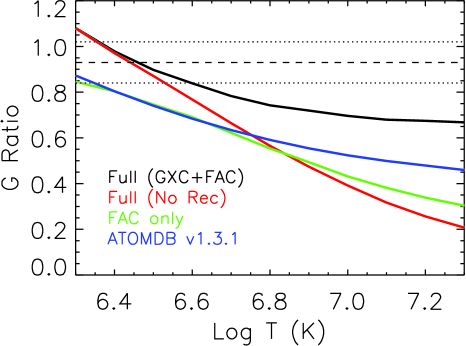
We are now able to compare line ratio results from a number of different calculations. We used four different calculations for this paper. The Full model uses the complete data set, as described in §2, while the Full (No Rec) model uses the complete data set excluding radiative and dielectronic recombination. The ATOMDB v1.3.1 model uses the original ATOMDB v1.3.1 database (Smith et al., 2001). This model uses electron excitation rates from Sampson, Goett & Clark (1983), radiative recombination rates derived from the partial photoionization rates of Clark, Cowan & Bobrowicz (1986), dielectronic recombination rates from Vainshtein & Safronova (1978) and Safronova et al. (2000), and radiative transition rates from a number of sources (Wiese et al., 1996; Derevianko & Johnson, 1997; Lin et al., 1977; Fernley et al., 1987; Drake, 1988; Kelly, 1987; Sampson, Goett & Clark, 1983). Details of which data source is used for any particular transition is available on the ATOMDB website (http://cxc.harvard.edu/atomdb/WebGUIDE/. The FAC model uses atomic data taken exclusively from the Flexible Atomic Code (Gu, 2003) and does not include recombination. These four cases allow discrimination amongst changes due to the R-matrix calculation alone, those due to a larger transition matrix, and those due to increased consideration of recombination effects. We postpone to a later paper consideration of effects due to innershell ionization from Ne+7 due to the small range of temperatures with both significant Ne+7 ions and detectable Ne IX lines. In all cases we assume collisional ionization equilibrium, using the tables of Mazzotta et al. (1998).
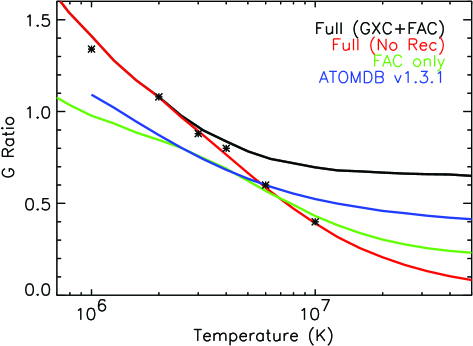
We focus on two line ratios commonly used for He-like ions, the already-described G-ratio, which is a temperature and ionization state diagnostic, and the R-ratio, a density diagnostic. In Figure 2 we show the G-ratio as a function of temperature for our four different models. A number of effects are immediately apparent: (1) The R-matrix results create a systematically larger G-ratio, (2) the FAC results (which do not include resonances, but do extend to ) show a more complex behavior which is generally closer to the current ATOMDB results, and (3) including recombination systematically changes the result for temperatures above K. The relative difference between the Full results and those in ATOMDB v1.3.1 is an almost constant 25%.
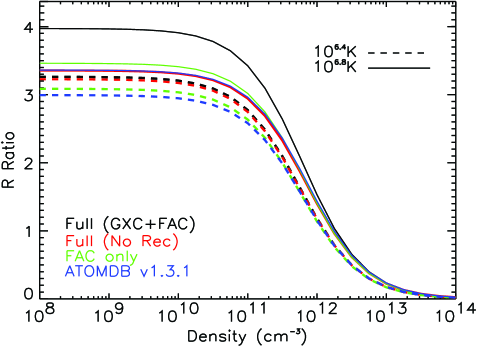
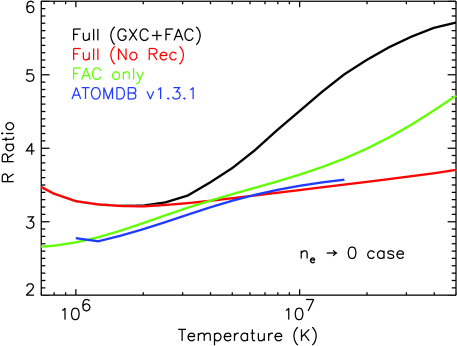
Figure 3 shows the R-ratio as a function of electron density at two different temperatures and as a function of temperature (at an electron density of 1 cm-3). As the density increases, the slow radiative decay of the S0 to the ground state (the line) is eventually matched by electron excitation to the P1,2 levels, which decay to the ground state (creating the and lines). For a given temperature, the models are all quite similar at high densities, but diverge from each other at lower densities, reflecting in part the additional resonance contribution in the Full and Full (No Rec) models. Also at the lower densities, the Full and Full (No Rec) are similar for the lower temperature case (where very little H-like neon is present) but differ significantly at the higher temperature due to recombination. Above the low-density limit, as the R-ratio begins to decline rapidly, the different models lead to a factor of two difference in the inferred density. Figure 3[Right] shows that recombination produces a significant increase in the R-ratio as the temperature increases. However, at lower temperatures the biggest differences among the models are due to differences between the R-matrix and DW calculations.
4. Discussion and Conclusions
The original goal of the project was to determine if the unexpected results found by observers such as Osten et al. (2003) and Ness et al. (2003b) were due to astrophysics or simply due to inadequate atomic models. In both cases, the authors noted the issue but were unable to distinguish between the two possibilities, and unfortunately, our results confirm that there is no simple or quick method to select between them. Our results show a difference between the DW and R-matrix of , within the oft-quoted error of “approximately 30%” for atomic calculations. They also demonstrate that this 30% inaccuracy is inadequate for use with bright lines observed by current X-ray satellites.
In Figure 4[Left] we show the Ne IX G-ratio in the same format as Figure 11 of Ness et al. (2003b). The horizontal dashed line shows the measured value from Capella (with errors shown as dotted lines). As noted by Ness et al. (2003b), the result from ATOMDB v1.3.1 barely agrees with the observed ratio, and only at a very low temperature. Our new calculation predicts a temperature in the range . Differential Emission Measure (DEM) fits of Capella using X-ray and EUV spectra have consistently shown a strong peak at (Brickhouse et al., 1995), although with some dispersion and emission at other temperatures. The agreement between our results and laboratory measurements (Chen et al., 2006) suggests that the remaining difference between the G-ratio and DEM temperatures may well be due to the plasma conditions, and not to errors in atomic physics.
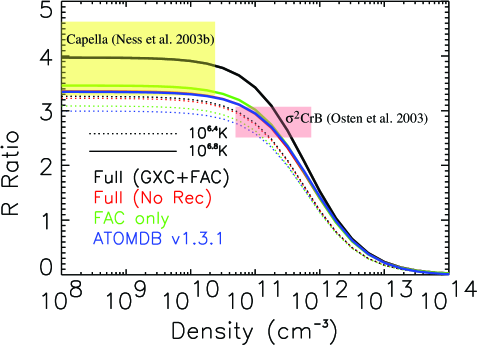
Although the G-ratio is useful as a temperature diagnostic, temperature can also be measured from the bremsstrahlung continuum or from broad spectral fits. However, density diagnostics require specific line ratios, and the strong lines emitted by He-like ions make the R-ratio both useful and usable. Figure 4[Right] shows the ratio for all four calculations, done at two temperatures, and 6.8. These were chosen since they cover the range from the best-fit temperature using the G-ratio and from DEM fits for both Capella (Ness et al., 2003b), and, coincidentally, CrB (Osten et al., 2003). Ness et al. (2003b) noted that their value for the R-ratio in Capella (, shown as the yellow box) is only marginally in agreement with the ATOMDB v1.3.1 values. We see here that the new calculation is now consistent with the low-density limit. Meanwhile, the lower value found by Osten et al. (2003) of (shown as the pink box) led to an inferred density at or near the low-density limit (less than cm-3), while the new results show a measurable density from Ne IX in CrB, ranging from cm-3.
Our results show that an update for the He-like isosequence for all astrophysically important elements is urgently needed, since the existing data systematically underestimate key diagnostic line ratios. This process is underway, with new calculations being done by our and other groups. All available updates will be included in the next revision (v2.0.0) of the ATOMDB.
References
- Ayres et al. (2001) Ayres, T. R., Brown, A., Osten, R. A., Huenemoerder, D. P., Drake, J. J., Brickhouse, N. S. & Linsky, J. L. 2001, ApJ, 549, 554
- Badnell (2006a) Badnell, N. R. 2006, A&A, 447, 389
- Badnell (2006b) Badnell, N. R. 2006, ApJS, 167, 334
- Bautista & Kallman (2000) Bautista, M. A., Kallman, T. R. 2000, ApJ, 544, 581
- Bautista (2003) Bautista, M. A. 2003, J. Phys B, 36, 1503
- van den Besselaar et al. (2003) van den Besselaar, E. J. M, Raassen, A. J. J., Mewe, R., van der Meer, R. L. J., Güdel M. & Audard, M. 2003, A&A, 411, 587
- Brickhouse et al. (1995) Brickhouse, N. S., Raymond, J. C., & Smith, B. W. 1995, ApJS, 97, 551
- Brinkman et al. (2001) Brinkman, A. C., et al. 2001, A&A, 365, L324
- Canizares et al. (2000) Canizares, C. R., et al. 2000, ApJ, 539, L41
- Chen et al. (2006) Chen, G. X., Smith, R. K., Kirby, K., Brickhouse, N. S., & Wargelin, B. J. 2006, Phys. Rev. A, 74, 042709
- Clark, Cowan & Bobrowicz (1986) Clark, R. E. H., Cowan, R. D., & Bobrowicz, F. W. 1986, ADNDT, 34, 415
- Cox & Tucker (1969) Cox, D. P. & Tucker, W. H. 1969, ApJ, 157, 1157
- Delahaye et al. (2006) Delahaye, F., Pradhan, A. K., & Zeippen, C. J. 2006, J Phys B, 39, 3465
- Dere et al. (1997) Dere, K. P., Landi, E., Mason, H. E., Monsignori Fossi, B. C., & Young, P. R. 1997, A&AS, 125, 149
- Derevianko & Johnson (1997) Derevianko, A. & Johnson, W. R. 1997, Phys Rev A, 56, 1288
- Doschek (1990) Doschek, G. A. 1990, Ap. J. Supp. Ser., 73, 117
- Drake (1988) Drake, G. W. 1988, Can. J. Phys. 66, 586
- Drake et al. (2001) Drake, J. J., Brickhouse, N. S., Kashyap, V., Laming, J. M., Huenemoerder, D. P., Smith, R. K. & Wargelin, B. J. 2001, ApJ, 549, L81
- Fernley et al. (1987) Fernley, J. A., Seaton, M. J. & Taylor, K. T. 1987, J.Phys.B, 20, 6457
- Gabriel & Jordan (1969) Gabriel, A. H. & Jordan, C. 1969, MNRAS, 145, 241
- Gabriel (1972) Gabriel, A. H. 1972, MNRAS, 160, 99
- Gabriel et al. (1991) Gabriel, A. H., Bely-Dubau, F., Faucher, P., & Acton, L. W. 1991, ApJ, 378, 438
- Gu (2003) Gu, M. F. 2003, ApJ, 582, 1241
- Güdel et al. (2002) Güdel, M., Audard, M., Skinner, S. L. & Horvath, M. I. 2002, ApJ, 580, L73
- Huenemoerder, Canizares & Schulz (2001) Huenemoerder, D. P., Canizares, C. R. & Schulz, N. S. 2001, ApJ, 559, 1135
- Hummer et al. (1993) Hummer, D. G, Berrington, K. A, Eissner W., Pradhan A. K., Saraph H.E. & Tully J. A 1993, A&A, 279, 298
- Kaastra, Mewe & Nieuwenhuijzen (1996) Kaastra, J. S., Mewe, R., & Nieuwenhuijzen, H. 1996, “UV and X-ray Spectroscopy of Astrophysical and Laboratory Plasmas” eds. K. Yamashita and T. Watanabe. (Tokyo : Universal Academy Press), p.411
- Kahn et al. (2001) Kahn, S. M et al. 2001, A&A, 365, L312
- Kelly (1987) Kelly, R. L. 1987, J. Phys. Chem. Ref. Data, 16, Supp 1
- Landini & Monsignori Fossi (1972) Landini, M. & Monsignori Fossi, B. C. 1972, A&AS, 7, 291
- Lin et al. (1977) Lin, C. D., Johnson, W. R. & Dalgarno, A. 1977, Phys Rev A, 15, 154
- Mazzotta et al. (1998) Mazzotta, P., Mazzitelli, G., Colafrancesco, S., Vittorio, N. 1998, A&AS, 133, 403
- McKenzie (1987) McKenzie, D. L. 1987, 322, 512
- Mewe (1972) Mewe, R. 1972, Solar Phys., 22, 459
- Mewe & Schrijver (1978) Mewe, R., & Schrijver, J. 1978, A&A, 65, 99
- Ness et al. (2003a) Ness, J.-U., Schmitt, J. H. M. M., Audard, M., Güdel M. & Mewe, R. 2003, A&A, 407, 347
- Ness et al. (2003b) Ness, J.-U., Brickhouse, N. S., Drake, J. J. & Huenemoerder, D. P. 2003, ApJ, 598, 1277
- Osten et al. (2003) Osten, R. A., Ayres, T. R., Brown, A., Linsky, J. L. & Krishnamurthi, A. 2003, ApJ, 582, 1073
- Porquet & Dubau (2000) Porquet, D. & Dubau, J. 2000, A&AS, 143, 495
- Porquet et al. (2001) Porquet, D., Mewe, R., Dubau, J., Raassen, A. J. J. & Kaastra, J. S. 2001, A&A, 376, 1113
- Raassen et al. (2003) Raassen, A. J. J., Mewe, R., Audard, M. & Güdel, M 2003, A&A, 411, 509
- Raymond & Smith (1977) Raymond, J. C. & Smith, B. 1977, ApJ, 35, 419
- Safronova et al. (2000) Safronova, U. I., Vasilyev, A. A. & Smith, R. K. 2000, Canadian Journal of Physics, 78, 1055
- Sampson, Goett & Clark (1983) Sampson, D. H., Goett, S. J. & Clark, R. E. H. 1983, ADNDT, 29, 467
- Smith et al. (2001) Smith, R. K., Brickhouse, N. S., Liedahl, D. A., & Raymond, J. C. 2001, ApJ, 556, L91
- Testa et al. (2004) Testa, P. Drake, J. J. & Peres, G. 2004, ApJ, 617, 508
- Vainshtein & Safronova (1978) Vainshtein, L. A., & Safronova, U. I. 1978, ADNDT, 21, 49
- Verner & Yakovlev (1995) Verner, D. A., & Yakovlev, D. G. 1995, A&AS, 109, 125
- Wargelin (1993) Wargelin, B. J. 1993, Ph.D. Thesis, LLNL, 1993 (unpublished)
- Wiese et al. (1996) Wiese, W. L., Fuhr, J. R. & Deters, T. M. 1996, J. Phys. Chem. Ref. Data, Monograph No. 7
- Zhang & Sampson (1987) Zhang, H. & Sampson, D. 1987, ApJS, 63, 487