A Large Sample of Photometric Rotation Periods for FGK Pleiades Stars
Abstract
Using data from the HATNet survey for transiting exoplanets we measure photometric rotation periods for Pleiades stars with . We detect periodic variability for 74% of the cluster members in this mass range that are within our field-of-view, and 93% of the members with . This increases, by a factor of five, the number of Pleiades members with measured periods. Included in our sample are newly identified probable cluster members which have proper motions, photometry, and rotation periods consistent with membership. We compare this data to the rich sample of spectroscopically determined projected equatorial rotation velocities () available in the literature for this cluster. For stars with the rotation periods, and radius estimates are consistent with the stars having an isotropic distribution of rotation axes, if a moderate differential rotation law is assumed. For stars with the inferred values are systematically larger than . These observations imply that the combination of measured parameters is too large by for low-mass stars in this cluster. By comparing our new mass-period relation for the Pleiades to the slightly older cluster M35, we confirm previous indications that the spin-down stalls at for the slowest rotating stars with – a fact which may indicate that the internal transport of angular momentum is inefficient in slowly rotating solar mass stars.
keywords:
stars: rotation, spots, late-type — open clusters and associations: individual: Pleiades — techniques: photometric catalogues1 Introduction
Due to its proximity, richness, and age, the Pleiades star cluster (, e.g. Soderblom et al., 2005; , e.g. Stauffer et al., 1998) has served for many years as one of the benchmark clusters in studies of stellar angular momentum evolution. Skumanich (1972) first determined the empirical spin-down relation for solar-type stars () by comparing measurements of the projected rotation velocities () of solar-mass stars in the Pleiades and the Hyades to the equatorial rotation velocity of the Sun. Since then there have been numerous studies presenting rotation periods and values for stars in the Pleiades (see the references given in sections 4.1 and 4.2).
Recently, large samples of stellar photometric rotation periods have been published for a number of open clusters (see for example the summary and references given by Irwin & Bouvier, 2009 for 18 open clusters, together with some new results, not included in their list, for Coma Berenices by Collier Cameron et al., 2009, for NGC 2301 by Sukhbold & Howell, 2009, and for M34 by James et al., 2010). These data have enabled theoretical investigations of the angular momentum evolution of low-mass stars (again see the review by Irwin & Bouvier, 2009, and also a recent study by Denissenkov et al., 2009), which have led to a number of insights into stellar physics. Observations of very young clusters with ages can be used to study phenomena such as accretion-driven stellar winds (Matt & Pudritz, 2005, 2008a, 2008b) or star-disk-locking (e.g. Königl, 1991; Shu et al., 1994). Observations of clusters with ages are essential for constraining the time-scale of coupling between stellar convective and radiative zones (e.g. Bouvier, 2008; Denissenkov et al., 2009). Finally, observations of older clusters are important for constraining models of magnetized stellar winds (Kawaler, 1988) and for calibrating the rotation-age relation (e.g. Barnes, 2007; Mamajek & Hillenbrand, 2008; Collier Cameron et al., 2009).
Although the comparison of models to the observed rotation period distributions in open clusters has led to a number of insights, these studies are hindered by incompleteness and poorly determined selection effects in the available data-sets. These effects may in turn lead to incorrect theoretical inferences. The available photometric rotation periods for the Pleiades, in particular, show evidence of being biased toward short periods (Denissenkov et al., 2009), this is unsurprising since longer period stars generally have lower amplitude variations and also require observations spanning a longer time-base to be detected, moreover apparent variations due to systematic errors in the photometry may dominate on long time-scales; the results to be discussed here do not suffer from this bias because of the long time-base and high precision of our observations. It is only possible to determine whether or not the photometric periods are biased for this cluster because it is fairly unique in having a rich, unbiased sample of values in the literature. Given the importance of the Pleiades for the study of stellar angular momentum evolution, an unbiased sample of rotation periods for stars in this cluster would be quite useful.
In this paper we present photometric periods that we associate with rotation periods for Pleiades stars. This increases the number of Pleiades stars with measured periods by a factor of 5, and importantly, it is 93% complete for stars in the mass range . For this survey we use data from the Hungarian-made Automated Telescope Network (HATNet Bakos et al., 2004), a project that uses a network of 6 small-aperture, wide-field, fully-automated telescopes to search for transiting exoplanets orbiting bright stars (e.g. Bakos et al., 2010). A similar study of stellar rotation for field K and M dwarf stars using HATNet has been recently presented by our group (Hartman et al., 2009b).
The structure of the paper is as follows: in section 2 we briefly describe the photometric observations and data reduction; in section 3 we select periodic variable stars, estimate the errors on the period, correct the light curves for distortions, present the catalogue of rotation periods, and select new cluster members; in section 4 we compare our data to previous rotation period and measurements, and we also compare our results to other open clusters. We summarize the results in section 5.
2 Observational Data and Initial Reduction

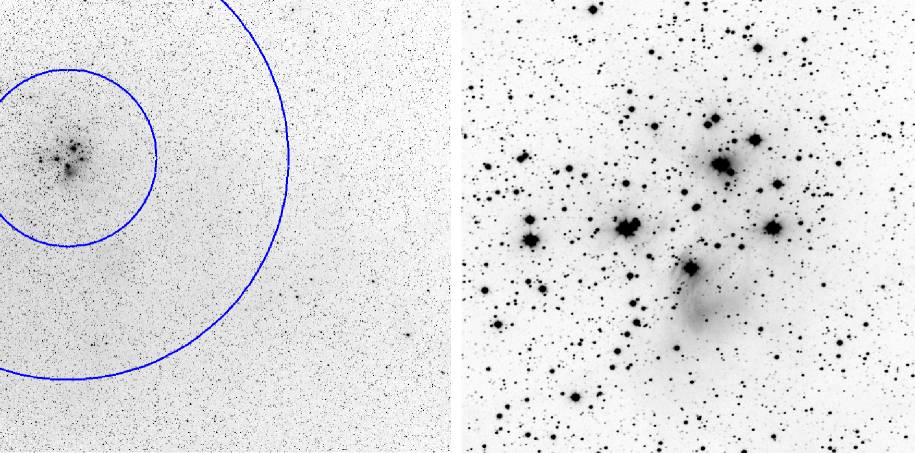
Photometric time-series observations of the Pleiades cluster were obtained between 15 September 2008 and 16 March 2009 using the identical HAT-9 and HAT-10 11 cm aperture robotic telescopes located at Mauna Kea Observatory (MKO) in Hawaii and at Fred L. Whipple Observatory (FLWO) in Arizona respectively. Each telescope used a 4K4K CCD and a Sloan filter to observe a field of view (FOV) centered at 03:30:00, 22:30:00 (J2000). The Pleiades are not centered in this field; the field (internally designated as G259) was observed as part of the standard operations of the HATNet transit survey, and was not specifically chosen to observe the cluster. Figure 1 shows a typical image of this field. The images have a pixel scale of ; the full-width at half-maximum (FWHM) of the point-spread function (PSF) is pixels (). A total of 3648 exposures of 5 minutes, taken at 5.5 minute cadence, were obtained with the HAT-9 instrument, while 3138 images with the same exposure time and cadence were obtained with the HAT-10 instrument. Figure 2 shows the temporal distribution of observations obtained with each of these instruments.
The images were calibrated and reduced to light curves using tools developed for the HATNet transit survey (see Pál, 2009; Bakos et al., 2004). Briefly, after applying bias, dark current, and twilight sky-flat calibrations in a standard fashion, stars were identified on the images. The star lists were then matched to the Two Micron All-Sky Survey (2MASS; Skrutskie et al., 2006) point source catalogue (PSC) using the methods described by Pál & Bakos (2006) to determine the astrometric solutions for the images. Aperture photometry is then performed at the positions of all 2MASS sources with transformed to the image coordinate system. For each resulting light curve the median magnitude is fixed to the approximate magnitude of the source based on the following transformation from the 2MASS , and magnitudes (see Bilir et al., 2008, who give transformations from 2MASS magnitudes to Sloan and colors; we followed the same procedure to determine a transformation from 2MASS magnitudes to Sloan magnitude):
| (1) |
The RMS scatter between the observed and predicted magnitudes for the stars used to determine this relation is . For each source, photometry is performed using three apertures of radii 1.45, 1.95 and 2.35 pixels. Following the post-processing routines discussed below, we adopt a single “best” aperture for each light curve. For stars with we take the smallest aperture to minimize sky noise, for brighter stars we adopt the aperture for which the processed light curve has the smallest RMS.
The initial ensemble calibration of the light curves against variations in the flux scale was performed using the method described in section 2.7.3 of (Pál, 2009). These light curves are then passed through two routines that filter out systematic variations that are correlated with measureable instrumental parameters or are present in other stars in the field. The first routine, external parameter decorrelation (EPD), decorrelates each light curve against a set of measured instrumental parameters including the shape of the PSF, the sub-pixel position of the star on the image, the zenith angle, the hour angle, the local sky background, and the variance of the background (see Bakos et al., 2010). This decorrelation is done independently on the data from the HAT-9 and HAT-10 telescopes. The procedure is applied assuming that each star has a constant magnitude. For large amplitude variable stars this may distort the signal and may lower the S/N of the detection, however such large amplitude variables will generally still be detectable.
After applying EPD, the light curves are then processed with the Trend-Filtering Algorithm (TFA; Kovács, Bakos & Noyes, 2005) which decorrelates each light curve against a representative sample of other light curves from the field. We used 530 template stars ( of the total number of images for the field). In applying the TFA routine we also clip outliers from the light curves. At this point in the analysis we apply EPD and TFA in signal-recovery mode (i.e. we apply them under the assumption that the signal is constant), once a signal is detected we then apply EPD and TFA in signal-reconstruction mode on the original light curve to obtain an undistorted trend-filtered light curve for the star (see section 3.3). As for EPD, signal-recovery mode TFA may distort the signal and lower the S/N of large amplitude variable stars, though typically the effect is not significant enough to prevent the variable from being selected.
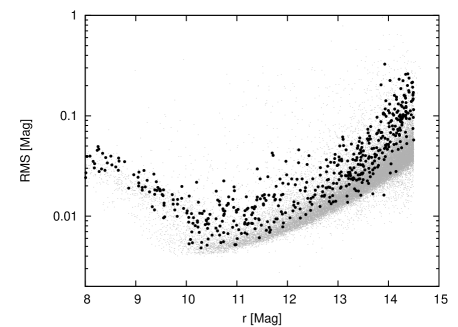
In figure 3 we show the unbiased RMS of the EPD/TFA corrected light curves for all stars in field G259. The unbiased RMS of a light curve is calculated using
| (2) |
where are the individual magnitudes, is the average magnitude, is the number of points in the light curve, and is the number of parameters used in applying EPD/TFA. We mark separately the probable Pleiades members (see section 3.4). Stars with are saturated in a significant fraction of the images (due to vignetting the exact magnitude of saturation depends on the position of the star on the image; it also depends on the sky brightness and transparency which changes from image to image). The unbiased RMS of stars with is . The light curves of Pleiades members generally have greater RMS than those of field stars; this reflects the fact that detectable photometric variability is significantly more common for Pleiades members than it is for field stars (see section 3.4).
3 Search for Periodic Variables
We use the Lomb-scargle periodogram (Lomb, 1976; Scargle, 1982; Press & Rybicki, 1989) as implemented in the VARTOOLS program (Hartman et al., 2008b) to search the light curves for periodic variations. We generate the periodogram for each light curve at a frequency resolution of between and , where is the time-span of a given light curve. The high-frequency cut-off of is adopted as stars are not expected to have rotation periods shorter than this, and expanding the range of the frequency search increases the bandwidth penality, decreasing the significance of a given detection. We correct the periodogram for red noise by removing any low-order frequency dependence in the mean value of the periodogram and in the RMS of the periodogram. To do this we fit a fifth order polynomial to the periodogram, as well as a fifth order polynomial to the RMS of the periodogram calculated in 100 frequency bins. We then define a new periodogram using
| (3) |
where is the value of the original periodogram at frequency , is the polynomial fit to the RMS of the periodogram as a function of frequency, is the polynomial fit to the periodogram, and the brackets denote averaging over frequency. We perform the fit using 5- iterative clipping, using the model value of in the clipping.
We identify the highest peak in the corrected periodogram and determine its S/N using an iterative 5- clipping in calculating the RMS of the periodogram. To set the selection threshold we simulate 10000 white noise light curves with the same time sampling as the observations, calculate the red-noise corrected L-S periodogram of each simulation, and determine the S/N of the highest peak in each periodogram using the same procedure as used for the real light curves. Figure 4 shows the false alarm probability (FAP) as a function of determined from the simulations, which we find to be well-fit by a function of the form:
| (4) |
This is similar to the form expected for a normalized L-S periodogram without red-noise correction or clipping (e.g. Press et al., 1992). We adopt a cut-off of S/N which corresponds to a 0.08% FAP. A total of 2236 of the 36,011 stars in the field pass the selection. In section 3.4 below we focus on the stars that are likely to be cluster members. Adopting a lower threshold of S/N (corresponding to a 1% FAP) would increase the total number of selected potential variable stars to 2878.

3.1 Resolving Aliases
In some cases there is an ambiguity in choosing the correct period from among several possible aliases or harmonics. In general we follow the convention of adopting the highest S/N peak in the red-noise corrected L-S periodogram. We found, however, that often the red-noise correction changes the most signficant peak in the periodogram to a high frequency alias of the most significant peak in the uncorrected periodogram, . Here is the sidereal frequency. In these cases we adopt the period from the uncorrected periodogram. We found that generally the periods from the red-noised corrected periodograms pile-up near while the periods from the uncorrected periodograms fall along the main period-mass relation (see figure 12).
3.2 Estimation of Period Uncertainties
As discussed by Hartman et al. (2009a), the primary factors that contribute to errors in the measured photometric rotation period are:
Instrumental Effects
-
1.
choosing an alias or harmonic of the true period,
-
2.
noise in the photometry together with finite sampling of the light curve,
-
3.
inadequacies in the model used to determine the period (e.g., the light curve is periodic but not sinusoidal),
Physical Effects
-
4.
spot evolution, and
-
5.
differential rotation.
The periodogram for a light curve will contain several discrete peaks at harmonics and aliases of the true period. Deciding which peak is the correct one is difficult to do in general. We do not consider this effect in estimating the uncertainties on the measured periods.
The effects 2-4 listed above all contribute to the spread in the periodogram peak, which reduces the precision with which the position of the peak may be measured. We determine the resulting error in the period by fitting a Gaussian function to the points within of the periodogram peak and measuring the 1 spread in the position of the peak using the Extended Markov-Chain Monte Carlo technique (see Pál, 2009). We set the error for each point in the periodogram equal to the RMS of the full periodogram determined with an iterative clipping. We also record the standard deviation of the best-fit Gaussian, as this contains information on the spot life-times.
Differential rotation may contribute to the uncertainty in two ways. If there are multiple spot groups at different stellar latitudes, the differing rotation periods for each group will broaden the periodogram peak, and will contribute to the uncertainty in the period as just described. Differential rotation will also lead to a systematic error in determining the rotation period of the star since the degree of differential rotation and the latitude of the dominant spot group are not known, making it impossible to relate the measured period to the period at a reference latitude (such as the equator). If Pleiades stars exhibit solar-like differential rotation (the rotation period increases towards the poles), the measured periods will be systematically longer than the equatorial period. The Sun exhibits differential rotation following
| (5) |
where is the rotation period at latitude , is the equatorial rotation period, and when using spots to track the rotation (Kitchatinov, 2005). For younger, more rapidly rotating stars, the value of is expected to decrease (Brown et al., 2004). Observations of the solar-like star Ceti by the Microvariability and Oscillations of Stars (MOST) satellite bear this theoretical expectation out, finding (Walker et al., 2007). The observations of Ceti also indicate that spots on rapidly rotating stars may be found at any latitude; this is in contrast to the Sun where spots are rarely seen with . Assuming the dominant spot groups are isotropically distributed on Pleiades stars (i.e. is uniformly distributed), and that these stars exhibit solar-like differential rotation with , we expect the measured rotation periods to have a mean value of , with a standard deviation of . For the respective values are and . We do not include systematic errors due to differential rotation in the period uncertainties reported in our catalogue.
3.3 Signal Reconstruction with EPD/TFA
Once a period is determined for a star, we obtain a new trend-filtered light curve by running EPD and TFA in signal reconstruction mode (e.g. Kovács, Bakos & Noyes, 2005). This correction is important to get an unbiased measurement of the amplitude of photometric variations. To do this, we fit to the pre-EPD light curve (i.e. the light curve has been corrected for ensemble variations in the flux scale, but has not had any other filtering applied to it), a model of the form:
| (6) | |||||
The first sum is a Fourier series with period (the period found for the light curve in section 3) which is used to represent the physical signal, while the second sum is a model for the instrumental/atmospheric variations. The free parameters in this model are the , and coefficients, while the terms, which represent instrumental variations, consist of 530 template light curves, together with 14 known instrumental parameter sequences (including: the X and Y subpixel positions of the star to first and second order, 3 parameters describing the PSF shape to first and second order, the hour angle, the zenith angle, the background, and the deviation of the background). Because all free parameters enter linearly in eq. 6, the fit can be done quickly using singular value decomposition (e.g. Press et al., 1992).
We take the amplitude of the light curve to be equal to the peak-to-peak amplitude of the Fourier series in eq. 6. For four stars, HAT-259-0000690 (PELS 020), HAT-259-0000923 (HII 120), HAT-260-0000924 (HII 1182) and HAT-260-0007928 (HII 906), with periods very close to , , and days respectively, the poor phase coverage of the HATNet light curves means that the high order harmonics in the Fourier series are not well constrained. For these stars we therefore do not include any harmonics other than the fundamental (i.e. the Fourier series includes one term only) when fitting equation 6.
The median value of the ratio of amplitudes from signal reconstruction EPD/TFA light curves to amplitudes from signal recovery EPD/TFA light curves is 1.3. This illustrates the importance of using signal reconstruction EPD/TFA to get an unbiased amplitude measurement.
3.4 Catalogue of Rotation Periods for Pleiades Members
Using the recent compilation of probable Pleiades members by Stauffer et al. (2007, hereafter S07), we identify probable members with magnitudes in the range for which we have obtained light curves. We detect periodic variations for of these stars (i.e. 74% of them); for stars with , our period detection rate is 93%. Faint stars with have low photometric precision making it more difficult to detect their variations, while hotter stars with have lower amplitudes of variation. Stars with may also be saturated in a significant fraction of the images. As a comparison, for stars with that are not selected as probable cluster members, the period detection rate is 9.8%. Two factors that lead to a much higher incidence of variability for Pleiades stars include their young age relative to field stars (so that they are more active and have higher amplitudes of variability), and the fact that the majority of field stars are more distant than the Pleiades, so Pleiades stars of a given mass are brighter, and have higher precision light curves, than most field stars of that mass in the survey.
Our final catalogue of rotation periods is included in the supplementary material to the online edition of this article. Table 1 shows a portion of the catalogue for guidance regarding its form and content. We include in the catalogue fifteen stars with rotation periods in the literature that we do not recover, including the star CFHT-PL 8 which was not included in the S07 catalogue, and exclude one star with a period in the literature that is not a cluster member (see Section 4.1 for further details on these stars). We also include variable stars which are not in the S07 catalogue, but which have photometry, proper motions, and periods consistent with cluster membership (see section 3.5 below).
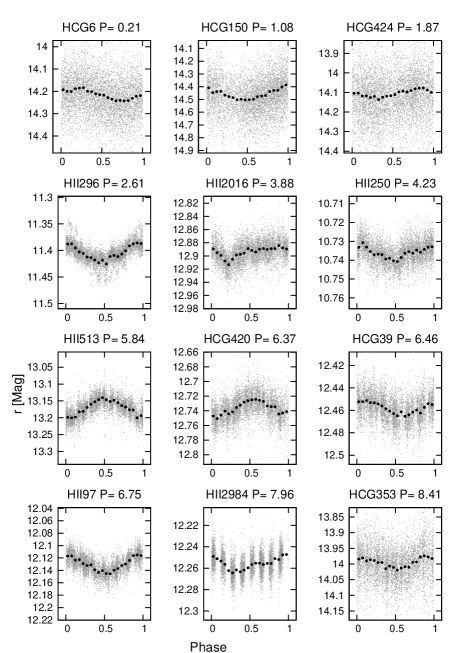
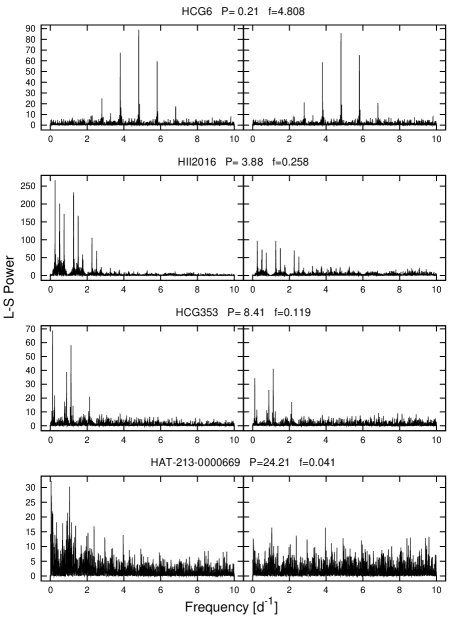
Figure 5 shows phased light curves for 12 stars randomly selected from our catalogue, while figure 6 shows L-S periodograms for 3 of these stars. Figure 6 also shows an example of a star which is not selected after applying the red-noise correction to the periodogram (equation 3). The photometric light curves for all probable members observed with HATNet will be made publicly available from the NASA Star and Exoplanet Database (NStED; von Braun et al., 2009)111http://nsted.ipac.caltech.edu.
3.5 New Cluster Members
Here we leverage the enhanced photometric variability of Pleiades stars relative to field stars to identify new members of the cluster. A similar method for selecting Pleiades members was employed by Haro et al. (1982) who identified flare stars as candidate members. More recently, Collier Cameron et al. (2009) used photometric variability to select members of the Coma Berenices open cluster.
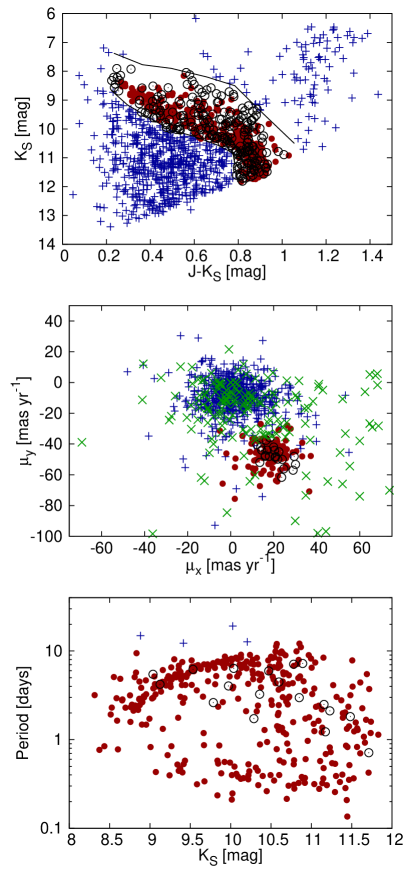
Figure 7 shows the selection of cluster members. We first select variable stars that are within of the centre of the cluster, and are near the cluster main sequence on a colour-magnitude diagram (CMD), taking the photometry from the 2MASS PSC (see the description by Cutri et al.222http://www.ipac.caltech.edu/2mass/releases/allsky/doc/seca3_1.html) when available, and from the main 2MASS PSC for all other stars. A total of 221 of the 958 variables not included in the S07 catalogue that are within of the cluster centre pass this selection. Of these, 189 have proper motions from the PPM-Extended catalogue (Röser et al., 2008), while 28 of the remaining 32 stars have proper motions from the USNO-B1.0 catalogue (Monet et al., 2003). To establish the proper motion membership probability we follow the procedure outlined in Deacon & Hambly (2004). Briefly, we assume that proper motions are distributed as:
| (7) |
where is the fraction of stars in the field, is the distribution for field stars, and is the distribution for cluster members. We assume bivariate Cauchy distributions for the field and the cluster of the form:
| (8) | |||||
| (9) |
where and are the proper motion in the right ascenscion and declination directions respectively. We determine the free parameters , , , , , and by using the downhill simplex algorithm to maximize the likelihood function
| (10) |
where the sum is over all variable stars. We also attempted to use Gaussian and Exponential distributions for and , but found that the Cauchy distributions provided the best match to the observations. The membership probability for a star is then given by
| (11) |
We require for the star to be considered a probable member. Of the 22 stars which pass the above selections, we reject 4 with periods longer than any known cluster members of comparable magnitude.
Four of the remaining probable cluster members have previously been selected as potential cluster members, but were not included in the S07 catalogue. These include HCG 84 and HCG 235, two well-known flare stars included in the catalogue of Pleiades members by Haro et al. (1982), and in several subsequent membership catalogues, and the stars SRS 79807 and SRS 34337 which were identified as proper-motion members by Schilbach et al. (1995), but to our knowledge, have not appeared in subsequent studies. All stars are included in the rotation period catalogue.
4 Discussion
4.1 Comparison With Other Period Measurements
To compare our measurements to previous observations of the Pleiades, we use the compilation of rotation periods provided on the WEBDA database333http://www.univie.ac.at/webda/webda.html. The original measurements come from a variety of sources (Stauffer et al., 1987; Prosser et al., 1993a, b, 1995; Marilli, Catalano & Frasca, 1997; Krishnamurthi et al., 1998; Terndrup et al., 1999; Messina, 2001; Clarke, MacDonald, & Owens, 2004; Scholz & Eislöffel, 2004). We also include periods for 11 stars from van Leeuwen, Alphenaar, & Meys (1987) that are not listed on WEBDA. A total of stars are included in the compilation, which is provided in table 4.
We recover rotation periods for of the stars with previous measurements. Here we discuss the 16 stars with previous measurements which we do not recover. The very low-mass stars studied by Scholz & Eislöffel (2004) are all too faint to be observed with HATNet, the star HD 23386 studied by Marilli, Catalano & Frasca (1997) and Messina (2001) is saturated in our images. There are four stars that we observed but did not detect a period for, including: HII 708 (Prosser et al., 1993b; Marilli, Catalano & Frasca, 1997), HII 727 (Prosser et al., 1993b; Marilli, Catalano & Frasca, 1997), HII 975 (Marilli, Catalano & Frasca, 1997) and HHJ 409 (Terndrup et al., 1999). The first three of these stars are near the bright end of the magnitude range covered by HATNet, while HHJ 409 is near the faint end. Finally there are two stars listed as variables on WEBDA that are not included in the S07 catalogue. One of these stars, HII 3167, was reported to be variable by Clarke, MacDonald, & Owens (2004) with a amplitude in , amplitude in and a period of . We find no evidence for variability in our light curve for this star (we match the star to 2MASS J2000.0351555+2442326 based on the plate x/y position given on WEBDA, however this identification may not correspond to the same star observed by Clarke, MacDonald, & Owens, 2004). In any case the star is not a cluster member (based on the color and magnitude given by Clarke, MacDonald, & Owens, 2004), so we do not include it in the final catalogue of Pleiades variables. The other known variable that is not in the S07 catalogue is CFHT-PL 8 (Bouvier et al., 1998), which was identified as a variable by Terndrup et al. (1999). This very low mass star is too faint to be observed by HATNet. We include it in the final catalogue of rotation periods, with coordinates and photometry taken from the 2MASS catalogue, and magnitude taken from Samus et al. (2003).

For of the previously studied stars that we recover, our frequency is within of at least one of the previously published frequencies for the star; and for stars our frequency is within of at least one of the previously published frequencies. Figure 8 shows a comparison of the rotation frequencies measured in our survey to those given in the literature for stars with previous measurements. Below we discuss the 6 cases where our frequencies are substantially different from all of the literature values:
HII 250 - Has published periods of from Marilli, Catalano & Frasca (1997) and from Messina (2001). We measure a period of . Our light curve shows no evidence for periodicity at either of the published periods.
HII 335 - Has published periods of from Stauffer et al. (1987) and from Messina (2001). Stauffer et al. (1987) also report an alias period of for this star that is consistent with our measured period of .
HII 885 - The only published period for this star is from Marilli, Catalano & Frasca (1997). We measure a period of , and find no evidence for periodicity at .
HII 1039 - The only published period for this star is from Messina (2001). We measure a period of , and find no evidence for periodicity at .
HII 1124 - Has published periods of from Prosser et al. (1995) and from van Leeuwen, Alphenaar, & Meys (1987). We find a period of for this star, however prior to correcting the periodogram for red-noise the top peak in the periodogram for this star is at . This star has km s-1 (Queloz et al., 1998), which is closer to the expected equatorial rotation velocity of km s-1 for the period than the velocity of km s-1 for the shorter period. We therefore adopt the longer period for the final catalogue.
4.2 Comparison with data

We compare our period measurements to the rich sample of measurements available for members of the Pleiades. Measurements of are taken from Stauffer et al. (1987), Soderblom et al. (1993), Queloz et al. (1998), and Terndrup et al. (2000). A total of of the stars for which we detect periods also have a value given in one of these sources.
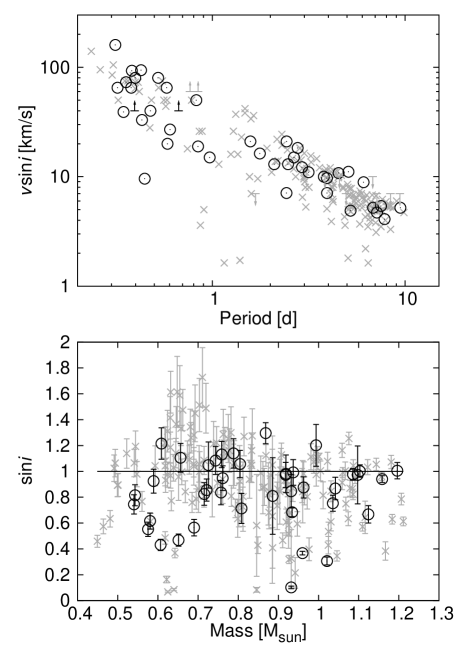
Figure 9 compares the photometric rotation periods and the values, and also compares the inferred to the stellar mass. The results are shown separately for objects selected as lying on the single-star main sequence, and objects selected as photometric binaries (see figure 13). For the remainder of this analysis we only consider nonphotometric binaries. The value for is determined from:
| (12) |
where is the measured value of the projected equatorial rotation velocity, is the measured rotation period, and is the stellar radius. We estimate the stellar radius from the magnitude using the 125 Myr, solar metallicity (the Pleiades have [Fe/H]; Soderblom et al., 2009), Yonsei-Yale isochrone (Y2; Yi et al., 2001). We transform the isochrone to the 2MASS system from the ESO system using the transformations given by Carpenter (2001). To determine the absolute magnitudes we assume a distance to the Pleiades of 133 pc (Soderblom et al., 2005) and an extinction of (S07). Note that if we instead adopt a distance of 120.2 pc to the cluster based on Hipparcos parallax measurements (van Leeuwen, 2009), and assume the same extinction and -mass and -radius relations, the inferred stellar masses and radii at fixed magnitude are lower by . Also note that if we use the Baraffe et al. (1998) isochrone models for stars with , the inferred masses at fixed are lower by , while the inferred radii are lower by . The inferred radius also depends on the assumed age for the cluster. The assumed age of for the Pleiades from Stauffer et al. (1998) is based on the observed Li-depletion of main sequence stars in the cluster, a method which has recently been called into question for other stellar populations (Jeffries et al., 2009; Yee & Jensen, 2010). Determinations of the age of the Pleiades from the main sequence turn-off range from (Mermilliod, 1981) to (Mazzei & Piggato, 1989). Adopting a younger age of for the cluster will increase the radii of stars at fixed mass; the affect on the -radius relation, however, is less significant, as stars with fixed mass will also be brighter in at younger ages. By comparing the -radius relation obtained from the solar-metallicity isochrone from Siess et al. (2000) using the Kenyon & Hartmann (1995) temperature-colour relations, to the isochrone from the same models444We use the Siess et al. (2000) isochrones rather than the Y2 isochrones because the Y2 isochrones do not cover the pre-main sequence stage of stellar evolution., we estimate that the systematic error in the radius that may result from overestimating the age of the cluster is over the magnitude range of interest. Finally if we use the magnitude to determine the radii from the Y2 isochrones, rather than the magnitude, the inferred radii for most stars are lower by up to .
As seen in Figure 9, the values determined with equation 12 are greater than 1 for many stars with . In Figure 10 we compare the observed distribution of values to various model distributions. To calculate the model distributions we generate a sample of values assuming the rotation axes of the stars are randomly oriented in space ( is uniformly distributed). We then assign to each sample value a gaussian error taken from the set of errors associated with the actual data, and use these to generate a simulated sample of measured values with the condition . As discussed in section 3.2 differential rotation may cause the measured rotation periods to be systematically longer than the equatorial rotation periods. This effect will in turn cause the measured values to be systematically greater than the true values. To include this effect in our models we associate with each simulated value a latitude for the dominant spot group. We assume that these spots may be uniformly distributed over the surfaces of the stars for reasons outlined in section 3.2, so we draw the values of from a uniform distribution in . We then scale each value by the factor (equation 5). Finally we parameterize any remaining systematic errors in the measured values of by multiplying the values by a constant scale factor . We compare the models to the observations using the Kolmogorov-Smirnov test, recording the probability that the observed sample is drawn from the same distribution as the simulated sample as a function of the parameters and (figure 10 panels (c) and (d)).
For stars with , we find that the , distribution is consistent with the observed distribution (the K-S probability that the observed and model data-sets are drawn from the same distribution is ), while a , model (i.e. a model with differential rotation that is comparable to what is expected for young rapidly rotating stars) provides a slightly better match ( probability). A similar result has recently been found in an independent study of the Pleiades and Alpha Persei by Jackson & Jeffries (2010) who placed limits on the degree to which the rotation axes of stars in these clusters are aligned.
For stars with the probability that the , model is drawn from the same distribution as the observations is only . In this case a significant value of is required to fit the observations. If we fix and allow to vary, the best matching model has a very high value of , with a probability of being drawn from the same distribution as the observations of less than .
While the distribution of values for stars are consistent with the stars having random orientations and perhaps having a slight degree of differential rotation, the measured values of for stars with appear to be systematically too large (the mode is at ). The combination of measured parameters may be systematically larger by a factor of than the same combination using the real physical parameters would be. This suggests systematic errors in one or more of the parameters. Below we consider each of the parameters in turn.
Radius – While it is well-known that the radii of rapidly rotating stars with are systematically larger than theoretical models predict (e.g. Fernandez et al., 2009, and references therein), the discrepancy appears to be and not . If we adopt the Hipparcos distance of pc to the cluster, use the Baraffe et al. (1998) isochrones rather than the Y2 isochrones, or use the magnitude rather than the magnitude to determine the radii, the inferred radii of the stars would be even smaller, exacerbating the problem.
Period – While an extreme differential rotation law of could fit the distribution, the match is still not very good. Alternatively if the dominant spot groups on lower mass Pleiades stars are not randomly distributed, but are instead preferentially located at high latitudes, this would cause the measured values to be systematically larger than they would be if the spots are randomly distributed.
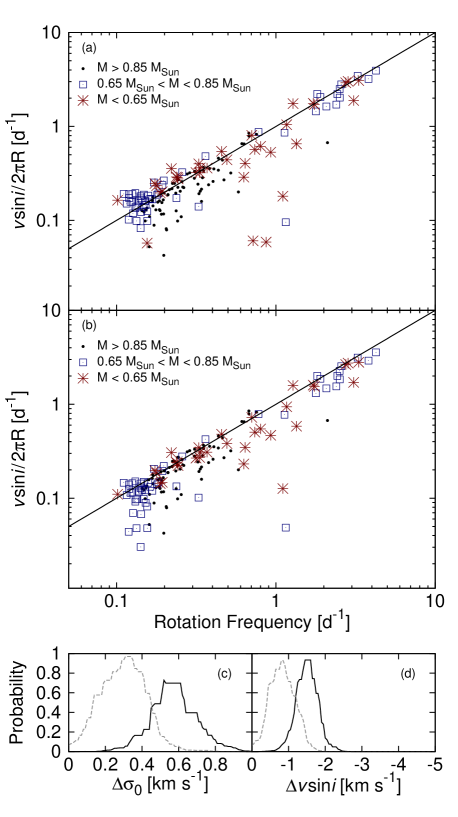
– The measurements of cool Pleiades dwarfs could be systematically biased toward larger values. Figure 11a compares the rotation frequency determined from the photometric period to the rotation frequency inferred from (i.e. ). For stars with , it appears that lower frequency (longer period) stars are more likely to have than higher frequency (shorter period) stars. An offset error in would yield this effect. Most of the longer period, low-mass stars with have measurements taken from Queloz et al. (1998). These authors calculate from the broadening of a spectral cross-correlation function using the relation:
| (13) |
where is the measured width of the cross-correlation function and and are parameters which are calibrated by artificially broadening the observed spectra of slowly rotating field stars to a fixed value of , and measuring the widths of the resulting cross-correlation functions. For the ELODIE spectrograph, Queloz et al. (1998) give , and
| (14) |
where is the measured color of a star, and is measured in km s-1. A systematic error in would impact slower rotators more significantly than faster rotators. To estimate the required systematic error in , we adjust the velocities of stars with by
| (15) |
and use the K-S test to compare the resulting distribution to the distribution for stars with . For this test we assume for these stars. Figure 11c shows the probability that the two samples are drawn from the same distribution as a function of . We conducted a similar test assuming a constant (figure 11d). We find km s-1 or km s-1 yields a distribution for stars with that is statistically indistinguishable from the distribution for stars with . If the isochrone radii of stars with are also assumed to be too low, we find km s-1 or . Figure 11b shows how a correction of , together with a radius correction affects the frequencies inferred from for stars with . A systematic error of km s-1 is consistent at the level with the systematic uncertainty in of km s-1 estimated by Queloz et al. (1998). Differences between the young Pleiades stars and the older field stars used to calibrate the - relation could result in an even greater systematic error in . For example, Stauffer et al. (2003) showed that Pleiades stars do not have typical spectral energy distributions–in particular they have excess emission in the band (and are therefore bluer in than expected from their effective temperatures). Equation 14 may therefore underestimate the intrinsic broadening of Pleiades K dwarfs. Quantitatively, a mag shift in for Pleiades stars with yields an additional km s-1 shift in .
In conclusion, assuming that the radii are systematically underestimated by , and that the intrinsic broadening of these stars are also underestimated by km s-1, we find that the observed distribution of values would then be consistent with the model distribution for a differential rotation parameter of (the , , line in figure 10d). Allowing for a larger error in the intrinsic broadening would reduce the required . If we only apply the radius correction, the differential rotation parameter would need to be rather large (; the , line in figure 10d). We conclude that some combination of the above effects provides a plausible explanation for the large number of low-mass stars with measured .
Finally, we note that a qualitatively similar effect has also been noted by Jackson et al. (2009) for stars with in the comparably aged open cluster NGC 2516. They find that the radii of stars with must be larger than theoretical predictions for the and period data to be consistent in this cluster.
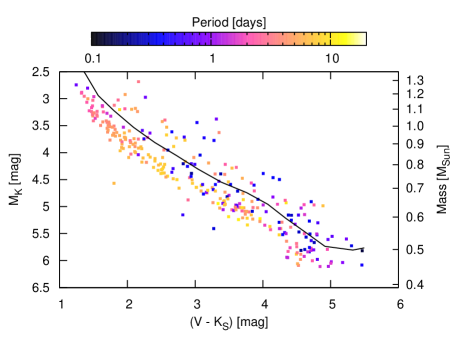
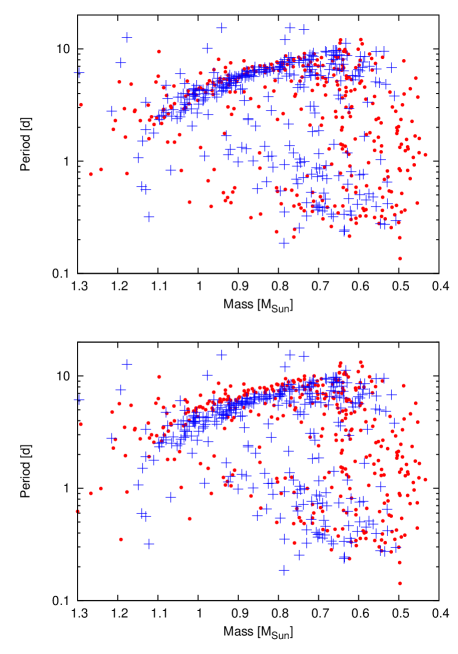
4.3 The Period-Mass Relation and Comparison to Other Clusters
Figure 12 shows the rotation period vs. absolute magnitude and mass, together with the relation between and absolute magnitude /mass. By comparing the values of stars without photometric period detections to the values of stars with period detections, it is apparent that over the mass range there does not appear to be a bias against detecting photometric periods for slow rotators. For star with there does appear to be a bias against detecting periods for the slowest rotators, so our sample is not complete in this mass range. For stars with the bias appears to be against detecting rapid rotators. This is likely due to short period stars being redder on average than long period stars (see Fig. 13 which demonstrates this for , this is likely to be true for as well), so that at fixed short period stars are fainter in than long period stars, and therefore have poorer precision HATNet light curves.
In figure 14 we compare the period-mass relation for the Pleiades to the relations for four other similarly aged clusters. These include 3 clusters studied by the MONITOR project (NGC 2547, Irwin et al., 2008, 40 Myr,; M50, Irwin et al., 2009, 130 Myr,; and NGC 2516, Irwin et al., 2007, 150 Myr,), and the cluster M35 (180 Myr, Meibom et al., 2009). For the MONITOR clusters we adopt the stellar masses given in their tables. For M35 we determine stellar masses using the extinction corrected -magnitudes given by Meibom et al. (2009) together with the Y2 isochrones. We assume an age of 180 Myr (Kalirai et al., 2003), distance of (Kalirai et al., 2003), and metallicity of (Schuler et al., 2003).
The data presented here can be combined with data for other open clusters to test theories of stellar angular momentum evolution. While a sophisticated analysis like that presented by Denissenkov et al. (2009) is beyond the scope of this paper, it is instructive to compare the Pleiades sample to M35. As seen in figure 15, the main period-mass sequences in the two clusters overlap, indicating that slow rotators with do not spin-down between and . We also show in figure 15 the substantial expected evolution between the two clusters for a standard solid-body rotation angular-momentum evolution model (e.g. Hartman et al., 2009a). While the slowly rotating stars do not spin-down between the ages spanned by the two clusters, more rapid rotators with do appear to have spun-down. These two features can be reproduced by models that invoke core-envelope decoupling with a coupling time-scale that depends on the rotation period, such that rapid rotators have a short coupling time-scale of a few Myr, while slow rotators have a long time-scale of (Bouvier, 2008; Denissenkov et al., 2009). As noted by Bouvier (2008), one consequence of slow rotators having a less efficient core-envelope coupling than rapid rotators is that slower rotators should exhibit more significant Li depletion than rapid rotators. Such an effect has been seen by Soderblom et al. (1993) for the Pleiades.


5 Summary
In this paper we have presented new rotation period measurements for stars in the Pleiades, increasing by a factor of 5 the number of stars in this cluster with measured periods. This includes newly identified probable cluster members. The sample is complete for stars with . By comparing our sample to the large sample of Pleiades stars with measurements in the literature, we find that our sample is not biased toward short periods over this same mass range.
We show that for stars with the inferred distribution of values is consistent with the stars having an isotropic distribution of rotation axes at the level, the agreement between the model and observations is even better if a differential rotation law is assumed; a differential law of this form is consistent with theoretical expectations for zero-age main sequence stars. This result is consistent with the findings of Jackson & Jeffries (2010). For stars with the inferred values are systematically larger than 1, and is similar to what was seen by Jackson et al. (2009) for stars in NGC 2516. Our observations imply that the combination is too large by . We argue that a systematic error in the radii of these stars, together with a km s-1 systematic error in the assumed intrinsic broadening of their spectral lines, and a differential rotation law provides a plausible explanation for this discrepency.
Finally, we find that the mass-period diagram for the Pleiades is remarkably similar to that seen by Meibom et al. (2009) for the cluster M35. In particular there appears to be very little change in the rotation rates of the slowest rotators with between the ages of these clusters. This result provides support for claims that these stars have inefficient internal angular momentum transport, and exhibit significant core-envelope decoupling.
Acknowledgments
HATNet operations have been funded by NASA grants NNG04GN74G, NNX08AF23G and SAO IR&D grants. G.Á.B. acknowledges support from the Postdoctoral Fellowship of the NSF Astronomy and Astrophysics Program (AST-0702843). G.K. thanks the Hungarian Scientific Research Foundation (OTKA) for support through grant K-81373. This research has made use of the SIMBAD database, operated at CDS, Strasbourg, France. This research has made use of the VizieR catalogue access tool, CDS, Strasbourg, France. This research has made use of the WEBDA database, operated at the Institute for Astronomy of the University of Vienna. This research has made use of the NASA/ IPAC Infrared Science Archive, which is operated by the Jet Propulsion Laboratory, California Institute of Technology, under contract with the National Aeronautics and Space Administration.
References
- An et al. (2007) An, D., Terndrup, D. M., Pinsonneault, M. H., Paulson, D. B., Hanson, R. B., & Stauffer, J. R. 2007, ApJ, 655, 233
- Bakos et al. (2004) Bakos, G., Noyes, R. W., Kovács, G., Stanek, K. Z., Sasselov, D. D., & Domsa, I. 2004, PASP, 116, 266
- Bakos et al. (2010) Bakos, G. Á., et al. 2010, ApJ, 710, 1724
- Baraffe et al. (1998) Baraffe, I., Chabrier, G., Allard, F., & Hauschildt, P. H. 1998, A&A, 337, 403
- Barnes (2007) Barnes, S. A. 2007, ApJ, 669, 1167
- Bilir et al. (2008) Bilir, S., Ak, S., Karaali, S., Cabrera-Lavers, A., Chonis, T. S., & Gaskell, C. M. 2008, MNRAS, 384, 1178
- Bouvier et al. (1998) Bouvier, J., Stauffer, J. R., Martín, E. L., Barrado y Navascués, D., Wallace, B., & Béjar, V. J. S. 1998, A&A, 336, 490
- Bouvier (2008) Bouvier, J. 2008, A&A, 489, L53
- Brown et al. (2004) Brown, B. P., Browning, M. K., Brun, A. S., & Toomre, J. 2004, in Proc. SOHO 14/GONG 2004 Workshopp (ESA SP-559), Helio- and Asteroseismology: Towards a Golden Future, ed. D. Danesy (Noordwijk: ESA), 341
- Carpenter (2001) Carpenter, J. M. 2001, AJ, 121, 2851
- Chabrier et al. (2007) Chabrier, G., Gallardo, J., & Baraffe, I. 2007, A&A, 472, L17
- Clarke, MacDonald, & Owens (2004) Clarke, D., MacDonald, E. C., & Owens, S. 2004, A&A, 415, 677
- Collier Cameron et al. (2009) Collier Cameron, A., et al. 2009, MNRAS, 400, 451
- Deacon & Hambly (2004) Deacon, N., & Hambly, N. 2004, A&A, 416, 125
- Denissenkov et al. (2009) Denissenkov, P. A., Pinsonneault, M., Terndrup, D. M., & Newsham, G. 2009, ApJsubmitted, arXiv:0911.1121
- Fernandez et al. (2009) Fernandez, J., et al. 2009, ApJ, 701, 764
- Gray (1976) Gray, D. F. 1976, “The Observation and Analysis of Stellar Photospheres”, Wiley & Sons Inc (eds.), New York.
- Haro et al. (1982) Haro, G., Chavira, E., & Gonzalez, G. 1982, Bol. Inst. Tonantzintla, 3, 1
- Hartman et al. (2008b) Hartman, J. D., Gaudi, B. S., Holman, M. J., McLeod, B. A., Stanek, K. Z., Barranco, J. A., Pinsonneault, M. H., & Kalirai, J. S. 2008, ApJ, 675, 1254
- Hartman et al. (2009a) Hartman, J. D., et al. 2009a, ApJ, 691, 342
- Hartman et al. (2009b) Hartman, J. D., et al. 2009b, AJ, submitted, arXiv:0907.2924
- Høg et al. (2000) Høg, E., et al. 2000, A&A, 355, L27
- Irwin et al. (2007) Irwin, J., Hodgkin, S., Aigrain, S., Hebb, L., Bouvier, J., Clarke, C., Moraux, E., & Bramich, D. M. 2007, MNRAS, 377, 741
- Irwin et al. (2008) Irwin, J., Hodgkin, S., Aigrain, S., Bouvier, J., Hebb, L., & Moraux, E. 2008, MNRAS, 383, 1588
- Irwin et al. (2009) Irwin, J., Aigrain, S., Bouvier, J., Hebb, L., Hodgkin, S., Irwin, M., & Moraux, E. 2009, MNRAS, 392, 1456
- Irwin & Bouvier (2009) Irwin, J., & Bouvier, J. 2009, IAU Symposium, 258, 363
- Jackson et al. (2009) Jackson, R. J., Jeffries, R. D., & Maxted, P. F. L. 2009, MNRAS, 399, L89
- Jackson & Jeffries (2010) Jackson, R. J., & Jeffries, R. D. 2010, MNRAS, 402, 1380
- James et al. (2010) James, D. J., et al. 2010, A&A, in press, arXiv:1004.0047
- Jeffries et al. (2009) Jeffries, R. D., Jackson, R. J., James, D. J., & Cargile, P. A. 2009, MNRAS, 400, 317
- Kalirai et al. (2003) Kalirai, J. S., Fahlman, G. G., Richer, H. B., & Ventura, P. 2003, AJ, 126, 1402
- Kawaler (1988) Kawaler, S. D. 1988, ApJ, 333, 236
- Kenyon & Hartmann (1995) Kenyon, S. J., & Hartmann, L. 1995, ApJS, 101, 117
- Kitchatinov (2005) Kitchatinov, L. L. 2005, Phys.-Usp., 48, 449
- Königl (1991) Königl, A. 1991, ApJ, 333, 236
- Kovács, Bakos & Noyes (2005) Kovács, G., Bakos, G., & Noyes, R. W. 2005, MNRAS, 356, 557
- Krishnamurthi et al. (1998) Krishnamurthi, A., et al. 1998, ApJ, 493, 914
- Lomb (1976) Lomb, N. R. 1976, A&SS, 39, 447
- Mamajek & Hillenbrand (2008) Mamajek, E. E., & Hillenbrand, L. A. 2008, ApJ, 687, 1264
- Marilli, Catalano & Frasca (1997) Marilli, E., Catalano, S., & Frasca, A. 1997, MmSAI, 68, 895
- Matt & Pudritz (2005) Matt, S., & Pudritz, R. E. 2005, ApJ, 632, L135
- Matt & Pudritz (2008a) Matt, S., & Pudritz, R. E. 2008a, ApJ, 678, 1109
- Matt & Pudritz (2008b) Matt, S., & Pudritz, R. E. 2008b, ApJ, 681, 391
- Mazzei & Piggato (1989) Mazzei, P., & Piggato, L. 1989, A&A, 213, L1
- Meibom et al. (2009) Meibom, S., Mathieu, R. D., & Stassun, K. G. 2009, ApJ, 695, 679
- Mermilliod (1981) Mermilliod, J. C. 1981, A&A, 97, 235
- Messina (2001) Messina, S. 2001, A&A, 371, 1024
- Monet et al. (2003) Monet, D. G., et al. 2003, AJ, 125, 984
- Pál & Bakos (2006) Pál, A., & Bakos, G. Á. 2006, PASP, 118, 1474
- Pál (2009) Pál, A. 2009, Ph.D. Thesis, Eötvös Loránd University, arXiv:0906.3486
- Press & Rybicki (1989) Press, W. H., & Rybicki, G. B. 1989, ApJ, 338, 277
- Press et al. (1992) Press, W. H., Teukolsky, S. A., Vetterling, W. T., & Flannery, B. P. 1992, Numerical Recipes in C, 2nd ed. (New York: Cambridge University Press)
- Prosser et al. (1993a) Prosser, C. F., Schild, R. E., Stauffer, J. R., & Jones, B. F. 1993a, PASP, 105, 269
- Prosser et al. (1993b) Prosser, C. F., et al. 1993b, PASP, 105, 1407
- Prosser et al. (1995) Prosser, C. F., et al. 1995, PASP, 107, 211
- Queloz et al. (1998) Queloz, D., Allain, S., Mermilliod, J.-C., Bouvier, J., & Mayor, M. 1998, A&A, 335, 183
- Röser et al. (2008) Röser, S., Schilbach, E., Schwan, H., Kharchenko, N. V., Piskunov, A. E., & Scholz, R.-D. 2008, A&A, 488, 401
- Samus et al. (2003) Samus, N. N., et al. 2003, Astronomy Letters, 29, 468
- Scargle (1982) Scargle, J. D. 1982, ApJ, 263, 835
- Schilbach et al. (1995) Schilbach, E., Robichon, N., Souchay, J., & Guibert, J. 1995, A&A, 299, 696
- Scholz & Eislöffel (2004) Scholz, A., & Eislöffel, J. 2004, A&A, 421, 259
- Schuler et al. (2003) Schuler, S. C., King, J. R., Fischer, D. A., Soderblom, D. R., & Jones, B. F. 2003, AJ, 125, 2085
- Shu et al. (1994) Shu, F., Najita, J., Ostriker, E., Wilkin, F., Ruden, S., & Lizano, S. 1994, ApJ, 429, 781
- Siess et al. (2000) Siess, L., Dufour, E., & Forestini, M. 2000, A&A, 358, 593
- Skrutskie et al. (2006) Skrutskie, M. F., et al. 2006, AJ, 131, 1163
- Skumanich (1972) Skumanich, A. 1972, ApJ, 171, 565
- Soderblom et al. (1993) Soderblom, D. R., Stauffer, J. R., Hudon, J. D., & Jones, B. F. 1993, ApJS, 85, 315
- Soderblom et al. (2005) Soderblom, D., Nelan, E., Benedict, G., McArthur, B., Ramirez, I., Spiesman, W., & Jones, B. 2005, AJ, 129, 161
- Soderblom et al. (2009) Soderblom, D. R., Laskar, T., Valenti, J. A., Stauffer, J. R., & Rebull, L. M. 2009, AJ, 138, 1292
- Stauffer et al. (1987) Stauffer, J. R., Schild, R. A., Baliunas, S. L., & Africano, J. L. 1987, PASP, 99, 471
- Stauffer et al. (1998) Stauffer, J. R., Schultz, G., & Kirkpatrick, J. D. 1998, ApJ, 499, L199
- Stauffer et al. (2003) Stauffer, J. R., Burton, F. J., Backman, D., Hartmann, L. W., Barrado y Navascués, D., Pinsonneault, M. H., Terndrup, D. M., & Muench, A. A. 2003, AJ, 126, 833
- Stauffer et al. (2007) Stauffer, J. R., et al. 2007, ApJS, 172, 663
- Sukhbold & Howell (2009) Sukhbold, T., & Howell, S. B. 2009, PASP, 121, 1188
- Terndrup et al. (1999) Terndrup, D. M., Krishnamurthi, A., Pinsonneault, M. H., & Stauffer, J. R. 1999, AJ, 118, 1814
- Terndrup et al. (2000) Terndrup, D. M., Stauffer, J. R., Pinsonneault, M. H., Sills, A., Yuan, Y., Jones, B. F., Fischer, D., & Krishnamurthi, A. 2000, AJ, 119, 1303
- van Leeuwen, Alphenaar, & Meys (1987) van Leeuwen, F., Alphenaar, P., & Meys, J. J. M. 1987, A&AS, 67, 483
- van Leeuwen (2009) van Leeuwen, F. 2009, A&A, 497, 209
- von Braun et al. (2009) von Braun, K., et al. 2009, IAU Symposium, 253, 478
- Walker et al. (2007) Walker, G. A. H., et al. 2007, ApJ, 659, 1611
- Yee & Jensen (2010) Yee, J. C., & Jensen, E. L. N. 2010, ApJ, 711, 303
- Yi et al. (2001) Yi, S. K., et al. 2001, ApJS, 136, 417
| ID | RAdeg | DEdeg | OtherID | Per | ePer | fwidth | rPer | rAmp | Bmag | Vmag | Kmag | Mass | Radius | vsini | rvsini | fbinary |
|---|---|---|---|---|---|---|---|---|---|---|---|---|---|---|---|---|
| J2000 | J2000 | d | d | d-1 | mag | mag | mag | mag | km s-1 | |||||||
| HAT-259-0003751 | 51.898273 | 24.528660 | DH001 | 7.26243656 | 0.00274337 | 0.00345 | 0.0194 | -9.99 | -9.99 | 9.892 | 0.791 | 0.692 | -99.990000 | |||
| HAT-214-0002419 | 52.203186 | 26.499350 | DH007 | 6.48431835 | 0.00001564 | 0.00211 | 0.0203 | -9.99 | -9.99 | 9.924 | 0.783 | 0.685 | -99.990000 | |||
| HAT-259-0003836 | 52.639614 | 26.215767 | DH011 | 4.81593936 | 0.00030922 | 0.00227 | 0.0787 | -9.99 | -9.99 | 10.279 | 0.702 | 0.613 | -99.990000 | |||
| HAT-259-0006363 | 52.799591 | 25.165100 | DH014 | 8.03366876 | 0.00103605 | 0.00250 | 0.0916 | -9.99 | -9.99 | 10.602 | 0.640 | 0.561 | -99.990000 | |||
| HAT-259-0009323 | 52.810955 | 25.981148 | DH015 | 2.41116752 | 0.00007308 | 0.00239 | 0.0590 | -9.99 | -9.99 | 11.091 | 0.551 | 0.511 | -99.990000 | |||
| HAT-259-0002998 | 52.824719 | 26.028849 | 6.37055838 | 0.00006763 | 0.00017 | 0.0839 | -9.99 | -9.99 | 10.037 | 0.756 | 0.660 | -99.990000 | ||||
| HAT-214-0001101 | 52.890076 | 26.265507 | PELS008,AKIII170 | 3.24215918 | 0.00016423 | 0.00242 | 0.0288 | 11.45 | 10.77 | 9.068 | 1.022 | 0.921 | 15.500000 | Q98 | ||
| HAT-259-0005281 | 53.001957 | 23.774900 | PELS109 | 8.36686239 | 0.00002128 | 0.00204 | 0.0601 | 15.27 | 13.95 | 10.520 | 0.655 | 0.573 | 5.500000 | Q98 | ||
| HAT-259-0004678 | 53.214275 | 25.579544 | DH023 | 2.08690706 | 0.00003688 | 0.00256 | 0.0848 | -9.99 | -9.99 | 10.323 | 0.693 | 0.605 | -99.990000 | |||
| HAT-259-0003433 | 53.251518 | 25.996056 | DH025 | 9.07804569 | 0.00003463 | 0.00215 | 0.0264 | -9.99 | -9.99 | 10.128 | 0.735 | 0.642 | -99.990000 |
| ID | RAdeg | DEdeg | OtherID | Nobs | RMS | Bmag | Vmag | Kmag | Mass | Radius | vsini | rvsini | fbinary |
|---|---|---|---|---|---|---|---|---|---|---|---|---|---|
| J2000 | J2000 | mag | mag | mag | mag | km s-1 | |||||||
| HAT-259-0000604 | 51.925262 | 23.803688 | PELS121 | 6047 | 0.01314 | 10.96 | 10.30 | 8.679 | 1.150 | 1.057 | 4.900000 | Q98 | |
| HAT-259-0001639 | 52.168613 | 25.607782 | AKIII59 | 6020 | 0.00581 | 12.59 | 11.75 | 9.723 | 0.832 | 0.732 | -99.990000 | ||
| HAT-259-0002068 | 52.409874 | 24.510546 | DH008 | 6055 | 0.02236 | -9.99 | -9.99 | 9.698 | 0.839 | 0.738 | -99.990000 | ||
| HAT-259-0001310 | 53.274277 | 22.134232 | PELS004,DH026,AKII131 | 6046 | 0.00632 | 12.25 | 11.43 | 9.425 | 0.911 | 0.809 | 2.600000 | Q98 | |
| HAT-259-0010017 | 53.293736 | 22.522045 | DH027 | 5983 | 0.04235 | -9.99 | -9.99 | 11.248 | 0.526 | 0.502 | -99.990000 | ||
| HAT-259-0000347 | 53.530495 | 24.344501 | PELS006,TrS4,AKIII288 | 6035 | 0.01747 | 10.08 | 9.57 | 8.274 | 1.309 | 1.247 | 35.900000 | Q98 | |
| HAT-259-0004453 | 53.684944 | 26.096003 | DH037 | 5977 | 0.03269 | -9.99 | -9.99 | 10.371 | 0.683 | 0.597 | -99.990000 | ||
| HAT-259-0000705 | 53.696770 | 26.094885 | PELS007,AKIII327 | 6009 | 0.00490 | 11.14 | 10.48 | 8.833 | 1.097 | 1.000 | 2.700000 | Q98 | |
| HAT-259-0000440 | 53.882030 | 22.823627 | PELS124 | 6050 | 0.01401 | 10.40 | 9.86 | 8.541 | 1.200 | 1.115 | 20.500000 | Q98 | |
| HAT-259-0001134 | 54.004112 | 24.266083 | AKIII391 | 6013 | 0.00495 | 12.06 | 11.29 | 9.388 | 0.922 | 0.820 | 2.300000 | Q98 |
| ID | RAdeg | DEdeg | Per | rAmp | Jmag | Hmag | Kmag |
|---|---|---|---|---|---|---|---|
| J2000 | J2000 | d | mag | mag | mag | mag | |
| HAT-213-0004432 | 46.376495 | 27.295223 | 1.47490588 | 0.0421 | 11.386 | 11.002 | 10.921 |
| HAT-213-0000301 | 46.395025 | 26.326672 | 0.49278549 | 0.0068 | 7.894 | 7.317 | 7.198 |
| HAT-213-0003310 | 46.423947 | 26.964050 | 0.51638485 | 0.0301 | 10.947 | 10.575 | 10.448 |
| HAT-258-0007599 | 46.452067 | 26.214544 | 0.80443471 | 0.0680 | 11.960 | 11.292 | 11.068 |
| HAT-258-0001512 | 46.545842 | 24.555460 | 1.56383216 | 0.0114 | 10.440 | 10.123 | 10.063 |
| HAT-213-0000501 | 46.549253 | 26.699934 | 1.02287839 | 0.0544 | 7.864 | 6.928 | 6.573 |
| HAT-258-0005170 | 46.567769 | 24.944794 | 7.96319798 | 0.0110 | 11.796 | 11.298 | 11.198 |
| HAT-213-0005056 | 46.574536 | 26.634954 | 6.48431835 | 0.0192 | 11.557 | 11.194 | 11.097 |
| HAT-258-0002836 | 46.593644 | 24.553173 | 0.12926165 | 0.0015 | 11.035 | 10.531 | 10.453 |
| HAT-213-0008723 | 46.597723 | 26.747597 | 0.61090482 | 0.0228 | 12.609 | 12.438 | 12.416 |
| ID | Period | Ref |
|---|---|---|
| d | ||
| BPL106 | 0.170000 | S04 |
| BPL115,DH476 | 0.121250 | S04 |
| BPL125,DH494 | 0.806250 | S04 |
| BPL138,DH505 | 1.075420 | S04 |
| BPL150 | 0.769167 | S04 |
| BPL164,DH544 | 0.840000 | S04 |
| CFHT-PL8 | 0.401000 | T71 |
| HCG20,T1B,DH105 | 2.700000 | K98 |
| HCG254,BPL129 | 0.401667 | S04 |
| HCG346,HHJ111,BPL190 | 1.677920 | S04 |