Exploring the Origin and Fate of the Magellanic Stream with Ultraviolet and Optical Absorption111Based on observations from the NASA-CNES-CSA Far Ultraviolet Spectroscopic Explorer mission (program P101), operated by Johns Hopkins University, supported by NASA contract NAS 5-32985, from the NASA/ESA Hubble Space Telescope (program 9802), obtained at the Space Telescope Science Institute, which is operated by the Association of Universities for Research in Astronomy, Inc., under NASA contract NAS 5-26555, and from the Ultraviolet and Visual Echelle Spectrograph (UVES) on the Very Large Telescope (VLT) Unit 2 (Kueyen) at Paranal, Chile, operated by the European Southern Observatory, under program ID 081.D-0697(A).
Abstract
We present an analysis of ionization and metal enrichment in the Magellanic Stream (MS), the nearest gaseous tidal stream, using HST/STIS and FUSE ultraviolet spectroscopy of two background AGN. The targets are NGC 7469, lying directly behind the MS with log (H I)MS=18.630.03(stat)0.08(syst), and Mrk 335, lying 24.7 away with log (H I)MS=16.670.05. For NGC 7469, we include optical spectroscopy from VLT/UVES. In both sightlines the MS is detected in low-ion (O I, C II, C III, Si II, Si III, Al II, Ca II) and high-ion (O VI, C IV, Si IV) absorption. Toward NGC 7469, we measure a MS oxygen abundance [O/H]MS=[O I/H I]=1.000.05(stat)0.08(syst), supporting the view that the Stream originates in the SMC rather than the LMC. We use CLOUDY to model the low-ion phase of the Stream as a photoionized plasma using the observed Si III/Si II and C III/C II ratios. Toward Mrk 335 this yields an ionization parameter log between 3.45 and 3.15, a gas density log (/cm-3) between 2.51 and 2.21, and a hydrogen ionization fraction of 98.9–99.5%. Toward NGC 7469 we derive sub-solar abundance ratios for [Si/O], [Fe/O], and [Al/O], indicating the presence of dust in the MS. The high-ion column densities are too large to be explained by photoionization, but also cannot be explained by a single-temperature collisional-ionization model (equilibrium or non-equilibrium). This suggests the high-ion plasma is multi-phase, with a Si IV region, a hotter O VI region, and C IV potentially contributing to each. Summing over the low-ion and high-ion phases, we derive conservative lower limits on the ratio (total H II)/(H I) of 19 toward NGC 7469 and 330 toward Mrk 335, showing that along these two directions the vast majority of the Stream has been ionized. The presence of warm-hot plasma together with the small-scale structure observed at 21 cm provides evidence for an evaporative interaction with the hot Galactic corona. This scenario, predicted by hydrodynamical simulations, suggests that the fate of the MS will be to replenish the Galactic corona with new plasma, rather than to bring neutral fuel to the disk.
Subject headings:
Galaxy: halo – Galaxy: evolution – ISM: clouds – ultraviolet: ISM – Magellanic Clouds1. Introduction
Gaseous inflow is a key process in galaxy evolution, serving to regulate chemical abundances and provide fuel for star formation. Without inflow, galactic chemodynamical models cannot reproduce observed stellar abundance patterns (Matteucci, 2001). In the case of the Milky Way, an average inflow rate of 1 yr-1 over the last 10 Gyr, and a present-day inflow rate of 0.4 yr-1, is needed to solve the G-dwarf problem, the anomalously narrow abundance distribution of nearby solar-type stars (Pagel & Patchett, 1975; Chiappini, 2008). Observationally, this infalling circumgalactic gas is seen in the form of high-velocity clouds (HVCs), defined as interstellar clouds having velocities incompatible with co-rotation with the disk (in practice meaning km s-1; Wakker & van Woerden, 1997; Richter, 2006). HVCs have been heralded as the solution to the G-dwarf problem (Wakker et al., 1999), since the mass inflow rate of neutral gas in HVCs is 0.1–0.4 yr-1 (Wakker et al., 2008; Peek et al., 2008). However, the role of ionization is not fully understood, and there are indications of a significant mass inflow rate in ionized gas (Bland-Hawthorn et al., 2007; Shull et al., 2009), and for a large population of low (H I) HVC fragments across the entire sky (Sembach et al., 2003; Collins et al., 2005, 2009; Fox et al., 2006; Richter et al., 2009).
The Magellanic Stream (MS) is a large and well-resolved HVC, and the nearest gaseous tidal stream. A broad filament of 21 cm-emitting gas extending for on either side of the South Galactic Pole (Wannier & Wrixon, 1972; Mathewson et al., 1974, 1977; Putman et al., 2003a; Braun & Thilker, 2004; Brüns et al., 2005) and containing M⊙ of neutral gas, the MS is thought to have been stripped out of the Magellanic Clouds by either ram pressure or tidal forces. This origin is supported by HST measurements of the MS metallicity (=0.2–0.4 solar; Lu et al., 1994, 1998; Gibson et al., 2000; Sembach et al., 2001), and many orbital simulations (Moore & Davis, 1994; Lin et al., 1995; Gardiner & Noguchi, 1996; Mastropietro et al., 2005; Connors et al., 2006), though it is unclear whether the LMC or the SMC is the primary source of the Stream’s material (Nidever et al., 2008).
Like many (if not all) HVCs, the MS is a multi-phase structure, containing regions of molecular gas seen in H2 absorption (Richter et al., 2001), cold neutral (Ben Bekhti et al., 2006; Matthews et al., 2009) and warm neutral (Brüns et al., 2005; Kalberla & Haud, 2006) gas seen in 21 cm emission, warm-ionized plasma seen in H emission ( K; Weiner & Williams, 1996; Putman et al., 2003b) and UV absorption (Lu et al., 1994), and highly-ionized plasma seen in O VI absorption ( K; Sembach et al., 2003; Fox et al., 2005a). Many UV studies (Sembach et al., 1995, 1999; Collins et al., 2004, 2005; Fox et al., 2004, 2005a; Ganguly et al., 2005; Zech et al., 2008) have led to the consensus that the high ions (O VI, C IV, Si IV) in HVCs trace the boundary layers between the warm cloud cores (seen in H I and the low ions) and a surrounding hot medium. Various theoretical models have been proposed to explain such boundary layers, including conductive interfaces (Böhringer & Hartquist, 1987; Borkowski et al., 1990; Gnat et al., 2010), turbulent mixing layers generated by Kelvin-Helmholtz instabilities (Slavin et al., 1993; Esquivel et al., 2006), and shock ionization (Dopita & Sutherland, 1996; Indebetouw & Shull, 2004), which all relate to the interaction between HVCs and the hot coronal plasma (Ferrara & Field, 1994; Murali, 2000; Quilis & Moore, 2001; Konz et al., 2001; Murray & Lin, 2004).
Recent simulations have examined the lifetime of HVCs against disruption by these cloud/corona interactions. Bland-Hawthorn (2009) find HVC lifetimes against break up by thermal instability of 60–180 Myr, which for a typical HVC velocity of 200 km s-1 corresponds to distances of 12–36 kpc. In the simulations of Heitsch & Putman (2009), infalling HVCs with H I masses M⊙ become fully ionized by Kelvin-Helmholtz instabilities within 10 kpc. Although the total 21 cm mass in the MS is several orders of magnitude larger than this (Brüns et al., 2005), the Stream is known to be fragmented into smaller clumps (Stanimirović et al., 2002, 2008; Westmeier & Koribalski, 2008; Nigra et al., 2009), suggesting that a disruptive interaction with the ambient hot corona is already underway.
Understanding ionization in HVCs is crucial to assess their role in Galactic evolution (Maller & Bullock, 2004). If an HVC becomes fully ionized before reaching the disk, it will not provide fuel for future star formation unless it stays bound, cools, and recombines within the inflow timescale (few yr). If instead a cloud “evaporates” before reaching the disk666By “evaporation” we refer to the process(es) by which gas is stripped from an HVC and becomes incorporated into the surrounding hot plasma; this is different from “ionization”, since a cloud can be ionized without being evaporated. it will simply serve to replenish the hot corona with new material. Determining the ionization level empirically in a nearby massive HVC (the MS) is the focus of this paper. We also demonstrate the ability of UV absorption lines to probe and characterize low column density regions of the MS.
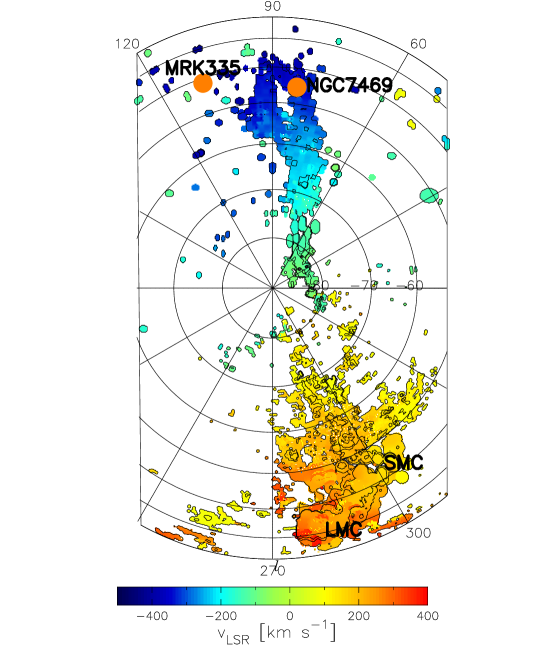
UV studies of the MS have been hampered by a shortage of suitable UV-bright background targets. MS absorption detections have been reported toward Fairall 9 behind the MS proper (Songaila, 1981; Lu et al., 1994; Gibson et al., 2000; Richter et al., 2001), NGC 3783 behind the leading arm of the Stream (Lu et al., 1998; Sembach et al., 2001), III Zw 2 and NGC 7469 (both near the outer 21 cm contour of the MS; Gibson et al., 2000), and HE 0226–4110 (11 away from the 21 cm emission; Fox et al., 2005a). In addition, high-velocity absorption reported toward NGC 1705 (Sahu, 1998) may trace an outer fragment of the MS. Other targets are available behind the Magellanic Bridge connecting the LMC and SMC (Lehner et al., 2001, 2008; Smoker et al., 2005; Misawa et al., 2009), but this is usually considered separately from the MS. Here we present new UV observations of two sight lines in the vicinity of the MS: (1) NGC 7469, also known as QSO B2300+086 and Mrk 1514, a Seyfert 1 Galaxy at =83.10,45.47 lying behind the MS, but close to the outer 21 cm contour, with a MS log (H I)18.63 (see §4.1), and (2) Mrk 335, also known as QSO B0003+199, a Seyfert 1 Galaxy at =108.76,41.42 lying 24.9 away from NGC 7469 in a direction with no MS 21 cm emission detected, even in the most sensitive H I observations (which reach log (H I)17.5; Braun & Thilker, 2004). The location of these two targets relative to the 21 cm emission from the MS is shown in Figure 1.
This paper is organized as follows. In §2 we discuss the data origin and handling. In §3 we discuss the spectroscopic measurements, and in §4 an overview of the MS absorption is presented. In §5 we derive the metallicity of the MS. In §6 and §7 we present photo-ionization models (for the low ions) and collisional ionization models (for the high ions), respectively. In §8 we discuss the relative amounts of neutral and ionized gas in the MS, and the implications for the fate of the Stream. Our results are summarized in §9.
2. Observations and Data Handling
NGC 7469 and Mrk 335 were observed using the E140M echelle grating of the Space Telescope Imaging Spectrograph (STIS; Woodgate et al., 1998; Kimble et al., 1998; Bowers et al., 1998), which provides high-resolution (7.0 km s-1 FWHM) spectra in the range 1150–1700 Å. These observations were taken in 2004 during HST Cycle 12 under proposal ID 9802, using the 0.20.06″ aperture and the FUV-MAMA detectors in ACCUM mode for total exposure times of 22 810 s (NGC 7469) and 17 105 s (Mrk 335). The calibrated STIS data were retrieved from the HST MAST archive, having been processed with the CalSTIS pipeline (v2.19; Dressel et al., 2007). The relative wavelength calibration of STIS is accurate to 0.1–0.4 pixels, with an absolute calibration accurate to 0.2–0.5 pixels, or 0.6–1.6 km s-1 (Kim Quijano et al., 2007). These data were rebinned to three pixels (i.e. to 9.6 km s-1 bins) for display purposes, but all measurements were made on the unbinned data.
NGC 7469 and Mrk 335 were observed in 2000 and 2001 with the Far Ultraviolet Spectroscopic Explorer (FUSE) satellite (Moos et al., 2000; Sahnow et al., 2000), providing medium-resolution spectra (20–25 km s-1 FWHM) in the far-ultraviolet range 912–1187 Å in two channels (using LiF and SiC coatings). These observations were taken during FUSE Cycle 1 under proposal ID P101, and used the LWRS aperture for total exposure times of 37 630 s (NGC 7469) and 99 284 s (Mrk 335). The raw FUSE data were processed with version 2.4.0 of the CalFUSE pipeline (Dixon et al., 2007), following the data reduction procedures described in Wakker et al. (2003), which involve measuring the centroids of various atomic (Ar I, O I, Si II) and molecular (H2) interstellar lines in each segment of each exposure, applying offsets to bring them onto the same (LSR) velocity scale as the STIS observations, and then co-adding the aligned spectra. The reduced FUSE data have an absolute wavelength calibration accurate to 5–10 km s-1, and were rebinned to five pixels (i.e. to 10.0 km s-1 bins) for display purposes.
Fortuitously, a Type Ia supernova (SN 2008ec) was discovered in NGC 7469 on 14 July 2008 at position RA=23h03m16.56s, Dec=+0852′19.8″ (J2000; Rex et al., 2008), 6.5″ away from the center of the FUSE pointing. This event was observed with the UVES high-resolution optical spectrograph (Dekker et al., 2000) mounted on the 8.2 m Kueyen unit of the Very Large Telescope (VLT) at Cerro Paranal, Chile, under ESO program ID 081.D-0697(A). Three epochs of observation were taken on 26 July 2008, 9 August 2008, and 26 August 2008 using the Dichroic 1 390+564 setting, a 1.0″ slit, and 11 binning, all at low airmass (1.2–1.3). These optical data allow us to search for Ca II 3934.777, 3969.591 and Na I 5891.583, 5897.558 absorption in the MS. The spectra were extracted from the ESO archive and reduced using the UVES pipeline (Ballester et al., 2000) in the ESOREX environment. Because of fading of the supernova, the S/N of the second- and third-epoch spectra is lower, so only some of the individual exposures were combined (using median combining) to form our final spectrum. In the blue arm (390 nm setting) we used only the first-epoch exposures (61 800 s). In the red arm (564 nm setting), we used 31 800 s from the first epoch and a total of 20 400 s from the second epoch. These UVES data have a spectral resolution of 40 000 or 7.5 km s-1(FWHM), and were rebinned to two pixels (2.2 km s-1 bins) for display and measurement.
We also make use of 21 cm H I emission-line spectra, to constrain (H I) in the MS along each line of sight. Spectra from several radio telescopes are available, including the Green Bank 140 foot telescope, Green Bank 100 m Telescope (GBT), the Effelsberg 100 m telescope, and the Leiden-Argentine-Bonn Survey (Kalberla et al., 2005). The choice of dataset used for each sightline is discussed in §4.1 and 4.2.
All wavelengths and velocities in this paper are presented relative to the Local Standard of Rest (LSR), as defined by Kerr & Lynden-Bell (1986); the corrections from the heliocentric frame are =+6.0 km s-1 for NGC 7469 and =+3.3 km s-1 for Mrk 335. For all absorption-line data (STIS, FUSE, and UVES), continua were fitted locally around each line of interest, using polynomial fits to spectral regions several hundred km s-1 wide, and the data were normalized by the continuum.
3. Measurement of Absorption
High-negative-velocity ( km s-1) absorption is present in the spectra of both NGC 7469 and Mrk 335 in a range of low-ion and high-ion lines. Two techniques were used to measure the HV absorption: Voigt-profile fitting and apparent optical depth (AOD) measurements. These measurements are described in the next two sub-sections, yielding the results presented in Table 1 (for NGC 7469) and Table 2 (for Mrk 335). Rest wavelengths and oscillator strengths were taken from Morton (2003, 2004). Signal-to-noise measurements were made locally near each line, by measuring the r.m.s. dispersion of the data around the continuum in regions 100 km s-1 wide.
| AOD Resultscc Upper limits on and log for non-detections (lines not detected at 3 significance) are calculated as (actual)+3 (e.g. if =2010 mÅ we quote 50 mÅ). Lower limits are for saturated lines. Errors on and log include both statistical and continuum placement uncertainties (and 6 mÅ fixed pattern noise for FUSE lines). When a component is not detected in multiple lines of a particular ion, only the strongest constraint on log is given.
|
VPFIT Resultsdd All lines of a given ion were fitted simultaneously, so VPFIT results are presented only once per ion. Two MS components were fitted for C II, O I, Si II, Si III, Al II, and C IV.
|
|||||||
|---|---|---|---|---|---|---|---|---|
| Line | S/Naa Signal-to-noise ratio per resolution element in continuum next to line.
|
Componentbb AOD measurements were made separately in each HVC component, using the following LSR velocity ranges. MS: 400 to 265 km s-1; HVC1: 265 to 220 km s-1; HVC2: 220 to 130 km s-1. For certain lines/components, the velocity ranges were slightly adjusted to avoid contamination or addition of noise, as follows: Fe II 1144 and Fe III 1122, MS, 350 to 265 km s-1; Fe II 1608, MS, 350 to 300 km s-1; Ca II 3934,3969, MS, 360 to 300 km s-1; N V 1238,1242, HVC2, 200 to 150 km s-1.
|
log | log | log (tot)ee Total VPFIT column density, summed over all fitted HVC components, with errors added in quadrature.
|
|||
| (mÅ) | ( in cm-2) | (km s-1) | (km s-1) | ( in cm-2) | ( in cm-2) | |||
| C II 1334.532gg No measurement of HVC absorption in C II 1036.337 made due to contamination with Galactic H2 1035.183 and 1035.427.
|
16 | MS | 292 | 14.49 | 3601 | 234 | 14.010.05 | 14.450.04 |
| 3301 | 132 | 14.190.05 | ||||||
| HVC1 | 316 | 13.250.07 | 2512 | 113 | 13.250.08 | |||
| HVC2 | 44 | 13.34 | 1842 | 54 | [12.900.13]ff VPFIT conducted even though absorption in this component not detected at 3 significance; results uncertain.
|
|||
| Si II 1260.422hh No measurement of Si II 1260.422 made in HVC1 or HVC2 due to contamination with Galactic S II 1259.519.
|
30 | MS | 251 | 13.51 | 3682 | 134 | 13.160.08 | 13.600.04 |
| 3351 | 102 | 13.410.05 | ||||||
| Si II 1193.290 | 10 | MS | 17617 | 13.640.05 | ||||
| Si II 1526.707 | 12 | MS | 7316 | 13.560.08 | ||||
| Si II 1304.370 | 21 | MS | 4710 | 13.590.08 | ||||
| Si II 1190.416 | 9 | MS | 15217 | 13.840.05 | ||||
| Si III 1206.500 | 14 | MS | 404 | 13.82 | ii Si III 1206.500 saturated in MS component; no reliable fit possible.
|
ii Si III 1206.500 saturated in MS component; no reliable fit possible.
|
ii Si III 1206.500 saturated in MS component; no reliable fit possible.
|
ii Si III 1206.500 saturated in MS component; no reliable fit possible.
|
| HVC1 | 55 | 12.81 | 2481 | 42 | 12.870.45 | |||
| HVC2 | 5213 | 12.560.08 | 1782 | 123 | 12.530.08 | |||
| O I 1302.168 | 23 | MS | 10710 | 14.320.04 | 3641 | 66 | 13.690.09 | 14.290.04 |
| 3371 | 82 | 14.170.05 | ||||||
| HVC1 | 24 | 13.51 | ||||||
| HVC2 | 31 | 13.63 | ||||||
| N I 1199.550 | 14 | MS | 57 | 13.54 | ||||
| HVC1 | 47 | 13.45 | ||||||
| HVC2 | 53 | 13.50 | ||||||
| Al II 1670.787 | 18 | MS | 11020 | 12.460.07 | 36414 | 205 | 12.020.19 | 12.450.12 |
| 3274 | 156 | 12.250.14 | ||||||
| HVC1 | 57 | 12.09 | ||||||
| HVC2 | 93 | 12.30 | ||||||
| Fe II 1144.939 | 29 | MS | 41 | 13.51 | 3401 | 124 | [13.190.07]ff VPFIT conducted even though absorption in this component not detected at 3 significance; results uncertain.
|
13.190.07 |
| HVC1 | 26 | 13.31 | ||||||
| HVC2 | 31 | 13.39 | ||||||
| Fe II 1608.451 | 10 | MS | 62 | 13.70 | ||||
| Fe III 1122.526 | 24 | MS | 53 | 13.94 | 3212 | 164 | [13.630.05]ff VPFIT conducted even though absorption in this component not detected at 3 significance; results uncertain.
|
13.630.05 |
| HVC1 | 30 | 13.70 | ||||||
| S II 1259.519 | 26 | MS | 20 | 13.94 | ||||
| HVC1 | 12 | 13.71 | ||||||
| Ca II 3934.777 | 86 | MS | 233 | 11.430.05 | 3341 | 72 | 11.400.05 | 11.400.05 |
| HVC1 | 11 | 11.08 | ||||||
| HVC2 | 11 | 11.10 | ||||||
| Ca II 3969.591 | 100 | MS | 143 | 11.490.08 | ||||
| Na I 5891.583 | 61 | MS | 25 | 11.12 | ||||
| HVC1 | 11 | 10.74 | ||||||
| HVC2 | 15 | 10.88 | ||||||
| C IV 1548.205 | 15 | MS | 2979 | 14.020.02 | 3292 | 473 | 14.020.03 | 14.240.03 |
| 2943 | 44 | 12.690.28 | ||||||
| HVC1 | 706 | 13.360.04 | 2491 | 82 | 13.210.08 | |||
| HVC2 | 1429 | 13.750.03 | 1821 | 122 | 13.660.04 | |||
| C IV 1550.778 | 23 | MS | 18910 | 14.060.03 | ||||
| HVC1 | 53 | 13.41 | ||||||
| HVC2 | 7613 | 13.700.07 | ||||||
| Si IV 1393.755 | 13 | MS | 15011 | 13.330.03 | 3272 | 283 | 13.270.04 | 13.430.03 |
| HVC1 | 287 | 12.570.10 | 2502 | 93 | 12.560.10 | |||
| HVC2 | 3910 | 12.760.09 | 1831 | 63 | 12.690.07 | |||
| Si IV 1402.770 | 14 | MS | 6110 | 13.200.06 | ||||
| HVC1 | 20 | 12.64 | ||||||
| HVC2 | 26 | 12.76 | ||||||
| N V 1238.821 | 20 | MS | 13 | 12.78 | ||||
| HVC1 | 10 | 12.66 | ||||||
| HVC2 | 15 | 12.83 | 1773 | 106 | [12.630.18]ff VPFIT conducted even though absorption in this component not detected at 3 significance; results uncertain.
|
12.630.18 | ||
| O VI 1031.926jj No measurement of O VI 1031.926 made in HVC1 or HVC2 due to contamination with Galactic H2 1031.193.
|
24 | MS | 11910 | 14.090.03 | 333 9 | 3110 | 13.950.16 | 13.950.16 |
| AOD Resultscc Upper limits on and log for non-detections (lines not detected at 3 significance) are calculated as (actual)+3 (e.g. if =2010 mÅ we quote 50 mÅ). Lower limits are for saturated lines. Errors on and log include both statistical and continuum placement uncertainties (and 6 mÅ fixed pattern noise for FUSE lines). When a component is not detected in multiple lines of a particular ion, only the strongest constraint on log is given.
|
VPFIT Resultsdd All lines of a given ion were fitted simultaneously, so VPFIT results are presented only once per ion. Two HVC3 components and two MS components were fitted for Si III. Two HVC4 components were fitted for C IV.
|
|||||||
|---|---|---|---|---|---|---|---|---|
| Line | S/Naa Signal-to-noise ratio per resolution element in continuum next to line.
|
Componentbb AOD measurements were made separately in each HVC component, using the following LSR velocity ranges. HVC3: 450 to 360 km s-1; MS: 360 to 270 km s-1; HVC4: 270 to 190 km s-1. HVC4 is only seen in Si III, Si IV, C IV, and O VI (blended). For certain lines/components, the velocity ranges were slightly adjusted to avoid contamination or addition of noise, as follows: Fe II 1144, HVC3, 420 to 360 km s-1; Si II 1260, 1193 and C II 1334, MS, 360 to 315 km s-1.
|
log | log | log (tot)ee Total VPFIT column density, summed over all fitted HVC components, with errors added in quadrature.
|
|||
| (mÅ) | ( in cm-2) | (km s-1) | (km s-1) | ( in cm-2) | ( in cm-2) | |||
| H I 923.150 | 14 | MS | 219 | 16.49 | 3412 | 582ii Large -value indicates unresolved sub-structure may be present.
|
16.670.05 | 16.670.05 |
| H I 920.963 | 14 | MS | 197 | 16.55 | ||||
| C II 1334.532gg No measurement of HVC absorption in C II 1036.337 made due to contamination with Galactic H2 1035.183 and 1035.427.
|
15 | HVC3 | 6011 | 13.540.07 | 4151 | 82 | 13.180.04 | 13.680.02 |
| MS | 517 | 13.510.06 | 3321 | 122 | 13.510.03 | |||
| C III 977.020hh No measurement of C III 977.020 made in HVC4 due to contamination with Galactic O I 976.448. Velocity centroids of the two MS C III components tied to those of Si III during fit.
|
11 | HVC3 | 13210 | 13.480.03 | 4076 | 315 | 13.300.12 | 14.120.05 |
| MS | 249 | 14.00 | 3401 | 3712 | 13.510.15 | |||
| 3031 | 363 | 13.900.04 | ||||||
| Si II 1260.422 | 23 | HVC3 | 397 | 12.500.07 | 4262 | 144 | 12.400.10 | 12.740.06 |
| MS | 355 | 12.490.06 | 3391 | 92 | 12.480.08 | |||
| Si II 1193.290 | 6 | HVC3 | 108 | 13.23 | ||||
| MS | 61 | 12.98 | ||||||
| Si III 1206.500 | 12 | HVC3 | 105 | 12.69 | 4211 | 55 | [12.470.61]ff VPFIT conducted even though absorption in this component not detected at 3 significance; results uncertain.
|
13.260.46 |
| 3892 | 83 | 12.230.15 | ||||||
| MS | 14615 | 13.010.06 | 3362 | 184 | 12.740.08 | |||
| 3002 | 93 | 12.630.10 | ||||||
| HVC4 | 78 | 12.56 | 2494 | 33 | [12.561.00]ff VPFIT conducted even though absorption in this component not detected at 3 significance; results uncertain.
|
|||
| O I 1302.168 | 14 | HVC3 | 51 | 13.84 | ||||
| MS | 39 | 13.73 | ||||||
| N I 1199.550 | 7 | HVC3 | 73 | 13.64 | ||||
| MS | 60 | 13.56 | ||||||
| Al II 1670.787 | 7 | HVC3 | 90 | 12.29 | ||||
| MS | 125 | 12.43 | ||||||
| Fe II 1144.939 | 50 | HVC3 | 25 | 13.30 | ||||
| MS | 25 | 13.30 | ||||||
| Fe III 1122.526 | 51 | HVC3 | 24 | 13.60 | ||||
| MS | 33 | 13.73 | ||||||
| S II 1259.519 | 18 | HVC3 | 30 | 14.13 | ||||
| MS | 33 | 14.17 | ||||||
| C IV 1548.205 | 10 | HVC3 | 65 | 13.21 | ||||
| MS | 12018 | 13.570.07 | 2943 | 285 | 13.550.07 | 13.860.05 | ||
| HVC4 | 12917 | 13.650.06 | 2501 | 82 | 13.380.09 | |||
| 2104 | 177 | 13.110.14 | ||||||
| C IV 1550.778 | 6 | HVC3 | 70 | 13.54 | ||||
| MS | 112 | 13.74 | ||||||
| HVC4 | 107 | 13.72 | ||||||
| Si IV 1393.755 | 9 | HVC3 | 84 | 12.97 | ||||
| MS | 4916 | 12.800.12 | 31511 | 3619 | 12.720.18 | 12.970.13 | ||
| HVC4 | 82 | 12.96 | 2384 | 157 | [12.610.15]ff VPFIT conducted even though absorption in this component not detected at 3 significance; results uncertain.
|
|||
| Si IV 1402.770 | 10 | HVC3 | 48 | 13.02 | ||||
| MS | 51 | 13.04 | ||||||
| HVC4 | 39 | 12.93 | ||||||
| N V 1238.821 | 13 | HVC3 | 29 | 13.13 | ||||
| MS | 28 | 13.12 | ||||||
| O VI 1031.926jj No measurement of O VI 1031.926 made in HVC4 due to contamination with Galactic H2 1031.193.
|
46 | HVC3 | 24 | 13.29 | ||||
| MS | 747 | 13.840.02 | 2922 | 613ii Large -value indicates unresolved sub-structure may be present.
|
14.030.02 | 14.030.02 | ||
3.1. Voigt-Profile Fitting
The VPFIT software777Available at http://www.ast.cam.ac.uk/rfc/vpfit.html. was used to fit Voigt profiles to all lines showing MS detections, yielding the column densities, line widths, and velocity centroids of absorption. The code acts simultaneously on multiple lines from the same species (e.g. doublets), and accounts for instrumental broadening by convolving the model spectra with the instrumental line spread function (LSF) during the fit. The LSF is assumed to be Gaussian, with FWHM=20 km s-1 for FUSE, 7.0 km s-1 for STIS/E140M, and 7.5 km s-1 for VLT/UVES. The number of components to fit has to be specified manually. With one exception (for Si II and Si III toward NGC 7469; see §4.1) we did not tie components together between different species, since a priori it is not known which species co-reside in the same volumes. The total VPFIT column density presented for each ion is a straight summation across all HVC components. The VPFIT errors presented in Tables 1 and 2 represent the statistical uncertainties only, and not continuum placement uncertainties or the systematic errors associated with fitting simple Voigt profiles to complex velocity structures.
3.2. Apparent Optical Depth (AOD) Measurements
The AOD method (Savage & Sembach, 1991; Sembach & Savage, 1992; Jenkins, 1996) is a technique used to derive column densities within a specified velocity range to . The results are accurate provided the lines are resolved and unsaturated, and that the data have S/N8 (Fox et al., 2005b). Unresolved saturation can be difficult to detect (affecting both VPFIT and AOD measurements). The velocity ranges were determined by visual inspection of the data, finding the velocities where the flux recovers to the continuum on either side of the HVC absorption components. The AOD in each pixel is defined by =ln , where and are the observed flux and the estimated continuum flux, respectively. The total AOD is given by , and the apparent column density . Both continuum errors and statistical errors are included in the error analysis, and for lines measured in FUSE data, a fixed pattern noise of 6 mÅ was added in quadrature. We adopt the AOD column densities for use in the rest of the paper, since they are less sensitive to the choice of components and have a more thorough error analysis, though a comparison of the VPFIT and AOD column densities shows generally consistent results (see Tables 1 and 2).
For non-detections, i.e. cases where there is no absorption present at 3 significance in the chosen velocity range, we determined the 3 equivalent width limit; for example, if a measurement found =2010 mÅ, we adopted mÅ (since this is the largest value that can take, at 99.7% significance). We then converted into a 3 limit on the column density assuming a linear curve-of-growth. For saturated lines, which in practice we define as those where the normalized flux falls below 0.05 at any point in the line profile, we take the returned AOD value of but treat it as a lower limit.
4. Overview of Magellanic Stream Absorption
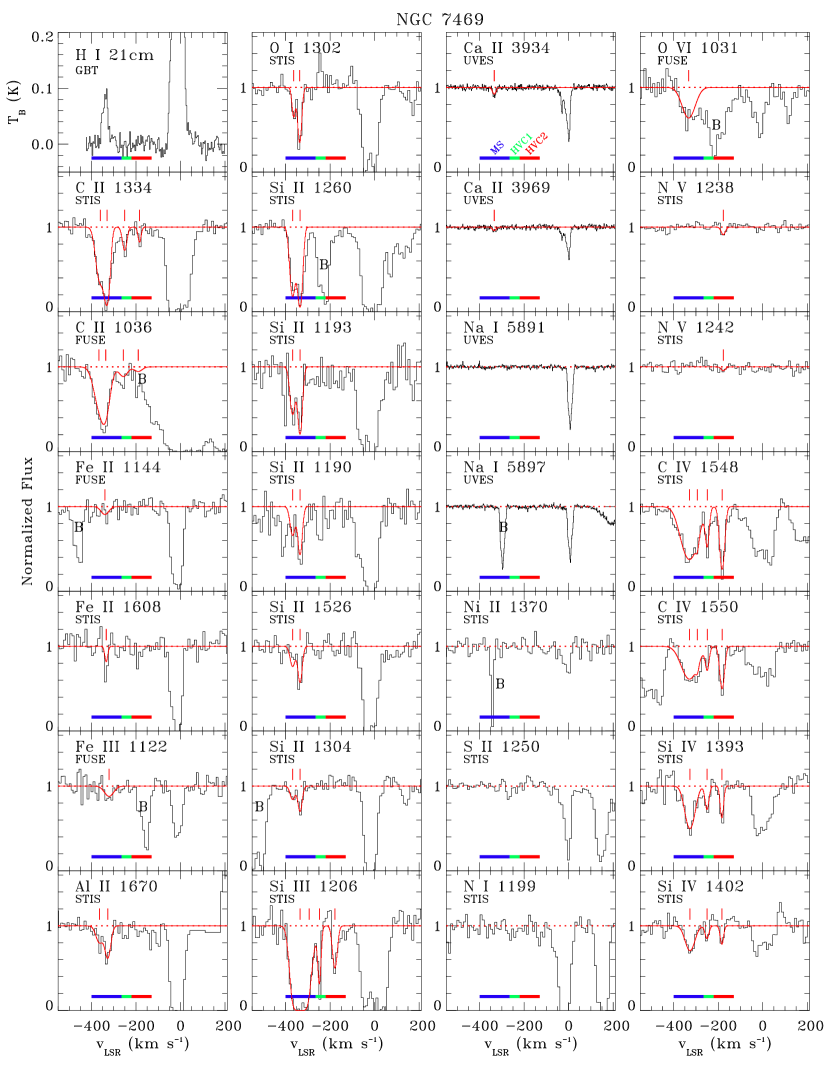
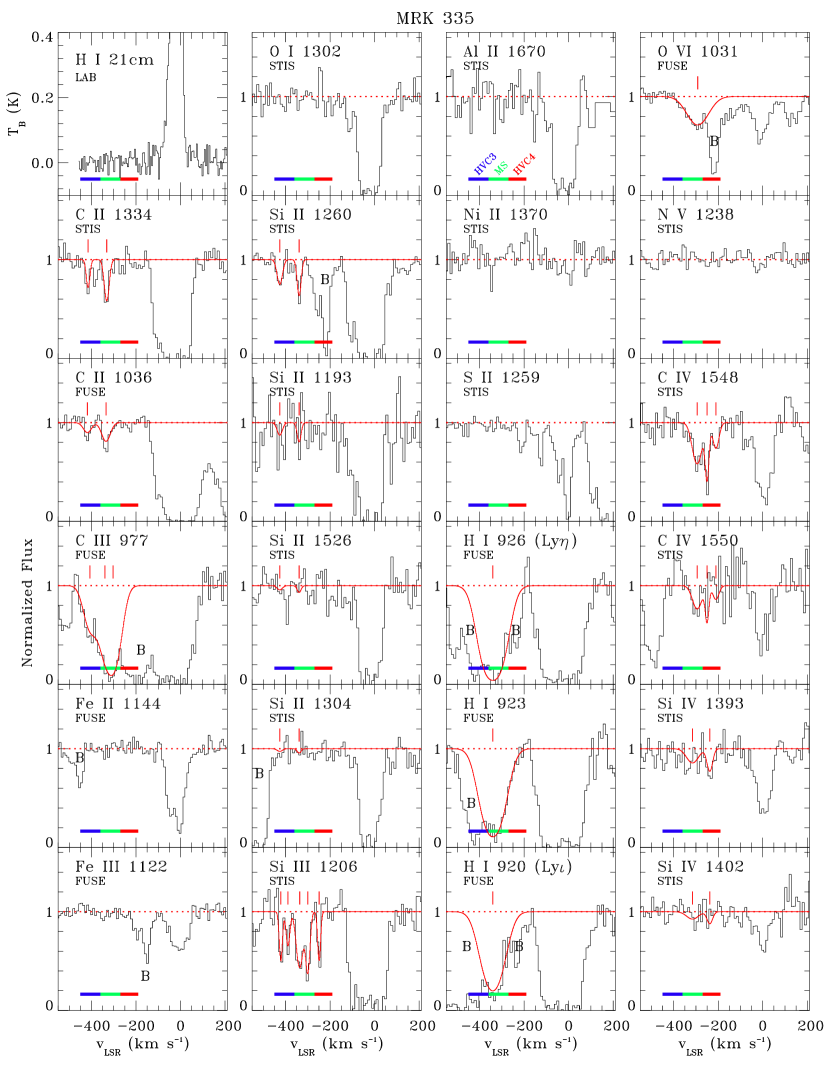
Figures 2 and 3 show the normalized UV absorption-line profiles toward NGC 7469 and Mrk 335, respectively. Included are all absorption lines showing MS detections, and several other lines showing MS non-detections that can be used to derive upper limits on the ionic column density. We also include 21 cm emission spectra and, in the case of NGC 7469, optical spectra of Ca II and Na I. A HV component is observed near =340 km s-1 in both sightlines, matching the velocity of the H I 21 cm emission from the MS toward NGC 7469. We thus identify the 340 km s-1 component as the MS. Also visible in both sight-lines are other HVCs and the Galactic absorption components at 100 km s-1.
4.1. MS Absorption toward NGC 7469
Toward NGC 7469, the 21 cm observations from the GBT, Green Bank 140 foot, and Effelsberg telescope all show the MS in emission near 335 km s-1. The MS component is not detected in the LAB survey, but this can be attributed to that survey’s larger beam size (35′). Measurements of the H I emission in these four datasets are given in Table 3. The dispersion between the derived values of (H I) is a consequence of the differing beam sizes, and reflects the small-scale structure known to exist in HVCs on scales below 10′ (Savage et al., 2000; Wakker et al., 2001; Sembach et al., 2004; Brown et al., 2010). For our final value of log (H I), we adopt a weighted mean of the GBT and Effelsberg values (the two observations with the smallest beam size, 9.1′ and 9.7′, respectively). We also include a systematic error equal to the 1 dispersion between the three measurements of log (H I) listed in Table 3, to account for small-scale structure. This gives our adopted value log (H I)=18.630.03(stat)0.08(syst).
| Radio Telescope | Beam Size | Sensitivity | Resolution | log (H I) | (H I) | (H I) | Reference |
|---|---|---|---|---|---|---|---|
| (arcmin) | (mK) | ( km s-1) | ( in cm-2) | ( km s-1) | ( km s-1) | ||
| Green Bank Telescope (GBT) | 9.1 | 20 | 1.0 | 18.670.03 | 337 | 16.3 | Brown et al. 2010 |
| Effelsberg 100 m | 9.7 | 20 | 1.0 | 18.540.05 | 332 | 16.0 | Wakker et al. 2001 |
| Green Bank 140 ft | 21 | 10 | 2.0 | 18.520.06 | 342 | 26.6 | Brown et al. 2010 |
| Leiden-Argentine-Bonn (LAB) | 35 | 60 | 1.0 | 18.52 | Kalberla et al. 2005 |
Note. — We adopt a weighted mean of the GBT and Effelsberg column densities, because of their similar small beam size. We also include a systematic error equal to the 1 dispersion between the three values of log (H I) listed above to account for small-scale structure. Our final adopted column density is log (H I)=18.630.03(stat)0.08(syst).
HV absorption is identified in the spectra of NGC 7469 in the velocity range 400 to 130 km s-1 in the low-ion lines O I 1302, C II 1036,1334, Si II 1260,1193,1190,1526,1304, Si III 1206, Al II 1670, and Ca II 3934,3969. Low significance absorption is seen in Fe II 1144 (1.2 detection) and 1608 (2.1), and in Fe III 1122 (2.5). Among the high ions, O VI 1031, C IV 1548,1550, and Si IV 1393,1402 are clearly detected, whereas absorption in N V 1238 and 1242 is detected at 2.4 and 1.8 significance, respectively, but only in a single component centered near 177 km s-1, not in the main MS component at 340 km s-1. No significant HV absorption is detected in Na I 5891,5897, S II 1259,1253,1250 or N I 1199,1200.2,1200.7. The lines O VI 1037, O I 1039 and C II∗ 1335 are blended in the velocity interval 400 to 200 km s-1, so cannot be measured. C III 977 and the higher-order H I Lyman series lines, lying in the FUSE SiC channels below 1 000 Å, are too noisy for any useful measurement.
Analysis of the profiles with the highest S/N ratio (C II, Si III and C IV) reveals at least three HV components. These are identified with colored horizontal bars on Figure 2 and defined as follows: the main MS component covering the range 400 to 265 km s-1 and centered at 340 km s-1, a weaker component (which we label HVC1) covering 265 to 220 km s-1 and centered at 250 km s-1, and a third component (HVC2) covering 220 to 130 km s-1 and centered at 200 km s-1. In O I, C II, Si II 1260 and Al II, the main MS component shows two sub-components at 365 and 335 km s-1. For Si III, complete saturation in the range 360 to 305 km s-1 prevents us from resolving these sub-components, so we do not attempt a fit to the MS components in Si III, though we note that in the unsaturated interval 400 to 360 km s-1, the Si III profile is consistent with that of Si II, suggesting the two ions are co-spatial at these velocities.
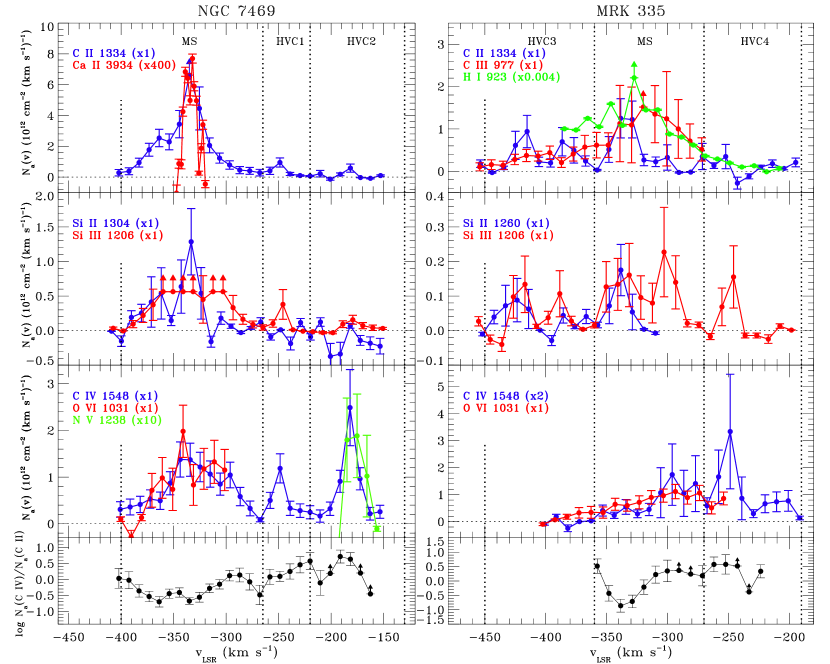
The HVC component structure can be seen in more detail in the left panels of Figure 4, where we plot the apparent column density profiles versus velocity for the low ions C II, Ca II, Si II, and Si III, and the high ions C IV, N V, and O VI. With the exception of N V, the high-ion profiles show a broadly similar component structure as the low-ion profiles, but with different relative strengths. Furthermore, the C IV profile shows an extra component near 295 km s-1, not seen in the low ions (expect possibly in Si III). In the bottom-left panel of Figure 4, we show the C IV/C II column density ratio versus velocity, which indicates the relative amounts of high-ion and low-ion gas. This ratio was formed by interpolating the C IV profile onto the same velocity grid as the C II profile, and propagating the errors on (C IV) and (C II). HVC1 and HVC2 exhibit markedly higher C IV/C II ratios than the principal MS component: log (C IV)/(C II) changes by over 1 dex from in the MS to in HVC2, indicating that relatively more high-ion gas is present in HVC1 and HVC2 than in the MS component. Note that Sembach et al. (2003) classified HVC1 and HVC2 as “LG” (Local Group) absorbers, which could account for their different ionization level. It is also possible that they are ionized fragments of the outer Stream that have acquired velocity offsets relative to the MS, and are in the process of being evaporated through the MS/corona interaction.
4.2. MS Absorption toward Mrk 335
Toward Mrk 335, the best 21 cm data available covering MS velocities are from the LAB survey. These data show no detection of the Stream (Figure 3); we measure a 3 limit log (H I)18.35 in the range 400 to 300 km s-1. However, we determined (H I)MS toward Mrk 335 by fitting the 340 km s-1 component seen in the higher-order Lyman lines in the FUSE data. Using a simultaneous single-component VPFIT to H I 926 (Ly), 923 (Ly), and 920 (Ly), we derive log (H I)=16.670.05. We tried fitting these three H I lines with a two-component MS model (as seen in Si III; see below), but VPFIT rejected the second component, i.e. a more complex H I component structure is not warranted by the data quality, and we proceed with a single-component fit. For reasons of space, only three H I lines are shown in Figure 3; the full Lyman series is displayed in Figure 2 of Fox et al. (2006).
The Mrk 335 STIS spectrum is noisier than the NGC 7469 STIS spectrum, but still shows HV absorption in the LSR velocity range 450 to 200 km s-1 in C II 1036,1334, Si II 1260, Si III 1206, C IV 1548,1550, and Si IV 1393,1402. The FUSE spectrum shows clear HV absorption in C III 977 and O VI 1031. No significant HV absorption is detected in O I 1302, Si II 1193,1526,1304, Al II 1670, Ni II 1370, S II 1259,1253,1250, N I 1199,1200.2,1200.7, or N V 1238,1242. We do not possess an optical spectrum of this object, so no Ca II or Na I profiles are available.
Two narrow HV components are observed in the low ions C II and Si II, the first centered at 415 km s-1 and the second at 330 km s-1. Based on the agreement with the 21 cm velocity of the MS toward NGC 7469 (24.9 away), we identify the 330 km s-1 component as the MS, and label the 415 km s-1 feature as HVC3, although we cannot rule out the possibility that both components are related to the MS. For our AOD integrations we define HVC3 from 450 to 365 km s-1, and the MS from 365 to 315 km s-1. Both components are also seen in C III and Si III, although in these two ions the MS absorption extends further to 270 km s-1. In Si III both the HVC3 and MS intervals show two sub-components, which we fit individually, though higher S/N observations are needed to confirm this sub-structure. We fit the C III MS absorption with a two-component model with velocity centroids tied to the values obtained from the Si III fit.
The high ions show a different component structure than the low ions. No high-ion absorption is detected in HVC3, but C IV, Si IV, and O VI all show clear absorption in the MS velocity range. The high-ion absorption peaks near 300 km s-1, as opposed to 340 km s-1 for the low ions (note the 300 km s-1 high-ion component is also seen toward NGC 7469). Furthermore, C IV and Si IV show additional HV absorption in the range 270 to 190 km s-1, which we label HVC4 (O VI is present but blended with H2 at these velocities). None of the low ions (except Si III) show detectable absorption in HVC4. The C IV 1548 profile shows two components within the HVC4 range. The differing behaviour of the high- and low-ions toward Mrk 335 can be seen in the apparent column density profiles shown in the right panels of Figure 4. As in the case of NGC 7469, the logarithmic C IV/C II ratio changes from at MS velocities to in HVC4.
5. Metallicity of the MS
Toward NGC 7469, we can directly determine the oxygen abundance in the MS using the measured column densities of O I and H I. Because of the similar ionization potentials of O and H, a charge exchange reaction couples the two species together (Field & Steigman, 1971; Viegas, 1995). Furthermore oxygen is typically not strongly depleted onto interstellar dust (Meyer et al., 1998; Jensen et al., 2005). Thus the observed ratio [O I/H I] gives a close indication of the true oxygen abundance [O/H] and the overall metallicity. Combining the measured log (H I)=18.630.03(stat)0.08(syst) from the 21 cm data with log (O I)=14.320.04 from O I 1302 and the solar oxygen abundance log (O/H)⊙=3.31, we find [O/H]MS=1.000.05(stat)0.08(syst), where we use the solar (photospheric) abundances of Asplund et al. (2009) and the standard notation [X/Y]=log (/)–log (X/Y)⊙. This is closer to the SMC interstellar oxygen abundance, [O/H]SMC=0.660.10, than to the LMC value, [O/H]LMC=0.340.06 (Russell & Dopita, 1992, updated to the latest solar abundances), and close to the oxygen abundance in the Magellanic Bridge [O/H]MB=0.96 measured by Lehner et al. (2008). Our value for [O/H]MS is lower than previous MS metallicity estimates (Lu et al., 1998; Gibson et al., 2000; Sembach et al., 2001) by a factor of 2–4, but we emphasize that our measurement is the first derived from the O I/H I ratio, which is robust against ionization corrections, as opposed to the Si II/H I or S II/H I ratio, which are not. Our value supports the view that the Stream originates in the SMC rather than the (higher-metallicity) LMC. Using the non-detection of N I 1199.5496 in the MS toward NGC 7469, we measure [N/H]MS=[N I/H I]–0.92 at 1 and –0.44 at 3 confidence, consistent with the interstellar nitrogen abundance in the SMC, [N/H]SMC=1.200.20 (Russell & Dopita, 1992), though a higher S/N spectrum is needed to place a stronger limit.
6. Low Ions: Photoionization Modeling
In this section we investigate the physical conditions and chemical abundances in the MS by modeling the metal-line column densities observed toward NGC 7469 and Mrk 335 with the photoionization code CLOUDY.
6.1. CLOUDY Methodology
We ran a photoionization model to the observed low-ion column
densities in the MS using the one-dimensional photoionization code
CLOUDY (v08.00; last described in Ferland et al., 1998).
The goal of this process is to solve for the ionization parameter
log in the low-ion phase, where ,
the ratio of ionizing photon density to gas density,
which in turn determines the density and line-of-sight size of the cloud.
Our CLOUDY runs assume the HVCs are plane-parallel uniform-density
slabs exposed to an ionizing radiation field. We compute this field as
the sum of two contributions:
(a) the =0 extragalactic background (EGB) incorporated within
CLOUDY. The EGB is based on Haardt & Madau (1996, 2001) but updated to include
the contribution from starburst galaxies, and has a specific flux at 1 Ryd of
= erg cm-2 s-1 Hz-1
(see also Shull et al., 1999), and a total ionizing flux
= photons cm-2 s-1, and
(b) the radiation field escaping from the Milky Way
(MW), as parameterized in Fox et al. (2005a) based on the model of
Bland-Hawthorn & Maloney (1999), with an escape fraction of 6% normal to the disk.
This Galactic contribution is calculated assuming an
MS distance of 50 kpc, giving a specific flux at 1 Ryd of
= erg cm-2 s-1 Hz-1, and a total ionizing photon flux
= photons cm-2 s-1.
The total ionizing fluxes in the MW (at 50 kpc) and EGB fields
are very similar, but the shallower (i.e. harder) slope of the EGB
ensures it dominates the provision of high-energy photons.
The ionizing photon density in our combined MW+EGB field
is cm-3.
The following procedure was used to solve for log and the relative abundance pattern in the MS along each sight line. We ran a grid of CLOUDY models at different ionization parameter, with log varied from 1.0 to 5.0 in 0.05 dex intervals, taking the H I column density and the metallicity [O/H]MS=1.00 as fixed inputs. We then found the model (i.e. the value of log ) that best reproduced the observations, by minimizing the squared residuals between the observed and predicted column densities for the ions included in the model. The included ions are only those for which successive ion stages from the same element are available (Si II/Si III, C II/C III, or Fe II/Fe III). These successive ion stages are the key to the CLOUDY models, since for a given (H I), a given ratio uniquely specifies log . We then find the non-solar relative abundances (if any) that are needed to reproduce the absolute column densities of all low ions detected in the MS. The entire process is then repeated for each sight line.
The validity of the CLOUDY models relies crucially on the assumption that the ions included are co-spatial. We assess this in each sight line by detailed comparison of the velocity component structure. In addition, the NGC 7469 model assumes the H I column density along the pencil-beam line-of-sight is equal to the value derived from a 21 cm observation taken with a 9.1′ beam (see discussion in §4.1). The Mrk 335 model does not suffer from this uncertainty since in this sightline (H I) is derived from the Lyman series absorption lines. Finally, uncertainty in the distance to the MS translates into uncertainty in the flux of Galactic ionizing photons incident on the clouds. As an approximate guide, a 10% (5 kpc) error in the MS distance translates to a 20% error in the Galactic ionizing flux. Such an error would not change the derived value of log , but if the MS is closer (further) than 50 kpc, the derived gas density will be higher (lower) than the values reported below, since will be higher (lower).
6.2. CLOUDY Results: NGC 7469 Sight Line
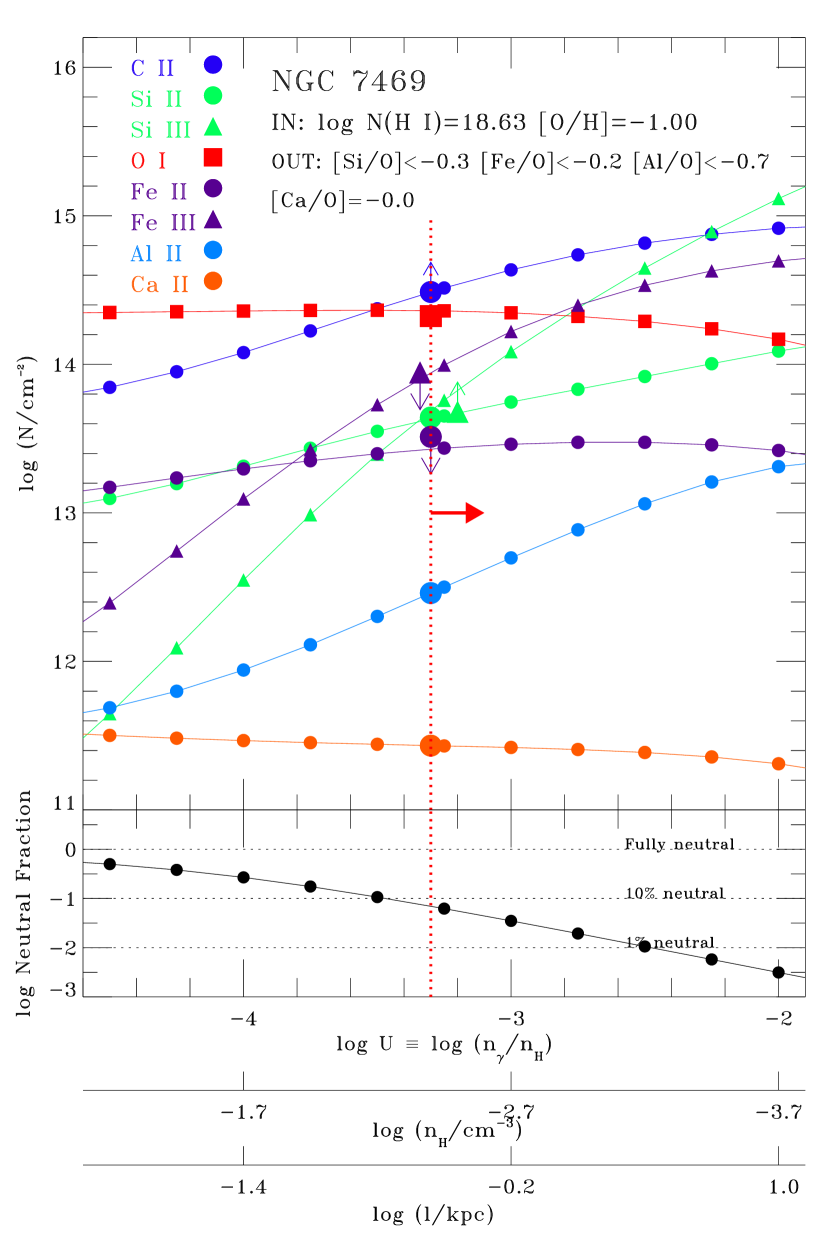
Toward NGC 7469, the lines of successive ionization states covered by the data are Fe II/Fe III and Si II/Si III. Fe II and Fe III are each only marginally detected and their ratio is not reliably determined, so they were not used to constrain log . A good Si II MS column density is available; we adopt the value log (Si II)=13.640.05 measured from the 1193 line, but due to saturation in Si III between 360 and 300 km s-1 we can only derive a lower limit on the MS Si III column, log (Si III)13.82. Applying our CLOUDY model to the limit on the MS Si III/Si II ratio, log [(Si III)/(Si II)]0.26, yields log 3.15. However, looking closely at the line profiles, we see that Si III has a contribution from the 300 km s-1 component seen in C IV and O VI but not in Si IIThis extra absorption should not be included in the CLOUDY model of the low-ion phase, so we repeated the Si III AOD measurement in the range 400 to 315 km s-1, where the Si II and Si III profiles are consistent. This gives log (Si III)13.68 and log [(Si III)/(Si II)]0.12, in turn giving log 3.30. This limit on log translates to a gas density log (/cm-3)2.36, a neutral hydrogen fraction (93% hydrogen ionization level), a total hydrogen column density log (H I+H II)19.79, and a line-of-sight cloud size =(H I+H II)/4.6 kpc. This model is shown on the left panel of Figure 5.
The lower limit log allows us to constrain the abundances of Si, Fe, Al, Ca. We find [Si/O], [Fe/O], [Al/O], and [Ca/O]MS=0.00.1, i.e. we derive sub-solar abundances of Si, Fe, and Al (relative to O), but an approximately solar Ca relative abundance. The results for Si/O, Fe/O, and Al/O are all upper limits since the solution to log must be above 3.30, and in this regime, the curves showing the predicted Si II, Fe II, and Al II columns on Figure 5a must move down to reproduce the corresponding observations. The result for Ca/O is a value (not a limit) because Ca II and O I track each other closely at all values of log under consideration, both with almost flat curves. Since Si and O are both -elements, they share a common nucleosynthetic origin and their intrinsic ratio should be close to solar, so the sub-solar value of [Si/O]MS indicates that Si is depleted into dust grains (O being undepleted), by an amount at least as large as the typical Si depletion in Milky Way halo clouds (0.260.14; Sembach & Savage, 1996). The depletions of Al and Fe are consistent with the presence of dust in the MS. The finding that there is little room for depletion of Ca onto dust grains is puzzling, but mirrors a similar result found by Richter et al. (2009) in their study of O I HVCs (in non-MS directions).
The presence of dust in the MS has been inferred before, by (a) the detection of molecular hydrogen, which forms on the surface of dust grains, toward NGC 3783 (Sembach et al., 2001) and Fairall 9 (Richter et al., 2001), and (b) the super-solar sulfur-to-iron ratio of S/Fe=7.62.2 solar measured in the MS toward NGC 3783 by Lu et al. (1998), indicating that Fe (but not S) is depleted out of the gas phase into dust. However, in the NGC 7469 sightline under study here, Wakker (2006) found no H2 in the MS (only a low-velocity, Galactic component), indicating that the neutral gas column [log (H I)MS=18.63] is too low to create a detectable H2 column.
6.3. CLOUDY Results: Mrk 335 Sight Line
Toward Mrk 335, the available single-element diagnostic ratios are Si III/Si II and C III/C II (Fe II and Fe III are undetected). Because of saturation in C III 977, the measured C III/C II ratio is a lower limit, but neither Si II nor Si III appears saturated, so a solution for log is possible from the Si III/Si II ratio. The key question is whether the H I and the singly- and doubly-ionized species are co-spatial. Looking at the line profiles, the C III and H I column density profiles track each other fairly well over MS velocities (Figure 4, top-right panel). However, the MS component appears broader in C III (=3712 km s-1) and H I (=582 km s-1) than in C II (=122 km s-1) and Si II (=92 km s-1), and the Si III profile (observed at 7 km s-1 resolution) shows sub-structure in the MS velocity interval. Given the lower FUSE resolution below 1 000Å and the presence of saturation, this indicates that unresolved component structure is likely present in C III and H I.
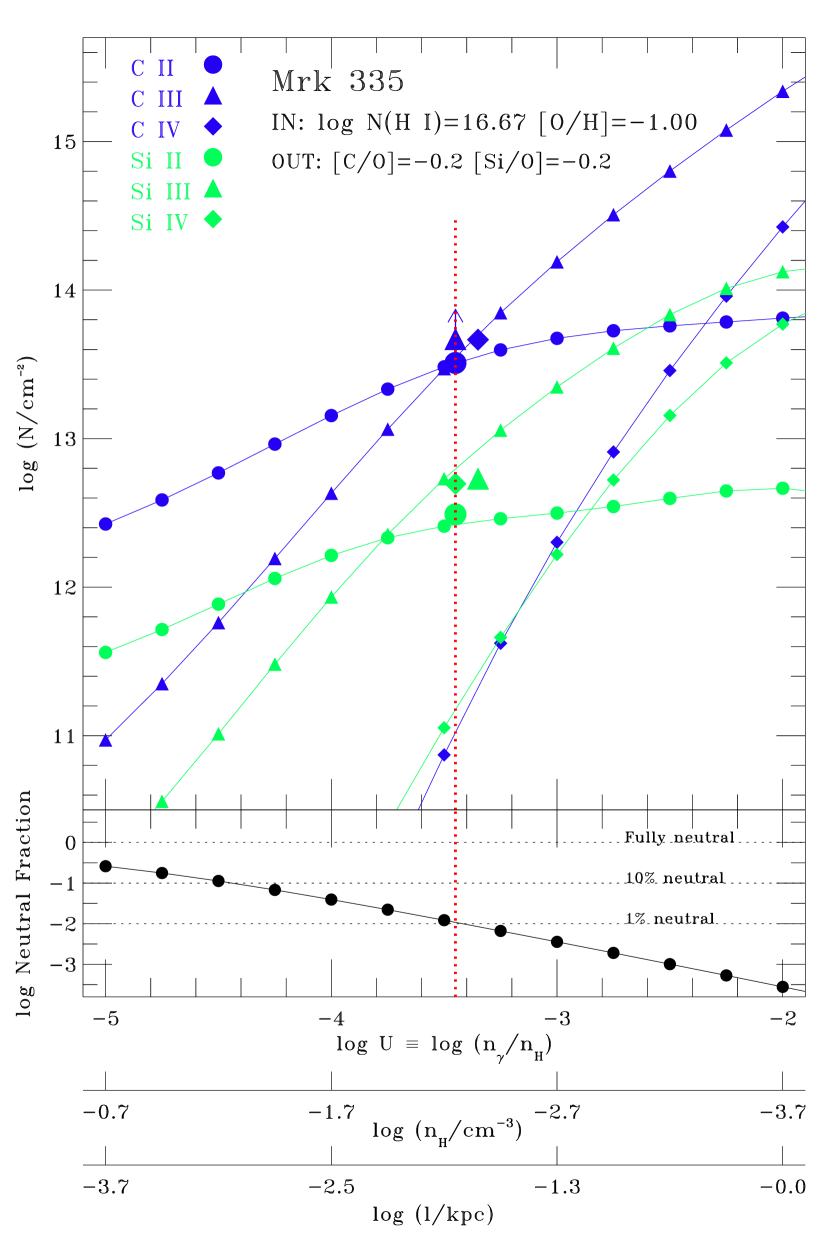
If we assume that C II, C III, Si II, Si III, and H I co-reside in the same gas, then using the column densities measured in the range 360 to 270 km s-1, where log [(Si III)/(Si II)]=0.520.08 and log [(C III)/(C II)]0.49, we derive log =3.150.08, [C/O]=0.30.1 and [Si/O]=0.30.1. However, this solution does not account for the contribution to the Si III column from the highly-ionized 300 km s-1 component seen in C IV and O VI but not in Si II. To account for this, we repeated our Si III/Si II and C III/C II measurements in the restricted interval 360 to 315 km s-1, where the Si II and Si III profiles closely overlap and where there is little high-ion absorption. In this interval we find log [(Si III)/(Si II)]=0.240.09 and log [(C III)/(C II)]0.16. Using these revised ratios in the CLOUDY model yields log =3.450.08, [C/O]=0.20.1 and [Si/O]=0.20.1. This model is shown in the right panel of Figure 5. In summary, a final constraint on log that allows for the possibility that the doubly-ionized species in the 300 km s-1 component are collisionally ionized (and hence should not be included in the CLOUDY model) is between 3.45 and 3.15.
The range of allowed values for log allows us to constrain the physical conditions in the MS toward Mrk 335. We derive a gas density log (/cm-3) of 2.51 to 2.21, a neutral hydrogen fraction of 0.5–1.1% (ionization fraction H+/H of 98.9–99.5%), a total hydrogen column density log (H I+H II) of 18.64–18.96, a line-of-sight size of 0.2–0.9 kpc, and a gas pressure /k=2.1 of 90–170 cm-3 K (the factor of 2.1 accounts for the electron pressure). Repeating the model with the EGB radiation field only (no MW field) only changes the derived value of log by 0.05 dex.
Whereas the best-fit model is capable (by design) of explaining the low-ion (singly- and doubly-ionized species) column densities, it cannot explain the high ions (triply-ionized and above). The log =3.45 model under-produces the actual Si IV, C IV, and O VI columns by 1.6, 2.5, and 8 orders of magnitude, respectively. This is shown for C IV and Si IV in Figure 5b (compare the models and data points for the blue and green diamonds). The difficulty of photoionizing the high ions in HVCs has been found before by many authors (Sembach et al., 2003; Tripp et al., 2003; Gnat & Sternberg, 2004; Collins et al., 2004, 2005, 2007; Fox et al., 2005a; Ganguly et al., 2005), and indicates a separate ionization mechanism is required for the high ions. The separate behavior of the high ions is confirmed by their different (but overlapping) component structure in velocity space.
Toward HE 0226–4110, an AGN sightline 11 Off-Stream (i.e., off the 21 cm-emitting regions) where the MS is seen in absorption with (H I)17.0, Fox et al. (2005a) find CLOUDY solutions to the Si III/Si II and C III/C II ratios with log between 3.5 and 3.7, implying hydrogen ionization fractions 98%. Our new results for the Mrk 335 sight line are in reasonable agreement with this for the ionization level of the low-ion gas in the outer MS (the Off-Stream directions).
7. High Ions: Collisional Ionization Modeling
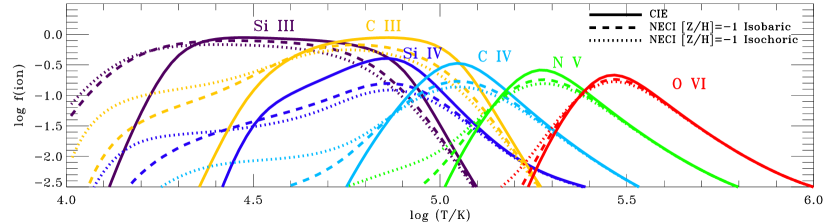
As photoionization is unable to explain the observed strength of the high-ion absorption lines in the MS (or in other HVCs), we turn to collisional ionization (CI). We use the CI models of Gnat & Sternberg (2007, hereafter GS07), which predict the ionization fractions as a function of temperature for all commonly observed elements, in both the equilibrium (CIE) and non-equilibrium (NECI) cases. Figure 6 shows these predicted ionization fractions for Si III, C III and the four high ions Si IV, C IV, N V, and O VI. We show the CIE case and two NECI models at [Z/H]=1 (the closest model to the MS metallicity), for the isobaric and isochoric cases. Other models have been developed to explain the high-ion plasma around interstellar clouds, including conductive interfaces (Böhringer & Hartquist, 1987; Borkowski et al., 1990; Gnat et al., 2010), turbulent mixing layers (Slavin et al., 1993; Esquivel et al., 2006), and shock ionization (Dopita & Sutherland, 1996; Indebetouw & Shull, 2004). Summaries of the predicted high-ion ratios in many of these models are given in Spitzer (1996) and Fox et al. (2004).
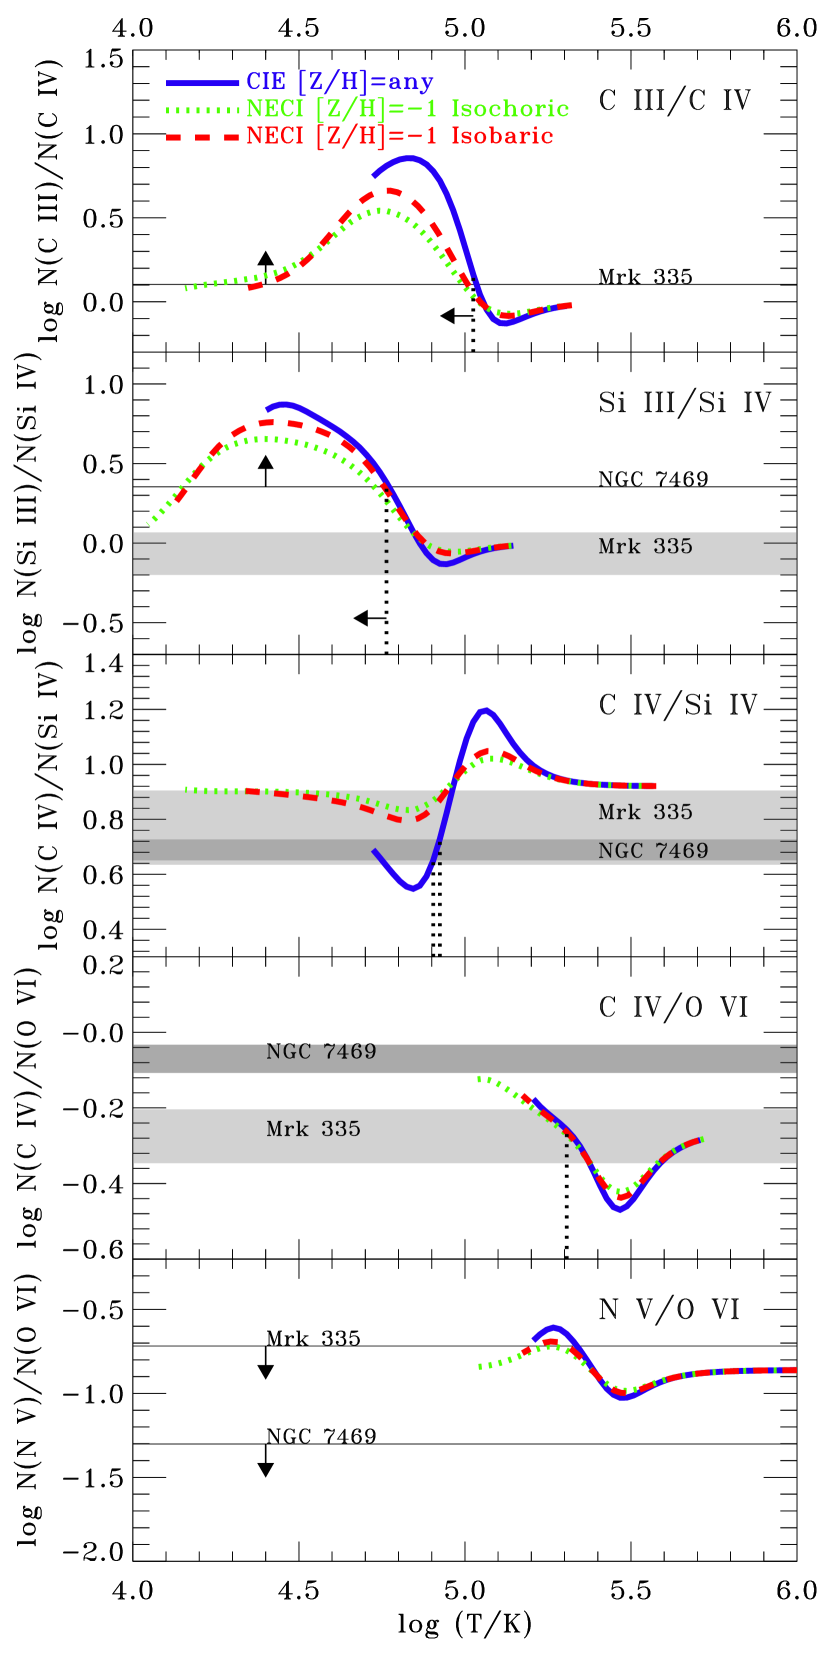
To compare the CI models with the MS observations, we analyze the high-ion column density ratios (Figure 7). The main panels display the run of five ion ratios (C III/Si IV, Si III/Si IV, C IV/Si IV, C IV/O VI, and N V/O VI) vs temperature in the CIE and NECI models. The latter three of these ratios assume solar relative abundances. The shaded regions show the observed high-ion ratios in the MS component, using the AOD column densities reported in Tables 1 and 2. In principle, the high-ion -values can be used to give an upper limit on the temperature, but the observed limits are not constraining: for example, the measured (C IV)=28 km s-1 in the MS component toward Mrk 335 implies log in the C IV phase. The model high-ion ratios are only plotted for temperatures where both ion fractions are greater than some threshold (here arbitrarily chosen as 0.001), otherwise the total column density, which scales as , becomes implausibly large. For example, the C IV/O VI ratio is only plotted at temperatures where C IV/C0.001 and O VI/O0.001.
If the observed high-ion lines in the MS were formed in a single region of plasma in CIE or NECI, all the ratios on Figure 7 would yield a solution at the same temperature. This is clearly not the case; in both sight lines, there is no single-temperature CI solution (in or out of equilibrium) that can explain all three of the Si IV, C IV, and O VI column densities. This suggests that the MS high-ion plasma is itself multi-phase, with one phase containing the Si IV, and one containing the O VI, and the C IV potentially contributing to each. We therefore look at each ratio in turn to investigate multi-phase solutions.
The top two panels of Figure 7 show the observed C III/C IV and Si III/Si IV ratios in the MS. The model predictions for these ratios have the advantage of not depending on the elemental abundances. The C III/C IV ratio toward Mrk 335 (0.43 in the log) can be reproduced by gas in CIE at 4.75log 4.96. The Si III/Si IV ratio toward NGC 7469 (0.49 in the log) can be reproduced by gas in CIE at 4.40log 4.72, and toward Mrk 335, the Si III/Si IV ratio (0.220.13 in the log) can be explained by CIE at log =4.800.03.
The C IV/Si IV ratio toward NGC 7469 (0.690.04 in the log) can be reproduced with a CIE model at log =4.900.02 if [C/Si]=0. This model predicts (Si III)=13.91, to be compared with the observed (Si III)13.82 in the MS. That is, a log =4.90 CIE model can explain the C IV, Si III, and Si IV MS column densities toward NGC 7469. The C IV/Si IV ratio toward Mrk 335 (0.770.13 in the log) is also reproduced by a CIE model at log =4.920.03 if [C/Si]=0. This CIE model predicts (C III)=14.29 and (Si III)=13.44, to be compared with the observed (C III)14.00 and (Si III)=13.01, i.e. it over-predicts the Si III column by 0.43 dex. On a linear scale, our measured C IV/Si IV ratios are 4.9 toward NGC 7469 and 5.9 toward Mrk 335, fairly close to the Galactic halo average of 3.51.1 reported by Zsargó et al. (2003), but slightly higher than the Magellanic Bridge values of between 1.5 and 2.3 reported by Lehner (2002).
Note that in §6, we included the C III and Si III ions in the photoionization models, i.e. we placed them in the low-ion phase of the MS. In both sightlines, this approach is justified in the range 360 to 320 km s-1 where C II, C III, Si II, and Si III all show a similar component structure. However, the twin findings that (a) in both sightlines, Si III shows absorption in the 300 km s-1 high-ion component seen in C IV and O VI, and (b) a GS07 CIE model to the measured C IV/Si IV ratio in the 300 km s-1 component predicts fairly successfully the observed C III and Si III columns in that component, indicate that collisional ionization cannot be ignored as a contributor to the doubly-ionized species in the MS. Hybrid photo+collisional-ionization models are needed to properly account for this (see Tripp et al., 2008; Howk et al., 2009).
We can also investigate solutions that apply if the C IV and O VI are co-spatial. The observed MS C IV/O VI ratios have no CIE or NECI solution unless the C/O ratio is super-solar: toward NGC 7469 where C IV/O VI = 0.070.04 (logarithmic), a CIE solution is possible at log =5.250.04 if [C/O]=+0.15888This ratio seems unlikely, since low-metallicity environments (e.g. metal-poor halo stars) show a tendency for sub-solar C/O ratios (Akerman et al., 2004).. Toward Mrk 335, the logarithmic C IV/O VI ratio of 0.270.07 has a CIE solution at log =5.250.04 if [C/O]=0. Toward NGC 7469, no N V is detected in the MS component (although N V is detected in HVC2); we place a limit log (N V)/(O VI)1.30 in the MS component, requiring a sub-solar [N/O]MS (as in the SMC) for a CI solution to be be found. The non-detection of N V toward Mrk 335 is not strong enough to constrain [N/O].
7.1. Total Hydrogen Column Density in the High-Ion Phases
Although the ambiguity over the location of the C IV prevents us from drawing firm conclusions about the temperature in the high-ion regions, we can still infer lower limits on the total column density of hot plasma in the MS from the Si IV and O VI observations alone. This is because the Si IV and O VI ion fractions Si IV/Si and O VI/O never exceed certain maximal values (Figure 6). It can be seen that Si IV/Si0.40 and O VI/O0.22 in any of the GS07 CI models (CIE or NECI). Thus, the H II column in the Si IV phase can be calculated as (H II)(Si IV)/[(Si IV/Si)max(Si/H)], and the H II column in the (separate) O VI phase as (H II)(O VI)/[(O VI/O)max(O/H)], where we assume that [Si/H] and [O/H] in the high-ion phase equal the metallicity measured in the low-ion phase, [O/H]MS=1.00. If [Si/O]0 in the high-ion phase, as is the case in the low-ion phase, then the value of (H II) increases accordingly. Hence the lower limit on (H II) is doubly conservative, once for the ionization correction and once for the abundance correction.
In the MS toward NGC 7469 where
log (Si IV)=13.33 and log (O VI)=14.09, we derive (H II) and (H II). In the MS toward Mrk 335 with log (Si IV)=12.80 and log (O VI)=13.84, we derive
(H II) and (H II) We emphasize that the H II columns derived here are distinct from
the warm H II columns derived in the photoionized phase of the MS in
§6, since the high ions trace physically different regions.
The total plasma content in the MS is then
(total H II)=
(H II)warm+(H II)+(H II).
8. Ionized-to-Neutral Ratio in the Stream
By summing the lower limits on (H II) in the low-ion and high-ion phases of the MS as calculated in §6 and §7, we find (total H II)19.9 toward NGC 7469 and 19.2 toward Mrk 335. The ratio (total H II)/(H I), indicating the relative amounts of ionized and neutral gas in the MS, is then 19 toward NGC 7469, and 330 toward Mrk 335. Along the sight line toward HE 0226–4110, 11 away from the MS, we use the column densities presented by Fox et al. (2005a) to derive (total H II)/(H I)120 using an identical method. These numbers, summarized in Table 4, indicate that along each of these three sight lines, the MS contains significantly more ionized gas than neutral gas.
The detection of high-ion absorption together with the observed fragmentation of the Stream’s H I into small clumps (Stanimirović et al., 2002, 2008; Wakker et al., 2002; Westmeier & Koribalski, 2008; Nigra et al., 2009) supports the picture that the MS is being “evaporated” as it plows through the hot Galactic corona, a scenario predicted by hydrodynamical simulations (Heitsch & Putman, 2009; Bland-Hawthorn, 2009) and theoretical considerations (the dominance of heating over drag; Murali, 2000). Indeed, the maps presented by Stanimirović et al. (2008) show that the MS filament “S3” breaks into clumps very close to the NGC 7469 direction under study here. Evaporation has important consequences for the role HVCs play in Galactic evolution, since if they cannot survive their inflow passage, they will serve to replenish the hot corona with new plasma, rather than to bring neutral fuel to the disk for future generations of star formation. However, the leading arm of the MS has apparently reached the Galactic disk where it is interacting with the neutral gas (McClure-Griffiths et al., 2008), so a stabilizing mechanism (e.g., magnetic fields; Konz et al., 2002) may protect it against disruption.
If the MS and other HVCs break up as they move through the hot halo, one may expect to see short-lived circumgalactic gas fragments as a result. Indeed, a recent survey of high-velocity O I absorption along 26 QSO sightlines uncovered a previously unnoticed population of low-column density circumgalactic clouds (Richter et al., 2009). These low-mass clouds represent Lyman-Limit systems and thus remain mostly unseen in 21 cm emission, but cover a significant fraction (25%) of the sky and must be very numerous () and widespread throughout the Milky Way halo. The sky position and radial velocities of some of the detected O I features are consistent with a MS origin, supporting the idea that the MS has already lost a substantial portion of its original mass during its passage through the halo, leaving behind debris that is rapidly evaporated and incorporated into the Milky Way’s coronal gas reservoir. This debris may also be seen via optical observations of high-velocity Ca II absorption (Richter et al., 2005; Smoker et al., 2005; Ben Bekhti et al., 2008).
| Sightline | Location |
(H I)aaFor NGC 7469, (H I) is measured from the GBT 21 cm spectrum. For the other two sightlines, (H I) is measured using the higher-order Lyman lines in the FUSE spectra.
|
(H II) | ||||
|---|---|---|---|---|---|---|---|
| Low-ionbb(H II) in low-ion phase calculated using CLOUDY models described in §5.1.
|
Si IVcc Lower limits on (H II) in Si IV and O VI phases calculated using the maximal collisional ionization fractions described in §5.2.
|
O VIcc Lower limits on (H II) in Si IV and O VI phases calculated using the maximal collisional ionization fractions described in §5.2.
|
Total | ||||
| NGC 7469 | On Stream | 18.630.08 | 19.8 | 19.2 | 19.1 | 19.9 | 19 |
| Mrk 335 | Off Stream | 16.670.05 | 18.6 | 18.7 | 18.8 | 19.2 | 330 |
| HE 0226-4110ddUsing results from Fox et al. (2005a), integrated over =80–230 km s-1, with low-ion ionization level 99%. | Off-Stream | 17.0 | 19.0 | 18.7 | 18.9 | 19.4 | 220 |
Note. — The measured MS metallicity [O/H]=1.0 is assumed to apply in all phases.
9. Summary
We have used FUSE and HST/STIS/E140M UV spectra of two AGN to study the Magellanic Stream in absorption, focusing on its ionization level and chemical enrichment. The AGN are NGC 7469, lying behind the MS in a direction with log (H I)MS=18.630.03(stat)0.08(syst) measured from GBT and Effelsberg data, and Mrk 335 lying 24.9 away with log (H I)MS=16.670.05 measured from H I Lyman series absorption. These data are supplemented by VLT/UVES optical absorption profiles of Ca II and Na I toward NGC 7469. Our results can be summarized as follows.
-
1.
In both sight lines, the MS is detected as an absorption-line HVC at 340 km s-1. Other HVCs observed in both directions within 100 km s-1 of the main component may also be related to the MS. The detected species include the low ions H I, O I, C II, C III, Si II, Si III, Fe II, Fe III, Al II, and Ca II, and the high ions C IV, Si IV, and O VI. These lines are all weaker in the Mrk 335 (Off-Stream) direction. The detection of the MS in UV absorption in two Off-Stream directions (Mrk 335 and HE 0226–4110) demonstrates that even the most sensitive 21 cm observations do not reveal all the gas in the MS.
-
2.
Combining our UV measurement of (O I) in the MS toward NGC 7469 with (H I) measured from the 21 cm data, we derive a metallicity [O/H]MS=1.000.05(stat)0.08(syst) (1012% of solar), where the systematic error accounts for the beam-size mismatch between the radio and UV observations. This value, which is robust against ionization corrections, is similar to the Magellanic Bridge oxygen abundance measured by Lehner et al. (2008), and is closer to the SMC abundance than the LMC abundance, supporting the view that the Stream originates in the SMC. We also measure [N/H] (3).
-
3.
A multi-phase structure to the MS, with a warm, photoionized low-ion phase and hotter, collisionally-ionized high-ion phase(s), is required by two independent findings: (1) the high-ion profiles differ from the low-ion profiles, with the high ions showing an additional component at 300 km s-1 not seen in the low ions, and (2) a single-phase photoionization model cannot simultaneously reproduce both the low-ion and high-ion column densities in the MS.
-
4.
We investigated the ionization level in the low-ion phase of the MS with the photoionization code CLOUDY, using a radiation field that includes both Galactic and extragalactic contributions. The model assumes that the H I and the singly- and doubly-ionized species are co-spatial. Toward NGC 7469, our limit on the Si III/Si II ratio allows us to constrain the ionization parameter log 3.30, giving a MS gas density log (/cm-3)2.36, a neutral fraction (hydrogen ionization level H+/H93%), a total low-ion hydrogen column density log (H I+H II)19.79, and a line-of-sight cloud size 4.6 kpc. The model finds [Si/O]–0.3, [Fe/O]–0.2, and [Al/O]–0.7; these sub-solar abundances provide evidence for depletion onto dust grains. Toward Mrk 335, we use the Si III/Si II and C III/C II ratios to constrain log to lie between 3.45 to 3.15, giving log (/cm-3) between 2.51 and 2.21, =0.5–1.1% (H+/H=98.9–99.5%), log (H I+H II)=18.64–18.96, =0.2–0.9 kpc, and a gas pressure /k=90–170 cm-3 K. The range in the above values accounts for the possibility of a collisionally-ionized contribution to the Si III and C III columns from the 300 km s-1 component.
-
5.
The high-ion column densities in the MS are significantly underestimated by photoionization models, so collisional ionization is required. This process can occur at the interfaces between the warm phase of the Stream and the hot Galactic corona. However, there is no single-temperature CI solution that explains C IV, Si IV, and O VI, suggesting multiple high-ion phases are present: one seen in Si IV, one seen in O VI, with C IV potentially contributing to each. The C IV/Si IV ratios of 4.9 toward NGC 7469 and 5.9 toward Mrk 335 can be explained by plasma in CIE at log =4.900.02 and 4.920.03 respectively, assuming [C/Si]=0. Such models can contribute to the C III and Si III columns. Assuming that the metallicity measured in the low-ion phase applies to the entire MS complex, we infer that the H+ column in the Si IV and O VI phases is substantial: log (H II) and log (H II) in both sightlines.
-
6.
Summing over the low-ion and both high-ion phases, conservative lower limits on the total H II columns in the MS are log (total H II)19.9 toward NGC 7469, and 19.2 toward NGC 7469. Therefore, the total-ionized-to-neutral ratio (total H II)/(H I) in the MS is 19 toward NGC 7469, 330 toward Mrk 335, and 220 toward HE 0226–4110, a third MS sight-line with results taken from the literature. That is, along these three sight lines, the vast majority (95%) of the Stream has been ionized. The presence of warm-hot plasma around the MS (seen in the high ions) supports the picture that the Stream is being “evaporated” as it plows through the hot Galactic corona and will not reach the disk, as predicted by hydrodynamical simulations and suggested by the observed fragmentation of the Stream’s H I into small clumps.
It remains to be seen whether the MS represents a fundamentally different
category of object than the other large HVCs (Complex C, Complex A, Cohen
Stream, Smith Cloud) whose distances are all
within a factor of two of 10 kpc (Wakker et al., 2007, 2008; Thom et al., 2008).
There is an interesting contradiction in that the MS, out at
kpc, is apparently in the process of being destroyed by its
interaction with the corona, but yet the nearby HVCs at kpc
have managed to reach their current position without breaking apart.
This paradox may be solved if HVCs are short-lived structures, constantly
condensing out of, and re-evaporating into, the hot halo,
or alternatively, if they are stabilized against evaporation.
Further UV observations with the Cosmic Origins Spectrograph (COS),
now installed on HST, will be invaluable for constraining the
MS ionization level in directions covering a wide range of (H I).
Such measurements are needed to determine
the Galactic accretion rate in ionized gas, and the role of HVCs
in the global process of Galactic metabolism.
Acknowledgments. The FUSE satellite retired from service in October 2007. We thank the FUSE team at Johns Hopkins University for their tireless efforts to develop, operate, and support this productive facility. We thank Marilyn Meade for expert assistance with the FUSE data reduction pipeline, and the referee for a useful report. AJF gratefully acknowledges support from an ESO Fellowship. Support for program GO-9802 was provided by NASA through a grant from the Space Telescope Science Institute, which is operated by the Association of Universities for Research in Astronomy, Inc., under NASA contract NAS 5-26555.
References
- Akerman et al. (2004) Akerman, C. J., Carigi, L., Nissen, P. E., Pettini, M., & Asplund, M. 2004, A&A, 414, 931
- Asplund et al. (2009) Asplund, M., Grevesse, N., Jacques Sauval, A., & Scott, P. 2009, ARA&A, 47, 481
- Ballester et al. (2000) Ballester, P., Modigliani, A., Boitquin, O., et al. 2000, The Messenger, 101, 31
- Ben Bekhti et al. (2006) Ben Bekhti, N., Brüns, C., Kerp, J., & Westmeier, T. 2006, A&A, 457, 917
- Ben Bekhti et al. (2008) Ben Bekhti, N., Richter, P., Westmeier, T., & Murphy, M. T. 2008, A&A, 487, 583
- Bland-Hawthorn & Maloney (1999) Bland-Hawthorn, J., & Maloney, P. R. 1999, ApJ, 510, L33
- Bland-Hawthorn et al. (2007) Bland-Hawthorn, J., Sutherland, R., Agertz, O., & Moore, B. 2007, ApJ, 670, L109
- Bland-Hawthorn (2009) Bland-Hawthorn, J. 2009, IAUS, 254, 241 (arXiv:astro-ph/0811.2467)
- Böhringer & Hartquist (1987) Böhringer, H., & Hartquist, T. W. 1987, MNRAS, 228, 915
- Borkowski et al. (1990) Borkowski, K. J., Balbus, S. A., & Fristrom, C. C. 1990, ApJ, 355, 501
- Bowers et al. (1998) Bowers, C. W., et al. 1998, Proc. SPIE, 3356, 401
- Braun & Thilker (2004) Braun, R., & Thilker, D. A. 2004, A&A, 417, 421
- Brown et al. (2010) Brown, J, Wakker, B. P., & Lockman F. J. 2010, ApJ, in preparation
- Brüns et al. (2005) Brüns, C, et al. 2005, A&A, 432, 45
- Chiappini (2008) Chiappini, C. 2008, ASPC, 396, 113
- Collins et al. (2004) Collins, J. A., Shull, J. M., & Giroux, M. L. 2004, ApJ, 605, 216
- Collins et al. (2005) Collins, J. A., Shull, J. M., & Giroux, M. L. 2005, ApJ, 623, 196
- Collins et al. (2007) Collins, J. A., Shull, J. M., & Giroux, M. L. 2007, ApJ, 657, 271
- Collins et al. (2009) Collins, J. A., Shull, J. M., & Giroux, M. L. 2009, ApJ, 705, 962
- Connors et al. (2006) Connors, T. W., Kawata, D., & Gibson, B. K. 2006, MNRAS, 371, 108
- Dekker et al. (2000) Dekker, H., D’Odorico, S., Kaufer, A., Delabre, B., & Kotzlowski, H. 2000, SPIE, 4008, 534
- Dixon et al. (2007) Dixon, W. V. et al. 2007, PASP, 119, 527
- Dopita & Sutherland (1996) Dopita, M, A., & Sutherland, R. S. 1996, ApJS, 102, 161
- Dressel et al. (2007) Dressel, L., et al. 2007, STIS Data Handbook, Version 5.0, (Baltimore: STScI)
- Esquivel et al. (2006) Esquivel, A., Benjamin, R. A., Lazarian, A., Cho, J., Leitner, S. N. 2006, ApJ, 648, 1043
- Ferland et al. (1998) Ferland, G. J., Korista, K. T., Verner, D. A., Ferguson, J. W., Kingdon, J. B., & Verner, E. M. 1998, PASP, 110, 761
- Ferrara & Field (1994) Ferrara, A., & Field, G. B. 1994, ApJ, 423, 665
- Field & Steigman (1971) Field, G. B., & Steigman, G. 1971, ApJ, 166, 59
- Fox et al. (2004) Fox, A. J., Savage, B. D., Wakker, B. P., Sembach, K. R., Richter, P., & Tripp, T. M. 2004, ApJ, 602, 738
- Fox et al. (2005a) Fox, A. J., Wakker, B. P., Savage, B. D., Tripp, T. M., Sembach, K. R., & Bland-Hawthorn, J. 2005a, ApJ, 630, 332
- Fox et al. (2005b) Fox, A. J., Savage, B. D., & Wakker, B. P. 2005b, AJ, 130, 2418
- Fox et al. (2006) Fox, A. J., Savage, B. D., & Wakker, B. P 2006, ApJS, 165, 229
- Ganguly et al. (2005) Ganguly, R., Sembach, K. R., Tripp, T. M., & Savage, B. D. 2005, ApJS, 157, 251
- Gardiner & Noguchi (1996) Gardiner, L. T., & Noguchi, M. 1996, MNRAS, 278, 191
- Gibson et al. (2000) Gibson, B. K., Giroux, M. L., Penton, S. V., Putman, M. E., Stocke, J. T., & Shull, J. M. 2000, AJ, 120, 1830
- Gnat & Sternberg (2004) Gnat, O., & Sternberg, A. 2004, ApJ, 608, 229
- Gnat & Sternberg (2007) Gnat, O., & Sternberg, A. 2007, ApJS, 168, 213
- Gnat et al. (2010) Gnat, O., Sternberg, A., & McKee, C. F. 2010, ApJ, submitted (arXiv:1002.1309)
- Haardt & Madau (1996) Haardt, F. & Madau, P. 1996, ApJ, 461, 20
- Haardt & Madau (2001) Haardt, F. & Madau, P. 2001, arXiv:astro-ph/0106018
- Heitsch & Putman (2009) Heitsch, F., & Putman, M. E. 2009, ApJ, 698, 1485
- Howk et al. (2009) Howk, J. C., Ribaudo, J. S., Lehner, N., Prochaska, J. X., & Chen, H.-W. 2009, MNRAS, 396, 1875
- Hulsbosch & Wakker (1988) Hulsbosch, A. N. M., & Wakker, B. P. 1988, A&AS, 75, 191
- Indebetouw & Shull (2004) Indebetouw, R., & Shull, J. M. 2004, ApJ, 605, 205
- Jenkins (1996) Jenkins, E. B. 1996, ApJ, 471, 292
- Jensen et al. (2005) Jensen, A. G., Rachford, B. L., & Snow, T. P. 2005, ApJ, 619, 891
- Kalberla et al. (2005) Kalberla, P. M. W., Burton, W. B., Hartmann, D., Arnal, E. M., Bajaja, E., Morras, R., & Pöppel, W. G. L. 2005, A&A, 440, 775
- Kalberla & Haud (2006) Kalberla, P. M. W., & Haud, U. 2006, A&A, 455, 481
- Kerr & Lynden-Bell (1986) Kerr, F. J., & Lynden-Bell, D. 1986, MNRAS, 221, 1023
- Kim Quijano et al. (2007) Kim Quijano, J. et al. 2007, STIS Instrument Handbook, Version 8.0, (Baltimore: STScI)
- Kimble et al. (1998) Kimble, R. A., et al. 1998, ApJ, 492, L83
- Konz et al. (2001) Konz, C., Lesch, H., Birk, G. T., & Wiechen, H. 2001, ApJ, 548, 249
- Konz et al. (2002) Konz, C., Brüns, C., & Birk, G. T. 2002, A&A, 391, 713
- Lehner (2002) Lehner, N., 2002, ApJ, 578, 126
- Lehner et al. (2001) Lehner, N., Sembach, K. R., Dufton, P. L., Rolleston, W. R. J., & Keenan, F. P., ApJ, 551, 781
- Lehner et al. (2008) Lehner, N., Howk, J. C., Keenan, F. P., & Smoker, J. V. 2008, ApJ, 678, 219
- Lin et al. (1995) Lin, D. N. C., Jones, B. F., & Klemola, A. R. 1995, ApJ, 439, 652
- Lu et al. (1998) Lu, L., Savage, B. D., Sembach, K. R., Wakker, B. P., Sargent, W. L. W., & Oosterloo, T. A. 1998, AJ, 115, 162
- Lu et al. (1994) Lu, L., Savage, B. D., Sembach, K. R. 1994, ApJ, 437, L119
- Maller & Bullock (2004) Maller, A. H., & Bullock, J. S. 2004, MNRAS, 355, 694
- Mastropietro et al. (2005) Mastropietro, C., Moore, B., Mayer, L., Wadsley, J., & Stadel, J. 2005, MNRAS, 363, 509
- Mathewson et al. (1974) Mathewson, D. S., Cleary, M. N., & Murray, J. D. 1974, ApJ, 190, 291
- Mathewson et al. (1977) Mathewson, D. S., Schwarz, M. P., & Murray, J. D. 1977, ApJ, 217, L5
- Matteucci (2001) Matteucci, F. 2001, ASSL, 253
- Matthews et al. (2009) Matthews, D., Staveley-Smith, L., Dyson, P., & Muller, E. 2009, ApJ, 691, L115
- McClure-Griffiths et al. (2008) McClure-Griffiths, N. M., et al. 2008, ApJ, 673, L143
- Meyer et al. (1998) Meyer, D. M., Jura, M., & Cardelli, J. A. 1998, ApJ, 493, 222
- Misawa et al. (2009) Misawa, T., Charlton, J. C., Kobulnicky, H. A., Wakker, B. P., Bland-Hawthorn, J. 2009, ApJ, 695, 1382
- Moore & Davis (1994) Moore, B., & Davis, M. 1994, MNRAS, 270, 209
- Moos et al. (2000) Moos, H. W., et al. 2000, ApJ, 538, L1
- Morras et al. (2000) Morras, R., Bajaja, E., Arnal, E. M., & Pöppel, W. G. L. 2000, A&AS, 142, 25
- Morton (2003) Morton, D. C. 2003, ApJS, 149, 205
- Morton (2004) Morton, D. C. 2004, ApJS, 151, 403
- Murali (2000) Murali, C. 2000, ApJ, 529, L81
- Murray & Lin (2004) Murray, S. D., & Lin, D. N. C. 2004, ApJ, 615, 586
- Nidever et al. (2008) Nidever, D. L., Majewski, S. R., Burton, W. B. 2008, ApJ, 679, 432
- Nigra et al. (2009) Nigra, L., Stanimirović, S., Gallagher, J. S., Lockman, F. J., Nidever, D. L., & Majewski, S. R. 2009, arXiv:astro-ph/0908.4218
- Pagel & Patchett (1975) Pagel, B. E. J., & Patchett, B. E. 1975, MNRAS, 172, 13
- Peek et al. (2008) Peek, J., Putman, M., & Sommer-Larsen, J. 2008, ApJ, 674, 227
- Putman et al. (2003a) Putman, M. E., Staveley-Smith, L., Freeman, K. C., Gibson, B. K., & Barnes, D. G. 2003a, ApJ, 586, 170
- Putman et al. (2003b) Putman, M. E., Bland-Hawthorn, J., Veilleux, S., Gibson, B. K., Freeman, K. C., & Maloney, P. R. 2003b, ApJ, 597, 948
- Quilis & Moore (2001) Quilis, V., & Moore, B. 2001, ApJ, 555, L95
- Rex et al. (2008) Rex J., Li W., Filippenko A. V. 2008, CBET, 1437, 1
- Richter (2006) Richter, P. 2006, Rev. Mod. Astron., 19, 31
- Richter et al. (2001) Richter, P., Sembach, K. R., Wakker, B. P., & Savage, B. D. 2001, ApJ, 562, L181
- Richter et al. (2005) Richter, P., Westmeier, T., & Brüns, C. 2005, A&A, 442, L49
- Richter et al. (2009) Richter, P., Charlton, J. C., Fangano, A. P. M., Ben Bekhti, N., & Masiero, J.R. 2009, ApJ, 695, 1631
- Russell & Dopita (1992) Russell, S. C., & Dopita, M. A. 1992, ApJ, 384, 508
- Sahnow et al. (2000) Sahnow, D., et al. 2000, ApJ, 538, L7
- Sahu (1998) Sahu, M. S. 1998, AJ, 116, 1205
- Savage & Sembach (1991) Savage, B. D., & Sembach, K. R. 1991, ApJ, 379, 245
- Savage et al. (2000) Savage, B. D., et al. 2000, ApJS, 129, 563
- Sembach & Savage (1992) Sembach, K. R., & Savage, B. D. 1992, ApJS, 83, 147
- Sembach et al. (1995) Sembach, K. R., Savage, B. D., Lu, L., & Murphy, E. M. 1995, ApJ, 451, 616
- Sembach & Savage (1996) Sembach, K. R., & Savage, B. D. 1996, ApJ, 457, 211
- Sembach et al. (1999) Sembach, K. R., Savage, B. D., Lu, L., & Murphy, E. M. 1999, ApJ, 515, 108
- Sembach et al. (2001) Sembach, K. R., Howk, J. C., Savage, B. D., & Shull, J. M., 2001, AJ, 121, 992
- Sembach et al. (2003) Sembach, K. R., et al. 2003, ApJS, 146, 165
- Sembach et al. (2004) Sembach, K. R., et al. 2004, ApJS, 150, 387
- Shull et al. (1999) Shull, J. M., Roberts, D., Giroux, M. L., Penton, S. V., & Fardal, M. A. 1999, AJ, 118, 1450
- Shull et al. (2009) Shull, J. M., Jones, J. R., Danforth, C. W., & Collins, J. A. 2009, ApJ, 699, 754
- Slavin et al. (1993) Slavin, J. D., Shull, J. M., & Begelman, M. C. 1993, ApJ, 407, 83
- Smoker et al. (2005) Smoker, J. V., Keenan, F. P., Thompson, H. M. A., Brüns, C., Muller, E., Lehner, N., Lee, J.-K., & Hunter, I. 2005, A&A, 443, 525
- Songaila (1981) Songaila, A. 1981, ApJ, 243, L19
- Spitzer (1996) Spitzer, L. Jr. 1996, ApJ, 458, L29
- Stanimirović et al. (2002) Stanimirović, S., Dickey, J. M.; Krčo, M., & Brooks, A. M. 2002, ApJ, 576, 773
- Stanimirović et al. (2008) Stanimirović, S. Hoffman, S., Heiles, C., Douglas, K. A., Putman, M., & Peek, J. E. G. 2008, ApJ, 680, 276
- Thom et al. (2008) Thom, C., Peek, J. E. G., Putman, M. E., Heiles, C., Peek, K. M. G., & Wilhelm, R. 2008, ApJ, 684, 364
- Tripp et al. (2003) Tripp T. M., et al. 2003, AJ, 125, 3122
- Tripp et al. (2008) Tripp T. M., et al. 2008, ApJS, 177, 39
- Viegas (1995) Viegas, S. 1995, MNRAS, 276, 268
- Wakker & van Woerden (1997) Wakker, B. P. & van Woerden, H. 1997, ARA&A, 35, 217
- Wakker et al. (1999) Wakker, B. P., et al. 1999, Nature, 402, 388
- Wakker et al. (2001) Wakker, B. P., Kalberla, P. M. W., van Woerden, H., de Boer, K. S., & Putman, M. E. 2001, ApJS, 136, 537
- Wakker et al. (2002) Wakker, B. P., Oosterloo, T. A., & Putman, M. E. 2002, AJ, 123, 1953
- Wakker et al. (2003) Wakker, B. P., et al. 2003, ApJS, 146, 1
- Wakker (2006) Wakker, B. P. 2006, ApJS, 163, 282
- Wakker et al. (2007) Wakker, B. P., et al. 2007, ApJ, 670, L113
- Wakker et al. (2008) Wakker, B. P., York, D. G., Wilhelm, R., Barentine, J. C., Richter, P., Beers, T. C., Ivezić, Ž, & Howk, J. C. 2008, ApJS, 146, 1
- Wannier & Wrixon (1972) Wannier, P., & Wrixon, G. T. 1972, ApJ, 173, L119
- Weiner & Williams (1996) Weiner, B. J., & Williams, T. B. 1996, AJ, 111, 1156
- Westmeier & Koribalski (2008) Westmeier, T., & Koribalski, B. S. 2008, MNRAS, 388, L29
- Woodgate et al. (1998) Woodgate, B. E., et al. 1998, PASP, 110, 1183
- Zech et al. (2008) Zech, W. F., Lehner, N., Howk, J. C., Dixon, W. V. D., & Brown, T. M. 2008, ApJ, 679, 460
- Zsargó et al. (2003) Zsargó, J., Sembach, K. R., Howk, J. C., & Savage, B. D. 2003, ApJ, 586, 1019