A multi-wavelength approach to the properties of Extremely Red Galaxy populations: I - Contribution to the Star Formation Rate density and AGN content.
Abstract
We present a multi-wavelength analysis of the properties of Extremely Red Galaxy (ERG) populations, selected in the GOODS-South/Chandra Deep Field South field. By using all the photometric and spectroscopic information available on large deep samples of Extremely Red Objects (EROs, 645 sources), IRAC EROs (IEROs, 294 sources), and Distant Red Galaxies (DRGs, 350 sources), we derive redshift distributions, identify AGN powered and Star-formation powered galaxies, and, using the radio observations of this field, estimate robust (AGN- and dust-unbiased) Star Formation Rate Densities () for these populations. We also investigate the properties of “pure” (galaxies that conform to only one of the three ERG criteria considered) and “combined” (galaxies that verify all three criteria) sub-populations. Overall, a large number of AGN are identified (up to , based on X-rays, and mid-infrared criteria), the majority of which are type-2 (obscured) objects. Among ERGs with no evidence for AGN activity, we identify sub-populations covering a wide range of average star-formation rates, from below 10 yr-1 to as high as 200 yr-1. Applying a redshift separation ( and ) we find significant evolution (an increase of a factor of 2 or higher) of for EROs and DRGs, while none is observed for IEROs. The former populations can contribute more than 20% to the global at . The emission from AGN activity is typically not strong in the ERG population, with AGN increasing the average radio luminosity of ERG sub-populations by, nominally, less than 20%. AGN are common, however, and, if no discrimination is attempted, this could significantly increase the estimate (by over 100% in some cases). Thus, and while the contribution of star forming processes to the radio luminosity in galaxies with AGN remains uncertain, a comprehensive identification of AGN in these populations is necessary to obtain meaningful results.
1 Introduction
The study of high redshift galaxy populations is fundamental in understanding the formation and evolution of galaxies. One of the major difficulties in such studies is assembling an unbiased and representative sample of galaxies at high-redshift. With the advent of highly sensitive infrared detectors, both ground- and space-based, it has become clear that optical observations reveal only a small and very biased fraction of the galaxy population. This started with the Infrared Astronomical Satellite (IRAS) in the 1980s, which found a population of highly luminous galaxies, radiating most of their immense luminosity at infrared wavelengths (1-1000m, Sanders & Mirabel, 1996). At about the same time, ground-based telescopes using increasingly more efficient near-infrared (NIR, 1-2.2) detectors, allowed the detection of very red galaxies (e.g. Elston et al., 1988; Thompson et al., 1999). More recently, observations at (sub-) millimeter wavelengths revealed a population of distant massive galaxies, unseen at optical wavelengths, going through intense (and likely short) episodes of star-formation (SF) activity, possibly leading to the formation of present-day ellipticals (e.g. Barger et al., 1998; Hughes et al., 1998). It is now clear that understanding the universe requires deep multiwavelength observations to build up a complete picture of the processes occurring early in the evolution of galaxies.
In an attempt to constrain hierarchical models of galaxy formation, the last few years have seen optical-to-infrared or infrared-to-infrared color criteria being used to find high-redshift galaxies hosting evolved stellar populations. Extremely Red Objects (EROs, Roche et al., 2003), IRAC-selected EROs (IEROs, also known as IR Extremely Red Objects, Yan et al., 2004) and Distant Red Galaxies (DRGs, Franx et al., 2003) were thought to identify old passively evolving galaxies at increasing redshifts (from for the EROs/IEROs to for the DRGs), for which a prominent 4000 Å break would fall between the observed bands. These techniques, however, are also sensitive to active (star-forming, AGN or both) high-redshift dust-obscured galaxies, with intrinsically red spectral energy distributions (Smail et al., 2002; Alexander et al., 2002; Afonso et al., 2003; Papovich et al., 2006). These active members of the Extremely Red Galaxy population (ERGs, as we will collectively call EROs, IEROs, and DRGs) are also important targets for further study given that they constitute a dusty population of galaxies easily missed at optical wavelengths (e.g. Afonso et al., 2003). A challenge in studying the nature of the red galaxy population is the difficulty in disentangling the effects due to redshift, dust-obscuration, and old stellar populations.
Identifying the so-called “Passively Evolving” and “Dusty” ERGs is a fundamental and particularly difficult task, where optical spectroscopic observations are of limited use. The identification and study of Active Galactic Nuclei (AGN) or star-formation (SF) activity in these galaxies, for example, requires multi-wavelength data from X-ray to radio wavelengths. Radio observations are of particular interest here, given the possibility to reveal the activity in these obscured systems and, for star-forming dominated galaxies, allowing for a dust-free estimate of their SF rates (SFRs).
In this paper we present a comparative study of the ERG population. Using the broad and deep wavelength coverage in the Great Observatories Origin Deep Survey (GOODS)-South/Chandra Deep Field South field, we select samples of EROs, IEROs, and DRGs and estimate their statistical properties. With the extensive photometric data available we explore the redshift distribution, SFRs, and AGN activity in these galaxies. Using radio stacking we estimate dust-free SFRs and the contribution of red galaxy populations with no detected AGN activity to the global SFR density ().
The structure of the paper is as follows. Sample selection is described in Section 2. Section 3 addresses the AGN identification technique. In Section 4 the ERG sample is characterized, leading to the estimate of the dust- and AGN-unbiased contribution to . Finally, the conclusions are presented in Section 5.
Throughout this paper we use the AB magnitude system111When necessary the following relations are used:
()AB = ()Vega + (1.841, 1.373, 0.904, 0.403) from Roche et al. (2003);
IRAC: ([3.6], [4.5], [5.8], [8.0])AB = ([3.6], [4.5], [5.8], [8.0])Vega + (2.79, 3.26, 3.73, 4.40) from http://spider.ipac.caltech.edu/staff/gillian/cal.html, and a CDM cosmology is assumed with H km s-1 Mpc-1, , .
2 Sample Selection
GOODS was designed to assemble deep multi-wavelength data in two widely separated fields: the Hubble Deep Field North (HDF-N/GOODS-N) and the Chandra Deep Field South (CDF-S/GOODS-S). Specifically the southern field — GOODS-S — includes X-ray observations with Chandra and XMM-Newton; optical () high resolution imaging with the ACS on board the Hubble Space Telescope HST; near-infrared (NIR) and mid-infrared (MIR) coverage with the Very Large Telescope (VLT) and the Spitzer Space Telescope, respectively; and radio imaging with the Australia Telescope Compact Array (ATCA), Very Large Array (VLA), and Giant Metrewave Radio Telescope (GMRT). These data are among the deepest ever obtained. Large programs aiming at comprehensive spectroscopic coverage of this field are also being performed. The quality and depth of such data make these fields ideal to perform comprehensive studies of distant galaxies and, in particular, of the ERG population.
We use the FIREWORKS -band selected catalog from GOODS-South (Wuyts et al., 2008). This provides reliable photometry from UV to IR wavelengths (0.2-24m) for each source detected in the ISAAC/VLT maps (ISAAC GOODS/ADP v1.5 Release), thus covering an area broadly overlapping the HST ACS observations. The widely different resolutions between optical and infrared bands are properly handled to allow consistent color measurements. This is performed by adjusting the optical HST and NIR VLT images to a common resolution, and performing photometry on optical, IRAC, and MIPS images, using the prior knowledge about position and extent of sources from the -band images.
Redshift estimates are also provided. We only use spectroscopic observations to get redshifts with which to derive the intrinsic luminosities of ERGs. Only good spectroscopic redshift determinations (quality flag equal or greater than 0.5 in Wuyts et al., 2008) were considered, comprising 21% of the ERGs (Table 1). For the remaining sources, photometric redshift estimates from the FIREWORKS catalog were considered. The redshift distributions will be discussed in Section 4.1.
The FIREWORKS catalog contains 6308 selected sources. To allow for robust selection of our ERG populations we impose a magnitude completeness limit of AB (S/N) and, following the prescription for robust photometric samples from Wuyts et al. (2008), adopt a pixel weight limit of w222See Section 3.4 of Wuyts et al. (2008) for a description of the concept of pixel weight.. This results in a final -selected catalog of 4740 sources with robust photometry.
2.1 Red Galaxy Samples
We consider three categories of ERGs:
Whenever a source is not detected in one of the bands, a limit to its magnitude is assumed (we adopt the flux level based on the local rms provided in the catalog). In the case of unreliable photometry (e.g., w), the corresponding source is not considered further. Thus, only ERGs with robust photometry in both bands (or with a non-detection in the shorter wavelength band) used for their identification are considered.
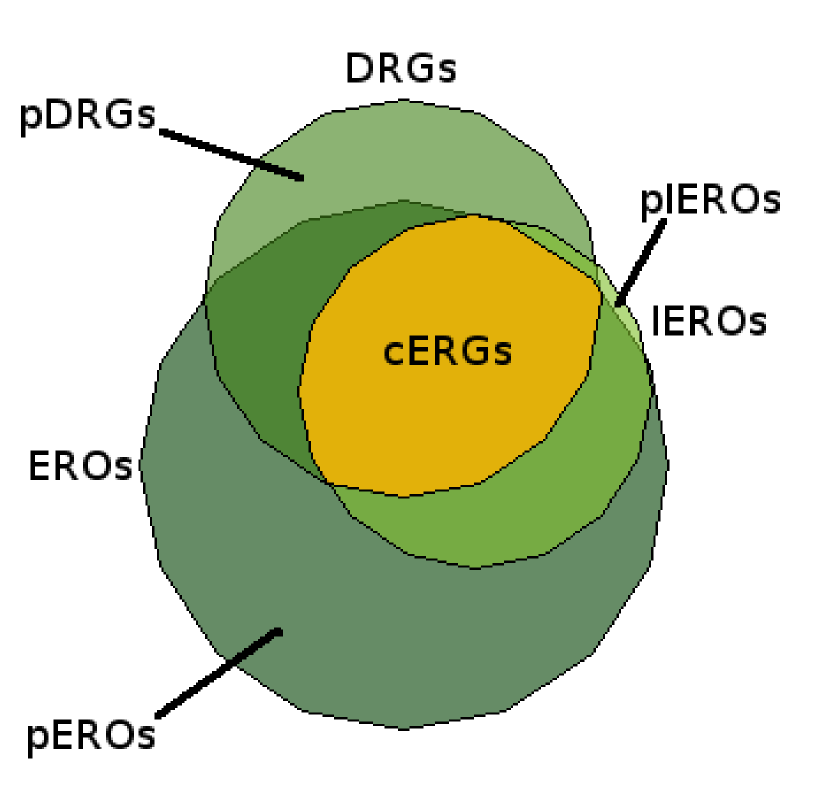
The resulting ERG sample, with robust photometry, contains 731 objects: 645 EROs, 294 IEROs, and 350 DRGs, down to the adopted magnitude limit of AB. These classifications overlap, with individual objects potentially included in more than one classification. This is illustrated in Figure 1.
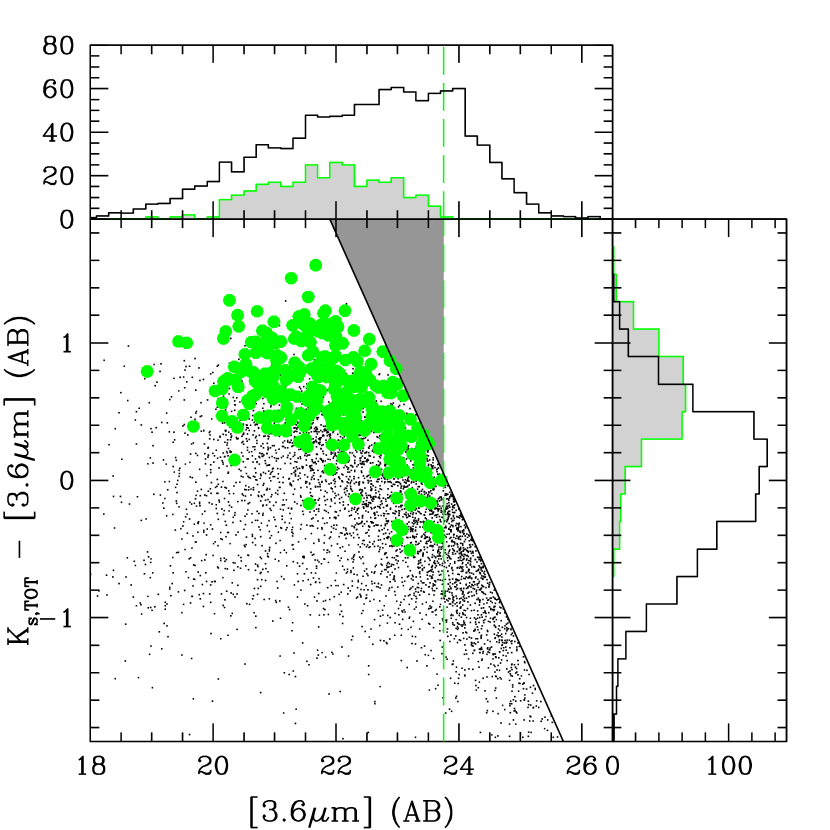
It should be noted that FIREWORKS is a selected catalog. As such, EROs and DRGs are selected according to the traditional definition, but IEROs selected from the FIREWORKS catalog are in effect -detected IEROs. This sample will only be representative of the true IERO population in the absence of a significant number of very red IEROs, which are undetected in the image. One should also note that the detection limit (the current selected sample includes sources with up to 27 mag) imposes a [3.6]-band magnitude limit of 23.75 mag for the IERO sample.
Figure 2 shows the color-magnitude distribution for sources in the FIREWORKS catalog and for the -detected IERO sample, displaying our adopted -band magnitude limit (diagonal line) and the practical [3.6]-band magnitude limit (vertical line). The sampled region at and (below the diagonal line and to the left of the vertical one) does not indicate a major incompleteness for the critical region (above the diagonal line and to the left of the vertical one). For example, allowing all FIREWORKS sources to be considered (up to a -band magnitude of 24.3 mag), would only increase the IERO sample by 6% (17 new IEROs). Consequently, we consider our sample of (-detected) IEROs representative of the true IERO population and find it unnecessary to assemble a separate sample of IEROs from a 3.6 m selected catalog, thus maintaining the photometric homogeneity within the ERG sample.
2.2 Sub-classes of ERGs
We refer to those sources that appear in only one of these classes (ERO, IERO, or DRG) as “pure” populations, while those that are simultaneously included in three ERG categories are referred to as the “common” population. In this work, the latter will be referred to as “common” ERGs, or cERGs. When addressing both the “pure” and “common” populations we will restrict ourselves to those sources which have sufficient information for a definitive classification in each of the three red galaxy criteria (either good photometry or robust upper limits in all bands used for classification). With such requirements, we find 702 ERGs: 626 EROs, 289 IEROs, and 338 DRGs. Essentially all IEROs (290 out of 294333Number of IEROs with good photometry in the , , and 3.6m bands.) are also EROs and more than two-thirds (198 out of 289) are also classified as DRGs; there are 267 sources that comply with both the ERO and DRG criteria, and 197 ERGs that are simultaneously classified as ERO, IERO, and DRG (the cERGs). Identified as “pure” sources are 272 pure EROs (pEROs), 3 pure IEROs (pIEROs), and 70 pure DRGs (pDRGs).
3 Multi-wavelength AGN identification and classification
One of the major problems for the characterization of ERGs, or for any distant galaxy population, is to identify the presence of AGN activity. The many techniques that exist target different AGN types and redshift ranges, and no single technique can guarantee a high discriminatory success rate. X-rays, radio or MIR, originating from different regions in the vicinity of the AGN, and differently affected by dust obscuration, provide independent ways to reveal such activity. Hence, we use the multi-wavelength data available in this field to carry out a thorough identification and classification of AGN activity in the ERG population.
3.1 Optical Spectroscopy
Optical line ratios will only reveal AGN activity if most of the galaxy’s line emission comes from the environment near the AGN and if the dust obscuration is not significant. In the case of obscured AGN activity, the emission from any disk SF may dominate the optical line emission. Also, since ERGs are intrinsically UV/optically faint, spectroscopy will be of limited use to reveal their nature. Overall, there are only 11 spectroscopic AGN identifications (narrow line AGN or QSO type-2 classifications), galaxies which are also identified as AGN by the criteria described in the following sections.
Spectroscopy also allows for the rejection of galactic stars selected as EROs. In this sample, 4 were found and discarded from further study.
3.2 X-Rays
X-ray emission is arguably the most effective discriminator of AGN activity in a galaxy. Due to the sensitivity levels currently reached with the deepest observations (the 2 Ms CDF fields: Alexander et al., 2003; Luo et al., 2008), the most powerful AGN ( erg s-1) can be detected beyond the highest redshift currently observed, . On the other hand, both low luminosity AGN and vigorous starforming galaxies ( erg s-1) can only be detected out to . If enough signal is detected, detailed spectral analysis can be used to distinguish between AGN and SF activity as the origin of the X-ray emission.
In this work, the ERG sample was cross-matched with the recent catalogs from the 2 Ms Chandra observations (Luo et al., 2008). For the region considered here – GOODS-S ISAAC – the X-ray observations reach aim-point sensitivity limits of and erg cm-2 s-1 for the soft (0.5–2.0 keV) and hard (2–8 keV) bands, respectively.
X-ray detections were searched for within 2″ of each ERG position. Counterparts were found for 84 of the 645 EROs (13%), 47 of the 294 IEROs (16%), and 51 of the 350 DRGs (15%) (see Table 1). These detection fractions are consistent with those found by Alexander et al. (2002), for EROs, and Papovich et al. (2006), for DRGs.
We adopt the X-ray classification criteria from Szokoly et al. (2004), which considers both the X-ray Luminosity (), estimated from the 0.5–8 keV flux, and hardness ratio (HR), calculated using the count rates in the hard band (HB, 2–8 keV) and in the soft band (SB, 0.5–2 keV) bands: HR = (HB-SB)/(HB+SB). This is listed as follows:
The rest-frame X-ray luminosity is calculated as:
where is the luminosity distance in (cm), fX is the X-ray flux (erg s-1 cm-2) in the 0.5-8 keV band and the photon index is assumed to be (Tozzi et al., 2006). The luminosity distance is calculated using either the spectroscopic redshift or, if not available, the photometric redshift estimate.
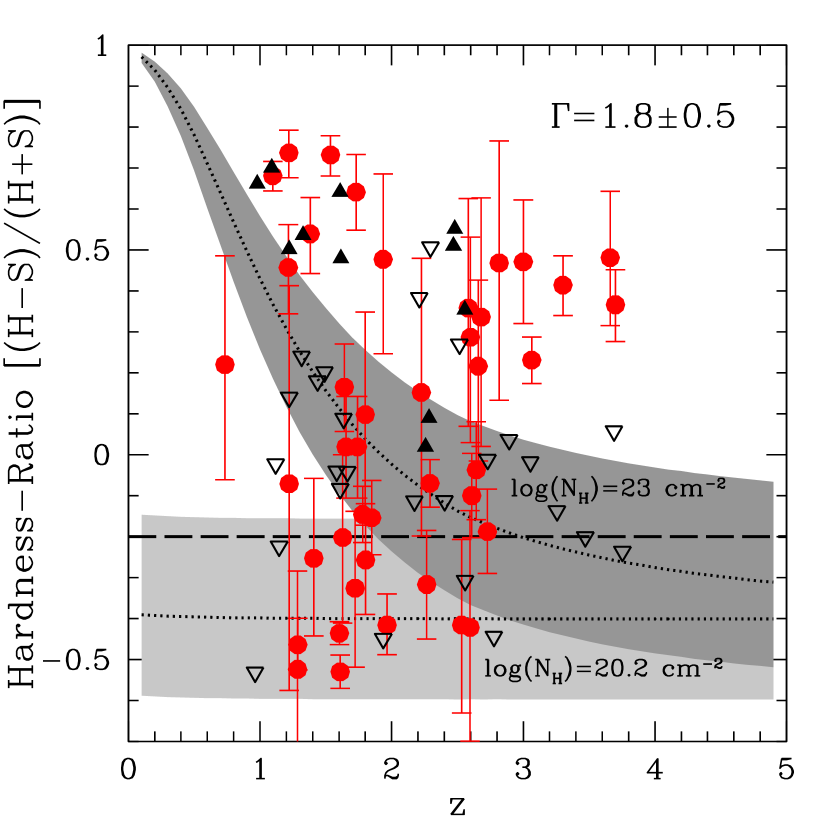
In total, these criteria enable the identification of 86 sources hosting an AGN with only 6 X-ray sources powerful enough to be classified as QSOs. The majority of the AGN are classified as type-2 sources: 41 X-ray detections have (i.e., obscured) while only 19 show lower values (with the remaining 26 having uncertain HR determinations, with no discrimination possible), indicating a possible 2:1 obscured to unobscured ratio. However, no constraints on the ratio of type-2 to type-1 AGN can be established, since becomes degenerate as an obscuration measure above , except for the most heavily obscured AGN(cm-2; see, for example, Alexander et al., 2005). Figure 3 shows the -redshift evolution for simple obscured and unobscured AGN X-ray emission models, together with the X-ray detected AGN ERGs. Although Type-2 sources seem to dominate (Table 1), an X-ray estimate of the Type-2 to Type-1 AGN ratio among such high-redshift populations would require observations extending to lower X-ray energies (0.5 keV) below those reliably achieved by Chandra.
3.3 Mid-Infrared
Over the last few years with the sensitivity of IRAC and MIPS onboard Spitzer, several MIR criteria have been developed for the identification of AGN at the center of galaxies. A power-law (PL) MIR spectral energy distribution (SED), for example, is characteristic of AGN emission (e.g. Donley et al., 2007). Somewhat more generic color–color diagrams have also been investigated, and AGN loci in such plots defined (e.g. Ivison et al., 2004; Lacy et al., 2004; Stern et al., 2005; Hatziminaoglou et al., 2005). This wavelength range is of particular interest for the ERG population, given their red SEDs. Here, we have applied MIR diagnostics to our ERG sample, as described below.
Observational data at X-ray and IR wavelengths provide complementary views of AGN activity. The most obscured AGN may be missed by even the deepest X-ray surveys but can still be identified by their hot-dust emission at IR wavelengths. On the other hand, depending on the amount of dust and its distribution, and on the AGN strength, the MIR emission from X-ray classified AGN may not be dominated by the hot dust in the vicinity of the AGN itself. A detailed comparison of the merits of AGN selection by the X-rays and the MIR was performed by Eckart et al. (2010), showing that only a multiwavelength combination of AGN criteria can help to overcome biases present in single-band selection. However, even the combination of MIR and X-rays will not result in complete AGN samples, as the identification of low power AGN will ultimately depend on the depth of the surveys. By performing this study in GOODS-S, with some of the deepest data both at X-ray and MIR wavelengths, we maximize the identification rate of AGN.
IRAC counterparts were found for practically all (98%) ERG sources. The vast majority (92%) are detected simultaneously in all IRAC bands: 612 of the 645 EROs, 290 of the 294 IEROs, and 322 of the 350 DRGs. The MIPS 24m detection rate is understandably lower (55%), given the lower relative sensitivity: 359/191/222 of the 645/294/350 EROs/IEROs/DRGs are detected (Table 1).
3.3.1 Classification: MIR spectral index
The IRAC fluxes for each ERG, covering the 3.6 – 8.0 m range, were fitted with a PL (), classifying as AGN sources those where (Donley et al., 2007). To increase its reliability, application of this technique was limited to sources simultaneously detected in all of the four IRAC bands, and the value was only accepted if the probability fit was .
This criterion reveals the existence of AGN in 6 (1%) EROs, 1 of which is also identified as an AGN in X-rays; in 4 (1%) of the IEROs, 1 of which have an X-ray AGN classification; and in 12 (3%) of the DRGs, none having an X-ray AGN classification (see Table 1).
3.3.2 Classification: MIR colors
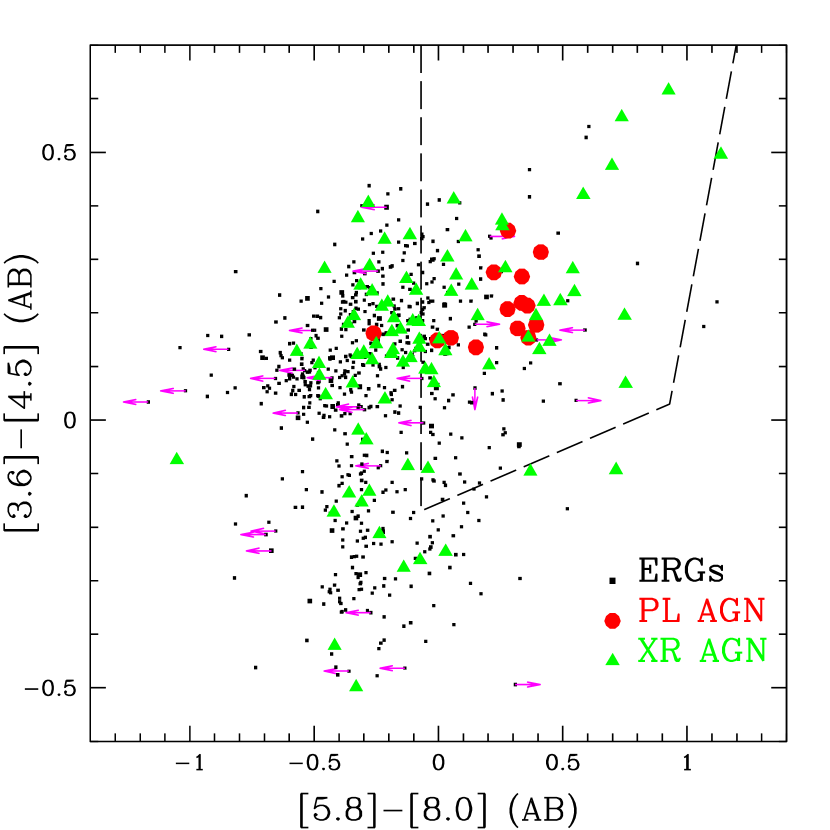
In recent years, several AGN color-selection criteria have been developed employing MIR IRAC observations (Ivison et al., 2004; Lacy et al., 2004; Stern et al., 2005; Hatziminaoglou et al., 2005). They are not completely independent from the PL criteria mentioned above, but are likely more sensitive to other kinds of AGN (e.g., QSOs or broad-line AGN, Lacy et al., 2004; Stern et al., 2005). Here we follow the criterion proposed by Stern et al. (2005), which identifies AGN from galaxy populations if they satisfy the following relations:
Figure 4 shows the distribution of ERGs on the color–color plot of Stern et al. (2005). It identifies as AGN 135 (21%) EROs, 27 of which are also classified as AGN from the X-rays; 83 (28%) IEROs, 21 of which also have an X-ray AGN classification; and 117 (33%) DRGs, 25 of which also appear as X-ray AGN. The relatively high number of potential AGN identified, over that revealed by the X-rays, is known and expected (Donley et al., 2007, and references therein).
3.3.3 MIR degeneracy at
One problem in using MIR photometry to identify AGN (with both PL and color–color criteria) arises at , as both star-forming galaxies and AGN start to merge into the same MIR color–color space. The main reason for this is the increasing relative strength of stellar emission in the MIR, as compared to that of an AGN, as redshift increases. At higher redshifts, a prominent 1.6 m stellar bump may pass through the IRAC bands, allowing for the detection of a steep spectral index not from AGN emission, but from the stellar emission alone.
At z2.5, the MIR spectral index method (see Section 3.3.1) identifies AGN in 3 EROs, 3 IEROs, and 10 DRGs, where none is identified through X-ray emission; on the other hand, the color–color method of Stern et al. (2005) classifies as AGN 51 EROs, 42 IEROs, and 76 DRGs, with 14, 11, and 16 (respectively) X-ray confirmed at these redshifts.
In the present work, this is not a serious problem, as most of the ERG sample (77%) lies at (see Section 4.1). Nevertheless, it should be noted that at higher redshifts, this could result in a likely overestimate of the presence of AGN. One can attempt to correct for this effect, by using the MIPS 24m observations: at , the 1.6 m bump will be shifted to the 6–10 m range. Therefore, in the absence of significant AGN emission, one expects a blue [8.0]-[24] color. We have investigated the [8.0]-[24] colors of ERGs, removing a MIR AGN classification whenever [8.0]-[24] 1. In this case, the observed MIR emission does not require an AGN component, but just a more or less evolved stellar population.
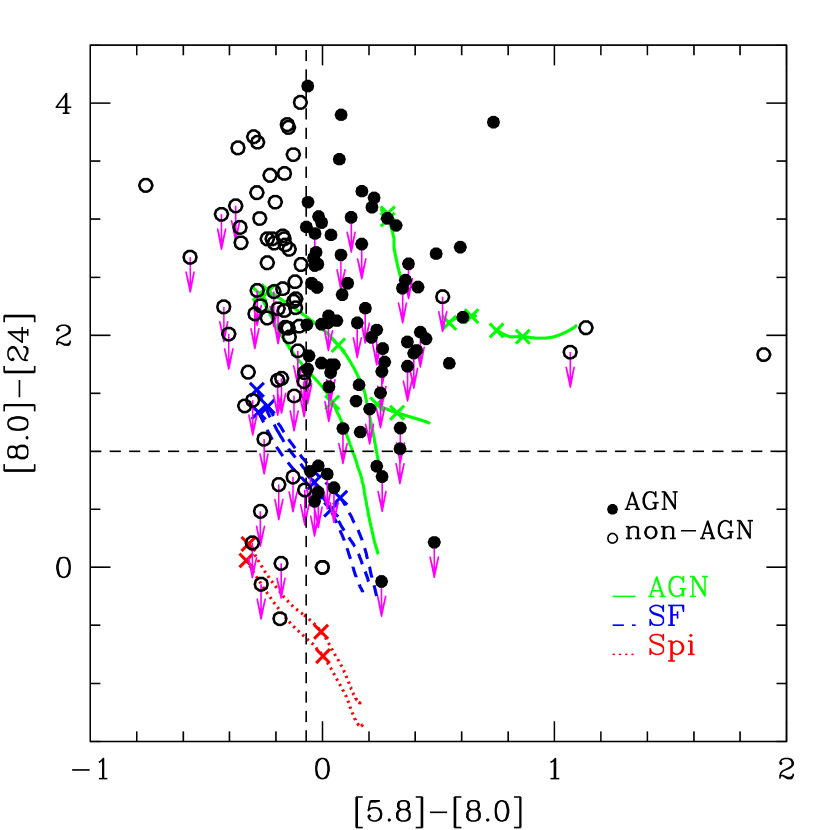
In Figure 5 we present the MIR [5.8]-[8.0] versus [8.0]-[24] color–color plot for ERGs in the current sample (highlighting those classified as AGN by the two MIR criteria referred to in Section 3.3.1 and Section 3.3.2). The tracks represent the expected colors of template SEDs when redshifted between and . All templates were taken from the SWIRE Template Library (Polletta et al., 2007), with the exception of the track in the upper right, corresponding to the extreme ERO of Afonso et al. (2001), the MIR emission of which is dominated by an obscured AGN. The vertical line indicates the [5.8]-[8.0] color constraint of the Stern et al. (2005) criterion, while the horizontal line shows our adopted color cut separating AGN and star-forming processes at these redshifts. The AGN template that crosses over this [8.0]-[24] threshold at the highest redshifts is IRAS 22491-1808, a mixture of AGN and stellar MIR emission, where the AGN component is progressively less sampled by the MIR bands as redshift increases. Concerning the current sample, the few high redshift () sources classified as AGN by the MIR criteria that appear below the [8.0]-[24] threshold, 10/7/10 EROs/IEROs/DRGs, do not require an AGN SED to explain their MIR emission and, consequently, their MIR AGN classification is removed. We note that the MIPS (24m) - IRAC colors have not yet been considered in detail as a way of selecting AGN/SF sources in deep MIR surveys (however, see Ivison et al., 2004; Lacy et al., 2004). Prompted by Figure 5 we are currently performing a detailed analysis of such colors as potential diagnostics for AGN behavior at high-z, to be presented in a subsequent paper.
We note the presence of two interesting sources in Figure 5. The one isolated in the upper right, is one of the seven optically unidentified radio sources found in Afonso et al. (2006, their source #42). Inspection of the and 24m images reveals no signs of blending, strengthening the accuracy of the 24m flux. This source also has X-ray emission characteristic of an AGN (). The FIREWORKS assigned photometric redshift is (in agreement with our own detailed ongoing investigation of this source, resulting in an estimate of using Hyper–). The high- obscured AGN scenario postulated in Afonso et al. (2006) for this source is thus strengthened. The color-track closest to this source in Figure 5 is that of the highly obscured AGN ERO found by Afonso et al. (2001).
The other interesting source is the bluest [8.0]-[24] 24m detection, with MIR colors characteristic of spiral galaxies. It is also X-ray detected but has no radio emission. This is a candidate for a high- evolved system with MIR colors typical of Spiral c type. The redshift assigned to this source, , is at the upper limit of the redshift range in which these type of sources have ever been found (Stockton et al., 2008). A few more galaxies fall in the same region of the color–color plot. Again they are candidates for Spiral type evolved systems whose study is relevant to constrain hierarchical models for the formation of galaxies.
3.4 Radio
Radio emission is essentially unaffected by dust obscuration, making it a highly desirable diagnostic for SF activity in ERGs. Since both SF and AGN activity can produce radio emission, it is often difficult or impossible to rely on radio properties alone to reveal the power source in a galaxy. Indications from radio spectral indices are of limited use, as both SF and AGN emission usually result from synchrotron radiation with , and only some AGN show signs of flat or even inverted radio spectra. Very high resolution VLBI radio imaging has also been used with limited success to impose limits on the size of the radio emitting region, identifying star-forming galaxies where the radio emission is resolved, and a possible AGN where not (Muxlow et al., 2005; Middelberg et al., 2008; Seymour et al., 2008). The only straightforward radio AGN criterion is the radio luminosity itself, as the highest luminosities can only be produced by the most powerful AGN.
Afonso et al. (2005) performed a detailed study of the sub-mJy radio population, and found star-forming galaxies with radio luminosities up to W Hz-1. We thus take this value as the upper limit for SF activity. We note that this value corresponds to an SFR of almost 2000 M☉ yr-1 (Bell, 2003, see Section 4.4). The existence of galaxies with higher rates of SF activity is unlikely.
For the current work we have used the 1.4 GHz ATCA observations of this field, which reach a uniform 14–17 Jy rms throughout the GOODS-S field (see Afonso et al., 2006; Norris et al., 2006, for more details).
We used as 3″matching radius to search for radio emission from the ERGs. In total 17 ERGs have reliable radio detections (): 15 EROs (2.5% of this population), 10 IEROs (3.3%), and 11 DRGs (3.1%). Only 3 of these sources have radio luminosities in excess of W Hz-1. They are also classified as AGN by the previous X-ray and MIR criteria. On the other hand, only 3 radio-detected ERGs are not classified as AGN by any of the adopted criteria. For these sources, the radio luminosity corresponds to SFRs of 93, 646, and 1584 yr-1 (using the conversion from Bell, 2003, see Section 4.4).
The small detection rate indicates that powerful AGN and the most intense starbursts are not common in the ERG population, as only sources with L W Hz-1 will be detected at with the sensitivity available even in the current deepest radio surveys.
4 Properties of ERGs
4.1 Redshift Distributions
As noted above, robust spectroscopic redshifts are available for around 21% of the ERG sample. Photometric redshift estimates are also available from the FIREWORKS catalog, covering almost the complete ERG sample.
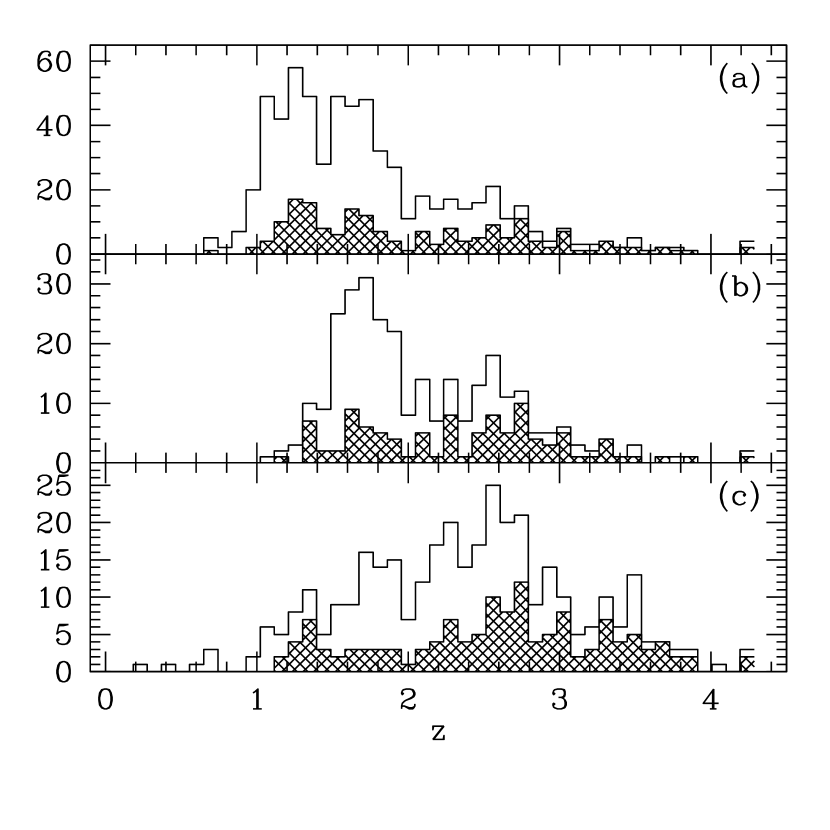
The redshift distributions for the ERO, IERO, and DRGs are shown in Figure 6. Although the range of redshifts sampled in all ERG classes is similar, the average value increases from for EROs, to for IEROs, and to for DRGs populations (in agreement with previous works, e.g. Conselice et al., 2008; Papovich et al., 2006). This was expected given the source selection, designed to identify objects at such redshifts.
The AGN in the ERG population follow a similar redshift distribution but the AGN fraction increases rapidly at higher redshifts. This will be addressed in the next section.
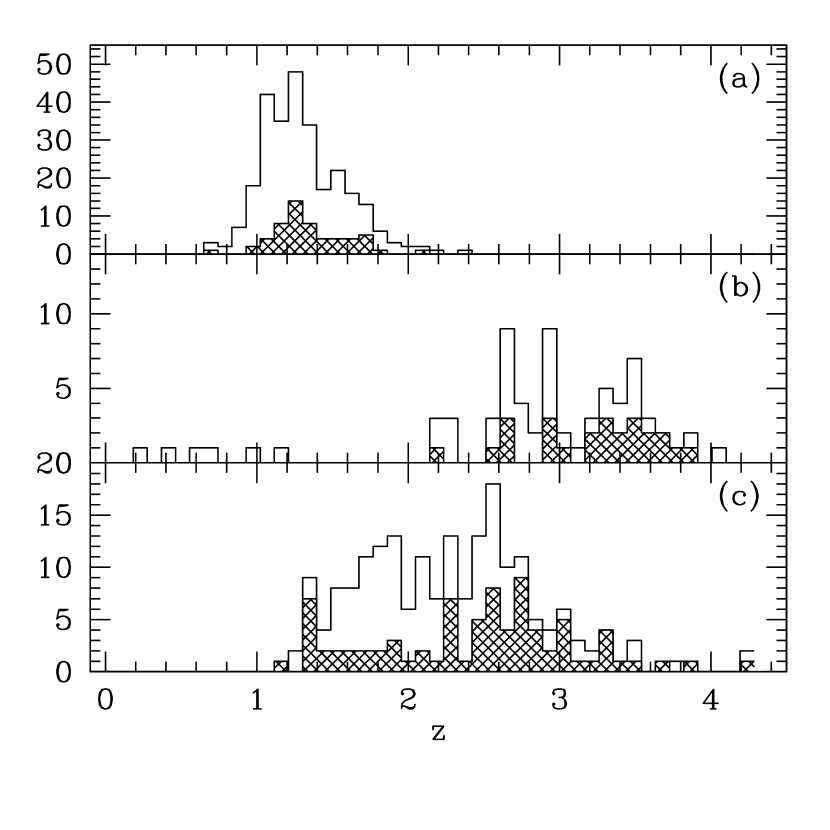
Figure 7 displays the redshift distributions once again but for pEROs, pDRGs, and cERGs (only 3 pIEROs exist, at redshifts and ). The redshift distribution of pEROs is quite narrow, selecting sources essentially at (peaking at ), while the pDRG population is notably small, and at higher redshifts (). The “pure” criteria thus appear to be good and easy techniques to select high-z sources in narrow distinct redshift bins. Sources classified as cERGs, appearing as red in all three ERG selection criteria, cover a broad redshift range, from to . There are no cERGs at , in this particular sample due to the IERO criterion.
4.2 AGN content of ERGs
As described in the previous section, several multi-wavelength indicators were used to identify AGN in the ERG population. The indicators have different sensitivities to AGN characteristics, such as distance, dust obscuration, or AGN strength. Their combination will, thus, allow for a more complete census of AGN content in these sources.
We do not find a numerous population of very powerful AGN among the ERGs, as given by the X-rays (L erg s-1, 6 ERGs) and radio (LW Hz-1, 3 ERGs) luminosities. These represent, respectively, only 0.8% and 0.2% of the ERG sample, comparable to the fraction observed in the complete -selected FIREWORKS sample, where 17 (0.4%) QSOs and 5 (0.1%) radio-powerful sources are found. Overall, we select 214 (29%) AGN-dominated systems in the ERG sample (29% for EROs, 35% for IEROs, and 39% for DRGs). This fraction increases from low to high redshift, from 22% at to 38% at . Among the X-ray identified AGN, 35% are also classified as such by the Stern ‘wedge’. Conversely, only 18% of the ‘wedge’ identified AGN are X-ray detected. All but one of the PL classified AGN fall inside the Stern ‘wedge’ (Figure 4), as expected from the non-independence of both indicators (as can be seen in the detailed comparison by Donley et al., 2008).
The high AGN fraction and its increase with redshift, might lead one to think that the MIR criteria are overestimating the number of AGN at high redshifts, even though a tentative correction was applied (see Section 3.3.3). We have investigated the AGN fraction evolution from to based, independently, on the X-ray and MIR indicators. In both wavebands, the AGN fraction increases significantly from low to high redshifts, rising from 9% to 16% when the X-ray is considered and from 15% to 29% when the MIR is considered. Although it seems possible that SF galaxies may still be affecting the MIR criteria at high redshift (see Section 3.3.3), most of the AGN fraction increase is consistent between the two wavelength indicators. This may partly be an effect of Malmquist bias, with lower luminosity systems, more likely to be dominated by SF, being progressively lost at higher redshift. In any case, this increase is consistent with the known history of AGN activity in the universe (Shaver et al., 1996; Hopkins et al., 2007).
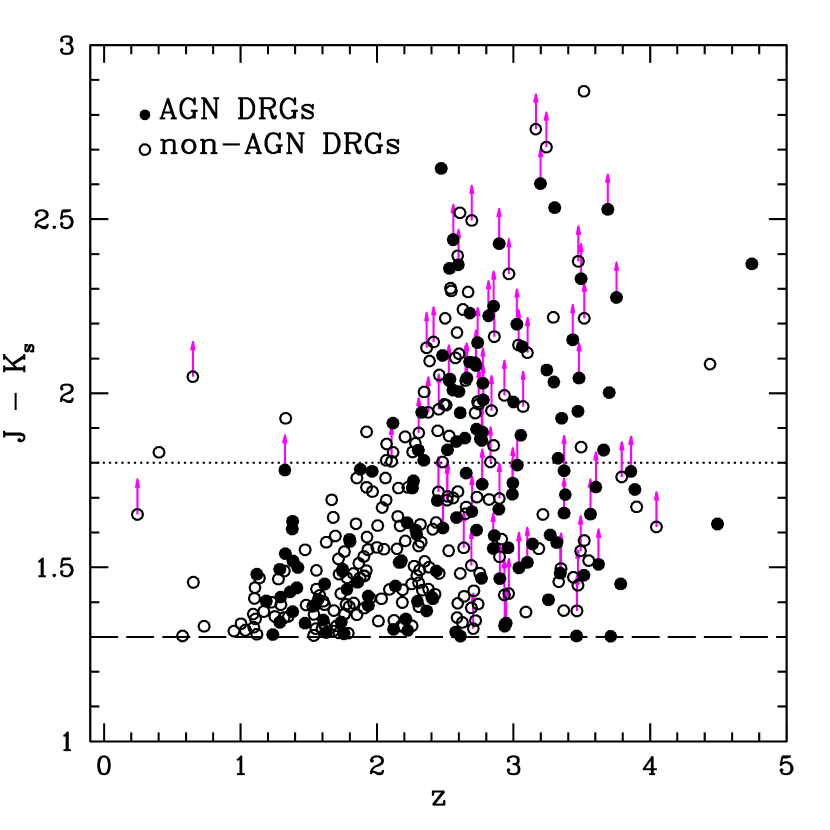
The AGN fraction is not a simple function of color, as shown in Figure 8. All three sub-populations (EROs, IEROs, and DRGs) have similar AGN fractions around the color threshold (), but show different behavior with increasing colors. The more extreme colors among the ERGs do not necessarily correspond to higher fraction of AGN identifications, and in fact, the opposite appears to be true for EROs. The AGN fraction is high only for the more “moderate” colors, decreasing for . The difference between the ERO and DRG trends result from each criterion itself. Redder colors will always select a population mostly at low- (), where the AGN fraction is shown to be smaller. On the other hand, redder constraints imply a higher fraction of high- () sources, where the AGN fraction is higher. For example, essentially no low- source has (Figure 9). The AGN fraction versus color trend of the IEROs lies between that of the EROs and DRGs, which could be driven by the redshift distribution of the IERO population, which also lies between that of the EROs and DRGs.
4.3 Radio Stacking
Another important aspect necessary in understanding the properties of ERGs is their SFR and the contribution of these populations to the overall SFR density of the universe. Dust obscuration is a serious source of uncertainty in estimating SFRs in ERGs from rest-frame ultraviolet luminosities. A SF diagnostic not affected by dust obscuration is radio emission. However, these galaxies are distant enough that even the deepest radio surveys are sensitive to only the brightest star-forming population (detection limits corresponding to several hundred yr-1 for ). Instead, stacking methods can be used to evaluate the statistical star-forming properties of ERGs. Stacking, as used here, is simply an “image stacking” procedure, where image sections centered at each desired source position (stamps) are combined. The aim is to reach much lower noise levels, possibly providing a statistical detection of samples whose elements are individually undetected in the original image.
For the radio stacking analysis we have used the 1.4 GHz ATCA observations of this field, reaching a uniform 14–17 Jy rms throughout the GOODS-S field (see Afonso et al., 2006; Norris et al., 2006, for more details). Our adopted stacking methodology can be summarized in the following steps.
First, using the radio image of the field, stamps of 60 by 60 pixels (equivalent to 120” by 120”) were deemed appropriate, allowing a good sampling of the vicinity of each source, necessary to identify strong neighboring sources that can bias the stacking.
Every stamp containing a radio source within an 18 radius from the central (ERG) position, was rejected. As the stacking will be used to estimate the average flux of the unidentified ERGs in the radio image, the inclusion of radio detections would likely bias the final result. In this context the term “detection” does not only apply to the robust detections (roughly at level), but also to the “possible” detections (all remaining candidate radio sources at ). Stamps having radio sources near the ERG position must also be excluded, as the wings of the radio detection can extend to the central part of the stamp.
The remaining stamps for each sample of ERGs can then be stacked. Previous work often uses median stacking (e.g., White et al., 2007), in an attempt to be robust to radio detections and high/low pixels. The penalty for this is the loss of sensitivity. Having removed all detections and possible detections from the list of stamps, we use a weighted average (weight=rms-2) stacking procedure. At each pixel position we further implement a rejection for outliers, rejecting high (low) pixels above (below) the () value for that pixel position. The number of rejected pixels in the central region is always very low () confirming that previous rejection steps work efficiently.
The final flux and the noise level are measured in the resulting stacked image. To evaluate the reliability of detections in the stacked images we performed Monte Carlo (MC) simulations. Random positions in the radio image were selected and stacked, following the procedure described above. Each of these positions were required to be farther than 6″from the known sources, as we are interested in evaluating systematics of the radio image alone. Appropriate numbers of stacked stamps were used, to compare to the actual ERG stacks. The procedure was repeated 10000 times for a given number of stamps. For further reference, a stacked sample will be considered to have produced a reliable detection only if no MC simulation (among 10,000) has resulted in a higher S/N value.
4.4 Star formation activity in ERGs
Following the procedure outlined above, we have performed a radio stacking analysis for different sub-groups within the ERG population. The radio data were stacked for each of the populations of EROs, IEROs, DRGs, pEROs, pDRGs, and cERGs. Within these samples, stacking of the radio images was also performed separately for AGN and non-AGN sub-populations. Since redshift estimates exist for the vast majority of the ERGs, stacking is performed separately for both low and high redshifts ( and 3, respectively). Besides minimizing biases in the stacking signal, due to different populations and different (radio) luminosities being sampled at different redshifts, this also allows us to search for a hint of any evolutionary trend. Given the incompleteness of the sample at the highest redshifts no attempt was made to perform a specific radio stacking analysis for ERGs. Table 2 lists the number of sources considered in each of the sub-populations and those in each of the stacking steps referred in the previous section.
While the stacking procedure enables the average flux to be estimated from the radio-undetected sample ( signal), the entire population should be considered when measuring the ERG contribution to the global SFR density of the universe. The approach adopted here was to consider all radio-undetected ERGs as having a radio flux given by the average signal from the stacking analysis, and all radio-detected ERGs444For this purpose, radio-detections refer to signals above in the radio map; see Section 4.3. to contribute with their measured flux density. The conversion from radio flux to radio luminosity is performed by using the assumed redshift (spectroscopic or photometric) and a radio spectral index of ():
where is the luminosity distance (cm) and is the 1.4 GHz flux density (mJy). The corresponding SFR is obtained using the calibration from Bell (2003):
where W Hz W Hz-1. The contribution to was estimated for individual galaxies using the method (Schmidt, 1968). The associated volume for each galaxy is estimated by using a -correction derived from the galaxy’s own SED (as given by the observed multi-wavelength photometry). Again, radio-detected ERGs, contributed with their estimated intrinsic luminosity and SFR, derived with the assigned redshift estimate and its detected flux. In Figure 10, the SFR distribution of these sources is presented. Those classified as SF (14 in total), range from 50 to 1600 yr-1 (in reasonable agreement with those presented in Georgakakis et al., 2006). On the other hand, the luminosity and SFR estimates of radio-undetected ERGs were based on the resulting stacking signal of the sample and, likewise, the individual ERG redshift value.
The results are given in Table 3. For each ERG sub-population we list: (1) the ERG sub-population; (2) the total number of sources in the sample; (3) the final number of stamps included in the stacking; (4) the rms of the final stacked image; (5) the measured flux in the central region of the stacked image; (6) the respective S/N; (7) number of Monte-Carlo simulations (out of 10000) that resulted in higher S/N values, a measure of the reliability of the ERG detection: conservatively, whenever the stacking signal is considered spurious; (8) the average redshift for the sub-population; (9) the average radio luminosity both for the radio non-detected sources – taking into account the stacking signal only – and, in parenthesis, that for the entire sub-population (including radio detected sources); (10) the average SFR, for non-AGN samples, corresponding to the radio luminosities in column (9); (11) the resulting radio luminosity density (); (12) the corresponding . For columns (9) to (12), the upper limits, corresponding to non-detections of the stacked signal (), are estimated using the maximum S/N found on the MC simulations. No stacking is attempted for populations with less than 10 stamps.
The analysis suggests that the bulk of the ERO population555In this section, while discussing the SF properties of ERGs, we will naturally be referring to the non-AGN sources, dropping the prefix ’n’ for simplicity. have modest SF activity. At , where most EROs are found, the average SFR is below a few yr-1. Only at , EROs – practically all (93%) being classified as DRGs – reveal intense average SFRs, yr-1, entering the Ultra Luminous Infrared Galaxies (ULIRG) regime. This suggests that at low- the passive/evolved systems represent a significant fraction of the ERO population (56%, see pEROs discussion ahead), as opposed to the high- regime where the dusty systems dominate. DRGs show the same trend although not as pronounced: they increase from yr-1 at to yr-1 at . Interestingly, at low redshifts (), 97% of DRGs (69 out of 71) are also classified as EROs; conversely only 20% of the low- EROs (69 out of 344) are also classified as DRGs. The estimated average SFR of yr-1 for this overlapping population supports previous claims of a dusty starburst nature for these sources (Smail et al., 2002; Papovich et al., 2006).
These values for the DRG population are comparable to those found in the literature (Rubin et al., 2004; Förster Schreiber et al., 2004; Knudsen et al., 2005; Reddy et al., 2005). Papovich et al. (2006) studied 153 DRGs selected also in the GOODS-S to a limiting magnitude of AB. They find an average SFR for the DRG population at of yr-1, which is somewhat higher than our result. This difference is attributable to the different methods of DRG selection. First, the DRG selection in Papovich et al. (2006) is slightly redder (0.06 mag) and restricted to brighter -band magnitudes (0.6 mag difference). The first alone would be responsible for an increase of 10% in our estimated SFR, while the latter effectively restricts the sample to stronger starbursts, increasing the average SFR by 30%: from 100 yr-1 at to 130 yr-1 at (see also Reddy et al., 2005). Second, we employ a more conservative AGN rejection, by using the full 2Ms Chandra data and rejecting essentially all sources classified as AGN from MIR color–color diagrams. Papovich et al. (2006) look at the individual MIR IRAC bands to re-classify as starforming a considerable number of DRGs flagged as AGN by Stern et al. (2005). Finally, the uncertainty in the different methods and associated calibrations (UV+IR luminosities versus Radio luminosities) used to estimate the SFR account for the remaining observed difference.
The low average SFR for EROs at is due to the numerous pEROs (193, 56% of the EROs): the stacking analysis of pEROs found in this redshift range fails to produce any signal. This population likely corresponds to the passively evolving component of EROs. On the other hand, pDRGs at must also be characterized by relatively low SFRs: although the stacking analysis is unable to give such indication (only constraining the average SFR to yr-1), pDRGs are the sources responsible for the observed difference of the average SFR of EROs and that of DRGs in this redshift range (all but 4 of these non-AGN EROs are also classified as DRGs). The pDRGs effectively dilute the stacking signal from 160 (200 if radio detections are included) yr-1 to yr-1. The latter should thus be taken as a better upper SFR limit than that obtained from the actual pDRG stack.
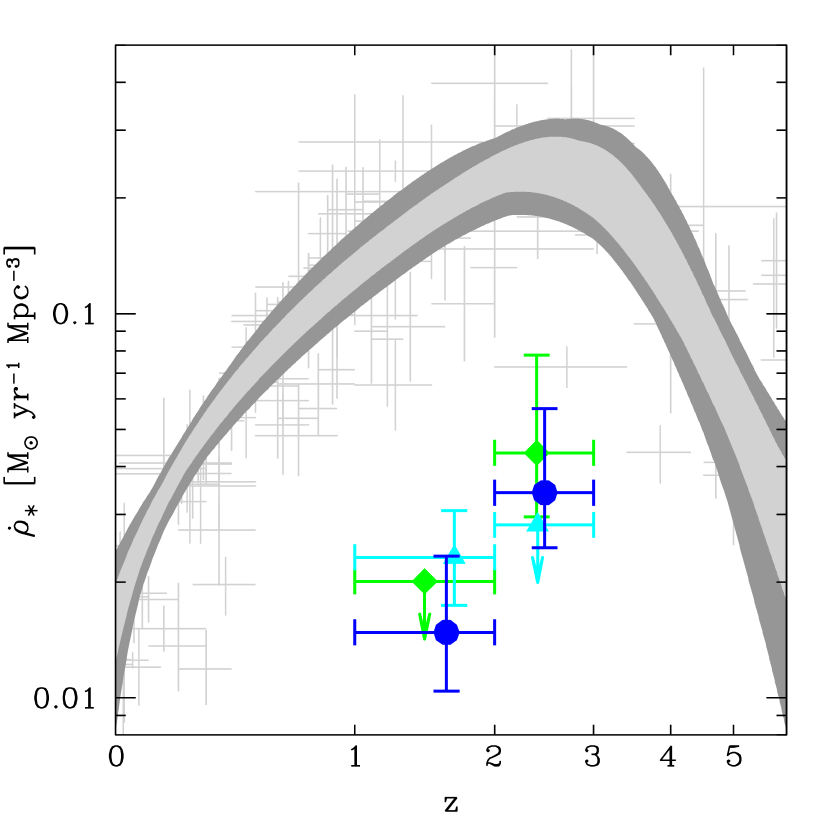
The SFR density behavior for ERGs roughly follows the general trend for SF galaxies, increasing from to (Figure 11). Overall, the ERG contribution to the total jumps from in the low redshift bin to around 20% at , where EROs are the highest contributors ( yr-1 Mpc-3). The exception is the IERO population which apparently, despite being the biggest contributor among the three populations at low-, shows no evolution between the two redshift intervals.
We finally highlight the fact that these estimates may be missing potentially significant SF from the ERGs classified as AGN. The implemented AGN identification criteria were applied in a very conservative way, possibly even removing some non-AGN galaxies from the non-AGN samples. Also, the SFRs associated with the AGN populations are obviously being discarded in this as in similar investigations. This separation is currently necessary given the lack of knowledge on how to remove the AGN contribution to the (radio) emission. The lack of powerful AGN in the ERG populations suggest omitting any attempted AGN exclusion, without significant detriment to the average SFR estimates: for example, the entire ERO population in the redshift range displays an average radio luminosity of W Hz-1, only 10% higher than that for the non-AGN EROs in the same redshift range666Note, however, that the increase for IEROs at reaches .. However, when no AGN discrimination is attempted, the numerous AGN sources would result in a much more significant increase for the SFR density estimate: in the previous example, the SFR density for the ERO population would rise by , from 0.04 to 0.1 yr-1 Mpc-3. The correct scenario will obviously be between the two extremes. A precise handling of such uncertainty can only be fully addressed once a significantly better understanding of the AGN-SF connection is achieved, and more discriminating diagnostics are developed (but see Dunne et al., 2009).
5 Conclusions
We have presented a multi-wavelength analysis of the properties of the ERG population in the GOODS-South field. EROs, IEROs, DRGs – and various combinations between these groups – are considered, their AGN content identified and their contribution to the global estimated, leading to the following conclusions.
-
•
The different criteria for the selection of red galaxies select, as previously known, sources at different redshift ranges: while the bulk of EROs and IEROs can be found at , DRGs are mostly found at . Different combinations of the three criteria result in samples with distinct redshift properties: while cERGs are observed in a wide redshift range, , and have no low- () interlopers, pEROs and pDRGs appear in distinct redshift intervals, at and , respectively. The “pure” criteria appear, thus, to be suitable and simple techniques to select high-z sources in well constrained redshift intervals. See Section 4.1.
-
•
the ERG population does not include a large number of powerful AGN, as indicated by the X-rays and radio observations. Almost one-third of the ERG sample hosts potential AGN activity, with the fraction of AGN increasing from EROs to IEROs to DRGs (respectively, 29%, 35%, and 38%). Among ERGs, and according to the X-ray properties, type-2 sources dominate (a 2:1 ratio). An X-ray estimate of the type-2 to type-1 AGN ratio among the ERG population is, however, indeterminate, requiring observations extending to lower X-ray energies (higher wavelengths). See Section 3.2 and Section 4.2.
-
•
EROs at are often pEROs (56%), which are likely passively evolved systems without strong SFR activity, on average below yr-1. On the other hand, essentially all EROs at are classified as DRGs and have intense SF activity, similar to ULIRGs (on average yr-1). DRGs also show this increase in average SFR from low () to high () redshifts, although not as pronounced (from to yr-1). See Section 4.4.
- •
-
•
The contribution of ERGs to the SFR density increases with redshift: from at to at , an increase which is attributable to the ERO and DRG populations. IEROs, on the other hand, despite showing the highest contribution to the global SF history among the three ERG population at low-, appear to show no evolution at high redshifts. See Section 4.4.
-
•
SFR densities from ERG populations were estimated for SF-dominated sources, after a thorough AGN multi-wavelength identification. We find that, although the AGN ERGs would only slightly increase the average radio luminosities shown by the non-AGN samples, inclusion of such sources in the SFR density estimates could lead to significant (and, at this point, undetermined) biases. See Section 4.4.
-
•
The use of a [5.8]-[8.0] versus [8.0]-[24] color diagnostic allows for a tentative separation between AGN and SF galaxies at , where mid-IR (3 to 8 m) diagnostics become degenerate. In particular, the use of this diagnostic enables the identification of a evolved system candidate with MIR colors typical of Sc galaxies. See Section 3.3.3.
References
- Afonso et al. (2001) Afonso, J., Mobasher, B., Chan, B., & Cram, L. 2001, ApJ, 559, 101
- Afonso et al. (2003) Afonso, J., Hopkins, A., Mobasher, B., & Almeida, C. 2003, ApJ, 597, 269
- Afonso et al. (2005) Afonso, J., Georgakakis, A., Almeida, C., Hopkins, A. M., Cram, L. E., Mobasher, B., & Sullivan, M. 2005, ApJ, 624, 135
- Afonso et al. (2006) Afonso, J., Mobasher, B., Koekemoer, A., Norris, R. P., Cram, L. 2006, AJ, 131, 1216
- Alexander et al. (2002) Alexander, D. M., Vignali, C., Bauer, F. E., Brandt, W. N., Hornschemeier, A. E., Garmire, G. P., & Schneider, D. P. 2002, AJ, 123, 1149
- Alexander et al. (2003) Alexander, D. M., et al. 2003, AJ, 126, 539
- Alexander et al. (2005) Alexander, D. M., Bauer, F. E., Chapman, S. C., Smail, I., Blain, A. W., Brandt, W. N., & Ivison, R. J. 2005, ApJ, 632, 736
- Barger et al. (1998) Barger, A. J., Cowie, L. L., Sanders, D.B., Fulton, E., Taniguchi, Y., Sato, Y., Kawara, K., & Okuda, H. 1998 Nature, 394, 248
- Bell (2003) Bell, Eric F. 2003, ApJ, 586, 794
- Conselice et al. (2008) Conselice, C. J., Bundy, K., Vivian, U., Eisenhardt, P., Lotz, J., & Newman, J. 2008, MNRAS, 383, 1366
- Donley et al. (2007) Donley, J. L., Rieke, G. H., Pérez-González, P. G., Rigby, J. R., & Alonso-Herrero, A. 2007, ApJ, 660, 167
- Donley et al. (2008) Donley, J. L., Rieke, G. H., Pérez-González, & Barro, G. 2008, ApJ, 687, 111
- Dunne et al. (2009) Dunne, L. et al. 2009, MNRAS, 394, 3
- Eckart et al. (2010) Eckart, M. E., McGreer, I. D., Stern, D., Harrison, F. A., & Helfand, D. J. 1988, ApJ, 708, 584
- Elston et al. (1988) Elston, R., Rieke, G. H., & Rieke, M. J. 1988, ApJ, 331, 77
- Förster Schreiber et al. (2004) Förster Schreiber, N. M., et al. 2004, ApJ, 616, 40
- Franx et al. (2003) Franx, M., et al. 2003, ApJ, 587, 79
- Georgakakis et al. (2006) Georgakakis, A., Hopkins, A. M., Afonso, J., Sullivan, M., Mobasher, B., Cram, L. E. 2006, MNRAS, 367, 331
- Hatziminaoglou et al. (2005) Hatziminaoglou, E., et al. 2005, AJ, 129, 1198
- Hopkins & Beacom (2006) Hopkins, A. M., Beacom, J. F. 2006, ApJ, 651, 142
- Hopkins et al. (2007) Hopkins, P. F., Richards, G. T., & Hernquist, L. 2007, ApJ, 654, 731
- Hughes et al. (1998) Hughes, D. H., et al. 1998 Nature, 394, 241
- Ivison et al. (2004) Ivison, R. J., et al. 2004, ApJS, 154, 124
- Knudsen et al. (2005) Knudsen, K. K., et al. 2005 ApJ, 632, 9
- Lacy et al. (2004) Lacy, M., et al. 2004, ApJS, 154, 166
- Luo et al. (2008) Luo, B., et al. 2008, ApJS, 179, 19
- Middelberg et al. (2008) Middelberg, E., Norris, R. P., Tingay, S., Mao, M. Y., Phillips, C. J., & Hotan, A. W. 2008, A&A, 491, 435
- Muxlow et al. (2005) Muxlow, T., et al. 2005, MNRAS, 358, 1159
- Norris et al. (2006) Norris, R. P., et al. 2006, AJ, 132, 2409
- Papovich et al. (2006) Papovich, C., et al. 2006, ApJ, 640, 92
- Polletta et al. (2007) Polletta, M., et al. 2007, ApJ, 663, 81
- Reddy et al. (2005) Reddy, N. A., Erb, D. K., Steidel, C. C., Shapley, A. E., Adelberger, K. L., & Pettini, M. 2005, ApJ, 633, 748
- Rieke et al. (2009) Rieke, G. H., et al. 2009, ApJ, 692, 556
- Roche et al. (2003) Roche, N. D., Dunlop, J., & Almaini, O. 2003, MNRAS, 346, 803
- Rubin et al. (2004) Rubin, K. H. R., van Dokkum, P. G., Coppi, P., Johson, O., Förster Schreiber, N. M., Franx, M., & van der Werf, P. 2004, ApJ, 613, 5
- Sanders & Mirabel (1996) Sanders, D., & Mirabel, I. 1996, ARA&A, 34, 749
- Schmidt (1968) Schmidt, M. 1968, ApJ, 151, 393
- Seymour et al. (2008) Seymour, N., et al. 2008, MNRAS, 386, 1695
- Shaver et al. (1996) Shaver, P. A., Wall, J. V., Kellermann, K. I., Jackson, C. A., & Hawkins, M. R. S. 1996, Nature, 384, 439
- Smail et al. (2002) Smail, I., Owen, F. N., Morrison, G. E., Keel, W. C., Ivison, R. J., & Ledlow, M. J. 2002, ApJ, 581, 844
- Stern et al. (2005) Stern, D., et al. 2005, ApJ, 631, 163
- Stockton et al. (2008) Stockton, A., McGrath, E., Canalizo, G., Iye, M., & Maihara, T. 2008, ApJ, 672, 146
- Szokoly et al. (2004) Szokoly, G. P., et al. 2004, ApJS, 155, 271
- Thompson et al. (1999) Thompson, D., et al. 1999, ApJ, 523, 100
- Tozzi et al. (2006) Tozzi, P., et al. 2006, A&A, 451, 457
- Yan et al. (2004) Yan, H., et al. 2004, ApJ, 616, 63
- White et al. (2007) White, R. L., Helfand, D. J., Becker, R. H., Glickman, E., & de Vries, W. 2007, ApJ, 654, 99
- Wuyts et al. (2008) Wuyts, S., Labbé, I., Schreiber, N. M. F., Franx, M., Rudnick, G., Brammer, G. B., & van Dokkum, P. G. 2008, ApJ, 682, 985


| POP | aaTotal number of sources in each (sub)sample and, in parenthesis, those which have good photometry in all bands involved in the ERG criteria: , , , , and m. | ERO | IERO | DRG | X-Ray | IRACddNumber of sources with detection in all four IRAC channels. | PLeeSources classified as AGN by PL (Donley et al., 2007) or MIR color–color (Stern et al., 2005) criteria. In parenthesis, those also classified as AGN by the X-ray criterion. | MIR cceeSources classified as AGN by PL (Donley et al., 2007) or MIR color–color (Stern et al., 2005) criteria. In parenthesis, those also classified as AGN by the X-ray criterion. | MIPS | Radio | NAGNffTotal number of sources classified as AGN, considering all AGN identification criteria, along with the equivalent fraction in the total (sub)population. | ||||||
|---|---|---|---|---|---|---|---|---|---|---|---|---|---|---|---|---|---|
| XRbbTotal number of X-ray identifications. | A1ccNumber of sources classified as type-1 or type-2 AGN (A1 or A2, respectively), type-1 or type-2 QSO (Q1 or Q2, respectively), and AGN with undetermined type (no HR determination, column nHR) according to the Szokoly et al. (2004) criterion. | A2ccNumber of sources classified as type-1 or type-2 AGN (A1 or A2, respectively), type-1 or type-2 QSO (Q1 or Q2, respectively), and AGN with undetermined type (no HR determination, column nHR) according to the Szokoly et al. (2004) criterion. | Q1ccNumber of sources classified as type-1 or type-2 AGN (A1 or A2, respectively), type-1 or type-2 QSO (Q1 or Q2, respectively), and AGN with undetermined type (no HR determination, column nHR) according to the Szokoly et al. (2004) criterion. | Q2ccNumber of sources classified as type-1 or type-2 AGN (A1 or A2, respectively), type-1 or type-2 QSO (Q1 or Q2, respectively), and AGN with undetermined type (no HR determination, column nHR) according to the Szokoly et al. (2004) criterion. | nHRccNumber of sources classified as type-1 or type-2 AGN (A1 or A2, respectively), type-1 or type-2 QSO (Q1 or Q2, respectively), and AGN with undetermined type (no HR determination, column nHR) according to the Szokoly et al. (2004) criterion. | m | |||||||||||
| ERG | 731 (702) | 645 | 294 | 350 | 155 | 88 | 18 | 36 | 1 | 5 | 26 | 675 | 14 (1) | 164 (30) | 402 | 17 | 214 (29%) |
| ERO | 645 (626) | 645 | 290 | 267 | 145 | 84 | 17 | 35 | 1 | 4 | 25 | 612 | 6 (1) | 135 (27) | 359 | 15 | 184 (29%) |
| IERO | 294 (289) | 290 | 294 | 198 | 29 | 47 | 9 | 19 | 1 | 3 | 14 | 290 | 4 (1) | 83 (21) | 191 | 10 | 103 (35%) |
| DRG | 350 (338) | 267 | 198 | 350 | 39 | 51 | 11 | 17 | 0 | 5 | 16 | 322 | 12 (0) | 117 (25) | 222 | 11 | 135 (39%) |
| cERG | 197 (197) | 197 | 197 | 197 | 17 | 36 | 8 | 14 | 0 | 3 | 10 | 197 | 2 (0) | 69 (18) | 141 | 7 | 81 (41%) |
| pERO | 272 (272) | 272 | 0 | 0 | 103 | 24 | 6 | 13 | 0 | 0 | 5 | 257 | 0 (0) | 34 (2) | 128 | 3 | 56 (21%) |
| pDRG | 70 (70) | 0 | 0 | 70 | 9 | 4 | 1 | 1 | 0 | 1 | 1 | 51 | 6 (0) | 24 (3) | 35 | 2 | 25 (36%) |
| POP | aaNumber of stamps with a radio detection within 18” of the ERG position, consequently rejected from the final stacking. | bbNumber of stamps with a possible radio detection at the ERG position (signal between 3 and ), also removed from the final stacking. | ccFinal number of stamps included in the stacking. | |
|---|---|---|---|---|
| EROs | ||||
| 443 | 56 | 12 | 370 | |
| 344 | 37 | 7 | 296 | |
| 144 | 16 | 3 | 124 | |
| 84 | 6 | 2 | 75 | |
| IEROs | ||||
| 161 | 20 | 6 | 132 | |
| 124 | 11 | 5 | 106 | |
| 111 | 12 | 2 | 96 | |
| 59 | 3 | 1 | 54 | |
| DRGs | ||||
| 102 | 9 | 3 | 88 | |
| 71 | 4 | 2 | 64 | |
| 176 | 20 | 3 | 152 | |
| 111 | 7 | 2 | 101 | |
| cERGs | ||||
| 71 | 7 | 2 | 60 | |
| 49 | 3 | 2 | 43 | |
| 104 | 12 | 2 | 89 | |
| 59 | 3 | 1 | 54 | |
| pEROs | ||||
| 245 | 34 | 5 | 204 | |
| 193 | 25 | 2 | 164 | |
| 5 | 1 | 0 | 4 | |
| 4 | 1 | 0 | 3 | |
| pDRGs | ||||
| 1 | 0 | 0 | 0 | |
| 1 | 0 | 0 | 0 | |
| 34 | 4 | 0 | 30 | |
| 25 | 1 | 0 | 24 |
Note. — The and abbreviations stand for and , respectively.
| POP | aaFinal number of stamps included in the stacking, after the various rejection steps described in Section 4.3. | rms | S1.4GHz | S/N | bbNumber of MC simulations (out of 10000) that resulted in higher S/N values. | ()ccIn parenthesis, the estimated value also takes into account radio detections () excluded from the stacking procedure (see Section 4.3). | SFRccIn parenthesis, the estimated value also takes into account radio detections () excluded from the stacking procedure (see Section 4.3). | ()ccIn parenthesis, the estimated value also takes into account radio detections () excluded from the stacking procedure (see Section 4.3). | ccIn parenthesis, the estimated value also takes into account radio detections () excluded from the stacking procedure (see Section 4.3). | ||
|---|---|---|---|---|---|---|---|---|---|---|---|
| (Jy) | (Jy) | (W Hz-1) | (yr-1) | (W HzMpc-3) | (yrMpc-3) | ||||||
| EROs | |||||||||||
| 443 | 370 | 0.927 | 2.051 | 2.212 | 0 | 1.45 | 22.37(22.83) | … | 19.41(19.90) | … | |
| 344 | 296 | 1.037 | 1.080 | 1.041 | 5 | 1.45 | 22.25(22.62) | 10(23) | 19.19(19.56) | 8.48e-03(2.01e-02) | |
| 144 | 124 | 1.708 | 8.641 | 5.059 | 0 | 2.44 | 23.51(23.62) | … | 20.05(20.17) | … | |
| 84 | 75 | 2.006 | 8.274 | 4.125 | 0 | 2.39 | 23.47(23.55) | 162(196) | 19.81(19.90) | 3.60e-02(4.34e-02) | |
| IEROs | |||||||||||
| 161 | 132 | 1.627 | 6.700 | 4.118 | 0 | 1.66 | 23.01(23.25) | … | 19.63(19.96) | … | |
| 124 | 106 | 1.792 | 5.071 | 2.830 | 0 | 1.67 | 22.89(23.08) | 43(66) | 19.42(19.62) | 1.45e-02(2.32e-02) | |
| 111 | 96 | 1.928 | 8.176 | 4.241 | 0 | 2.47 | 23.50(23.58) | … | 19.94(20.03) | … | |
| 59 | 54 | 2.369 | 7.103 | 2.998 | 1 | 2.40 | 23.46(23.49) | 161(170) | 19.68(19.71) | 2.67e-02(2.82e-02) | |
| DRGs | |||||||||||
| 102 | 88 | 2.001 | 6.823 | 3.410 | 0 | 1.59 | 22.99(23.12) | … | 19.39(19.56) | … | |
| 71 | 64 | 2.283 | 6.711 | 2.940 | 0 | 1.61 | 22.99(23.09) | 54(68) | 19.27(19.43) | 1.04e-02(1.48e-02) | |
| 176 | 152 | 1.596 | 6.144 | 3.850 | 0 | 2.51 | 23.39(23.52) | … | 19.95(20.10) | … | |
| 111 | 101 | 1.744 | 5.224 | 2.995 | 0 | 2.47 | 23.30(23.40) | 110(137) | 19.69(19.79) | 2.73e-02(3.42e-02) | |
| cERGs | |||||||||||
| 71 | 60 | 2.542 | 8.901 | 3.502 | 0 | 1.67 | 23.15(23.26) | … | 19.49(19.64) | … | |
| 49 | 43 | 2.982 | 7.275 | 2.440 | 6 | 1.71 | 23.16(23.26) | 80(100) | 19.39(19.55) | 1.36e-02(1.96e-02) | |
| 104 | 89 | 1.961 | 7.270 | 3.707 | 0 | 2.48 | 23.45(23.55) | … | 19.86(19.97) | … | |
| 59 | 54 | 2.369 | 7.103 | 2.998 | 1 | 2.40 | 23.46(23.49) | 161(170) | 19.68(19.71) | 2.67e-02(2.82e-02) | |
| pEROs | |||||||||||
| 245 | 204 | 1.289 | -0.449 | -0.348 | 1347 | 1.33 | 22.36(22.66) | … | 19.17(19.47) | … | |
| 193 | 164 | 1.413 | -1.036 | -0.733 | 3764 | 1.32 | 22.52(22.68) | 18(26) | 19.24(19.39) | 9.54e-03(1.36e-02) | |
| 6 | … | … | … | … | … | … | … | … | … | … | |
| 4 | … | … | … | … | … | … | … | … | … | … | |
| pDRGs | |||||||||||
| 1 | … | … | … | … | … | … | … | … | … | … | |
| 1 | … | … | … | … | … | … | … | … | … | … | |
| 34 | 30 | 3.713 | 1.049 | 0.283 | 3396 | 2.67 | 23.71(23.75) | … | 19.67(19.72) | … | |
| 25 | 24 | 4.037 | -1.532 | -0.379 | 7001 | 2.65 | 23.80(23.80) | 345(345) | 19.70(19.70) | 2.77e-02(2.77e-02) |
Note. — The and abbreviations stand for and , respectively. The upper limits for Luminosity and SFR estimates, whenever , are calculated considering the maximum S/N obtained in the respective set of MC simulations.