Simultaneous Measurement of Torsional Oscillator and NMR of Very Dilute 3He in Solid 4He
Abstract
We have investigated the NMR properties of dilute 3He impurities in solid 4He contained in a torsional oscillator (TO) by the simultaneous measurement of the NMR and the torsional oscillator response of the so-called supersolid 4He. From measurements on samples with one hundred to a few hundred ppm of 3He, we have found three different states of 3He. The first is the homogeneously distributed isolated 3He atom in a solid matrix of 4He. The second is the 3He cluster in a homogeneous 4He matrix, which appears below the phase separation temperature of a solid mixture. The third is the 3He cluster in some nonuniform part of a 4He crystal. We find that 3He atoms contained in the third component remain in a nearby location even above the phase separation temperature. Based on the fact that even a ppm of 3He affects the supersolid response in a TO below and above the phase separation temperature, we propose that the nonuniform part of a crystal that holds the third type of 3He and thus has a higher local concentration of 3He plays an important role in the supersolid phenomenon in a TO.
pacs:
67.80.-s, 67.80.bd, 67.80.dk, 67.60.-gI introduction
Superfluid-like behavior in a solid, referred to as a supersolid, was originally attributed to Bose-Einstein condensation of delocalized zero-point vacancies in a crystal Andreev and Lifshitz (1969); Chester (1970); Leggett (1970). However, although many studies attempted to demonstrate a supersolid phase in solid 4He, none were successful in providing evidence of the same Meisel (1992). In 2004, Kim and Chan observed the non-classical rotational inertia (NCRI) of solid 4He by a torsional oscillator (TO) experiment Kim and Chan (2004). The resonant period of a TO filled with solid helium exhibits a drop below some characteristic temperature near 200 mK. This drop in the resonant period can be attributed to the decoupling of a part of the mass of solid 4He from the TO, as in the case of a TO with superfluid 4He in it. The observed NCRI fraction (NCRIf), defined as the ratio of the decoupled inertia to the total inertia of solid helium in the TO, varies from 0.1% to 20% depending on the sample geometry Rittner and Reppy (2006). Although it is much smaller than the value in the case of a bulk liquid, it agrees with the theoretical expectation Kim and Chan (2004). This experimental result attracted considerable interest, and served as a starting point for many theoretical and experimental works Galli and Reatto (2008). Thus far, considerable information about the phenomenon of supersolidity has been obtained. The observed NCRIf decreases with an increase in the driving velocity Kim and Chan (2004). The reduction in the NCRIf is well-characterized by a critical velocity Aoki et al. (2007). The annealing effect has been investigated by several groups Rittner and Reppy (2006); Penzev et al. (2007); Kondo et al. (2007), and these studies have proved that the NCRIf depends on the history of the solid sample. Another important observation is the strong dependence of the NCRIf on relatively small amounts of 3He impurities Kim et al. (2008). Although several TO experiments have shown the existence of NCRI, a DC flow study failed to detect the mass flow that would be expected in a supersolid Day and Beamish (2006). Several theoretical models have been proposed thus far, but none have been satisfactory. Recently, the consensus that has been arrived at is that supersolidity is probably related to some nonuniformity in the solid samples. However, this phenomenon has not yet been clearly understood. Therefore, it is necessary to obtain more information in order to understand supersolid 4He.
The fact that the NCRI response of solid 4He is affected by very small amounts (from ppb to ppm) of 3He suggests that this phenomenon is not a bulk one, because it is difficult to visualize any long-range interaction between 4He and tiny amounts of 3He, which are located separately in solid 4He. Even if all 3He impurities are localized in a region exhibiting supersolid behavior with 0.1% NCRIf, a hundred ppm is too tiny an amount of impurity to destroy the supersolid response of 4He if the supersolidity is a phenomenon similar to the superfluidity in bulk liquid 4He. Therefore, it is desirable to study how a tiny amount of 3He impurity can influence the supersolid properties of 4He; this should lead to new insights into this fascinating field of research. It is well known that a solid mixture of 3He-4He has a finite phase separation temperature that depends on the concentration of 3He , even for 1 ppb of 3He impurities Edwards and Baliber (1989). Above the phase separation temperature , 3He atoms distribute homogeneously in the matrix of hcp solid 4He, whereas below , they tend to form tiny clusters of pure 3He in solid 4He. Because the movement of 3He atoms in solid 4He due to diffusion is relatively slow, a large droplet of solid 3He, as in the case of a liquid mixture, cannot be formed. As reported earlier Kingsley et al. (1998); Poole and Cowan (2004), NMR measurements revealed the formation of 3He clusters in solid 4He. In a percent solution, the clusters typically have diameters of the order of several micrometers. Similarly, the NMR properties of 3He in supersolid 4He will provide information about the state of 3He surrounded by 4He.
II experiment
We have developed an apparatus to carry out simultaneous TO/NMR measurements of the same sample. Our TO contains a Be-Cu torsion rod and a cylindrical polycarbonate cell. The TO assembly is supported by a massive copper isolator block that is thermally anchored to the mixing chamber of a dilution refrigerator. The inner diameter of the TO cell body is 14 mm and the height of the sample space is 16 mm. The TO is driven by a constant excitation voltage feedback system. The measured -value of TO is approximately at 800 mK and the resonant frequency of the empty TO is 1175 Hz. The NMR coil is wound around the bottom of the cell without touching the cell body so as to not degrade the -value of the TO, and it is thermally anchored to the mixing chamber directly in order to prevent sample from being heated by the rf pulses used for NMR measurement. The static magnetic field of 0.15 T for NMR is applied perpendicular to the axis of the TO.
A solid sample of 3He-4He mixture is produced using the blocked capillary method by the following process. First, the necessary amount of 3He gas is condensed in the cell at 10 mK. After most of the 3He gas condenses, 4He gas at 0.5 MPa, which is filled in a closed volume of the filling line at room temperature, is introduced into the cell. In a few minutes, the pressure reduces to approximately 0.05 MPa. Then, additional 4He gas at 0.5 MPa is condensed again. This filling process is repeated in order to condense all of the 3He gas in the filling line into the cell. After the cell is filled by the liquid mixture, the cell is pressurized up to 2.5 MPa. Then, the refrigerator is warmed up to 3 K and the cell is pressurized up to 6.5 MPa. The cell is gradually cooled down over 6 h to a temperature at which the pressure leaves melting curve to let a seed of the solid grow larger and fill the cell completely. The resonant frequency drops by 15 Hz due to the inertia of the solid. The final pressure of the solid 4He is estimated to be approximately MPa from the melting temperature while warming up. Our samples of 4He with commercial purity (0.3 ppm), 100 ppm, 300 ppm, and 1000 ppm of 3He are produced in this manner. Another sample of 4He with a few hundred ppm of 3He is produced by diluting a sample of 4He with 1000 ppm of 3He. First, we depressurize the cell that contains the 1000-ppm sample to approximately 0.1 MPa and repressurize the cell to approximately 2.5 MPa by filling 4He. We repeat this process in order to dilute the concentration of 3He in the cell. Finally, the refrigerator is warmed up to 3 K and the cell is pressurized up to 6.5 MPa. We estimate the concentration of 3He in this sample to be ppm.
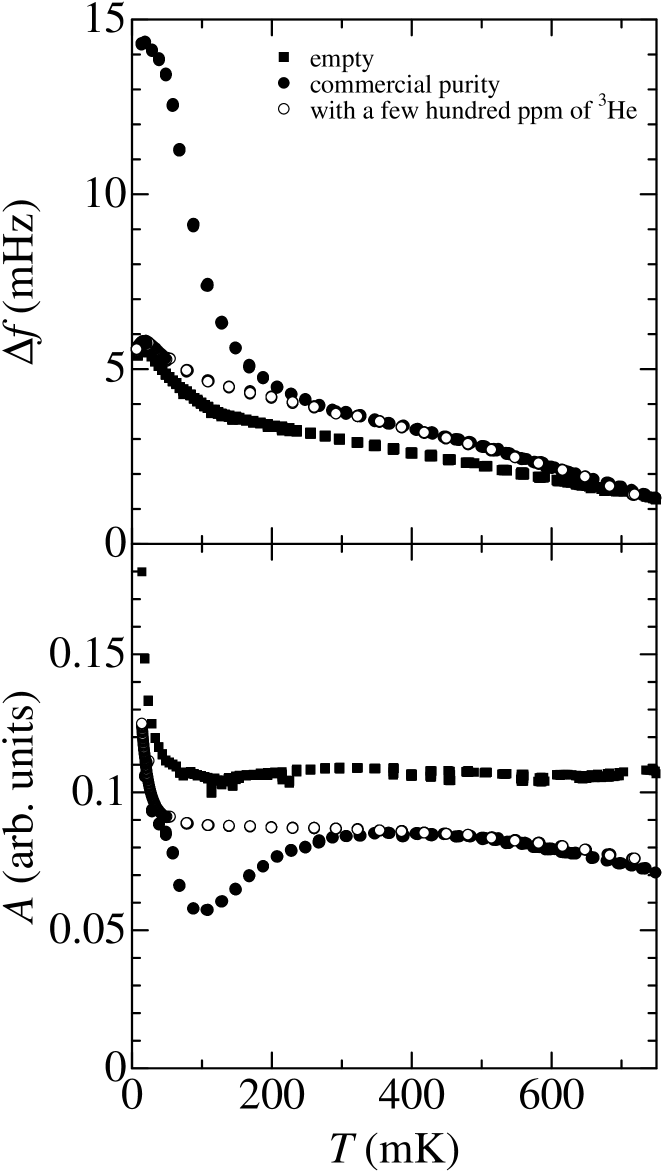
We have measured the resonant frequency and amplitude of the TO with an empty cell; a 4He sample of commercial purity at 3.6 MPa; and 4He samples with 100, 300, and a few hundred ppm of 3He impurity at 3.6 MPa. The results for the empty cell, commercial purity sample, and sample with a few hundred ppm of 3He are shown in Fig. 1. In case of the commercial purity sample, sudden increases in the resonant frequency and extra energy dissipation are observed below 200 mK. This agrees with the experimental results of other groups Kim and Chan (2004); Penzev et al. (2007); Kondo et al. (2007); Aoki et al. (2007). In the case of the sample with a few hundred ppm of 3He, an NCRI response similar to that mentioned above is not observed. This result indicates that the NCRI response is destroyed because of the strong effect of 3He impurities. The temperature dependence of the frequency and amplitude of solid samples with 100 and 300 ppm of 3He are similar in this temperature range. For samples with over a hundred ppm of 3He impurity, the phase separation temperature is estimated to be approximately 100 mK; this temperature slightly depends on the concentration of the impurity. NMR measurements confirmed the onset of phase separation. Although there exists a possibility that the response of the TO is affected by the phase separation, we do not observe any distinct signature of phase separation in the TO response, neither frequency nor amplitude, within the sensitivity of our measurement.
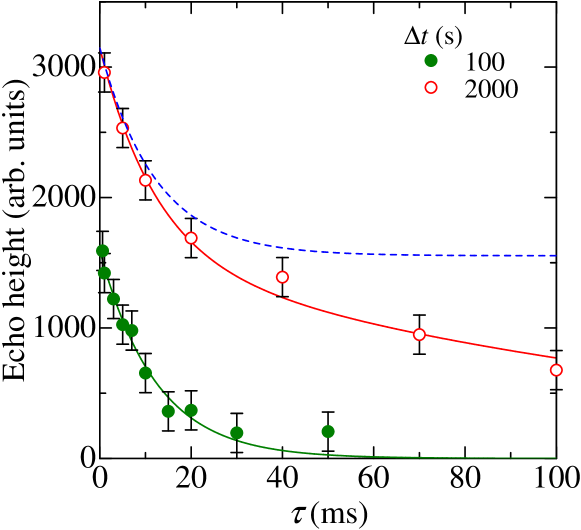
Simultaneously, the NMR properties of 3He in the same sample are measured. Figure 2 shows the signal intensity measured using a saturation recovery pulse sequence with a waiting time at 8 mK. This type of measurement provides the longitudinal relaxation time of 3He in solid 4He. It should be noted that the horizontal axis of Fig. 2 indicates a logarithmic scale. It should also be noted that the vertical scale of the sample with a few hundred ppm of 3He has an ambiguity of factor 0.8 to 1.5 to the scale of other samples, because of the different -values of the pickup circuits. However, this scaling problem does not affect any part of our discussion. In the case of the sample with a few hundred ppm of 3He, the signal intensity increases at around s. This corresponds to the value of this system. However, there is another obvious step at around 10 s. This suggests that the system has a second . The shorter one, , is approximately 10 s and we call this the S component. The longer one, , is approximately s and we call this the L component. We understand that each can be attributed to different components of 3He rather than being attributed to cascaded relaxation processes. We also measured of the S and L components using a /2-- pulse sequence with various and various waiting times after the last saturation pulse. We show the results for the sample with a few hundred ppm of 3He in Fig. 3. For s, the observed signal originates from only the S component because . The value of the S component is determined to be approximately 20 ms from this measurement. For s, we observe both the S and the L components. The value of the L component can be obtained by subtracting the signal of the S component estimated from the result of = 100 s. The obtained of the L component is approximately ten times longer than that of the S component. This evidences the fact that the two components are completely different from each other.
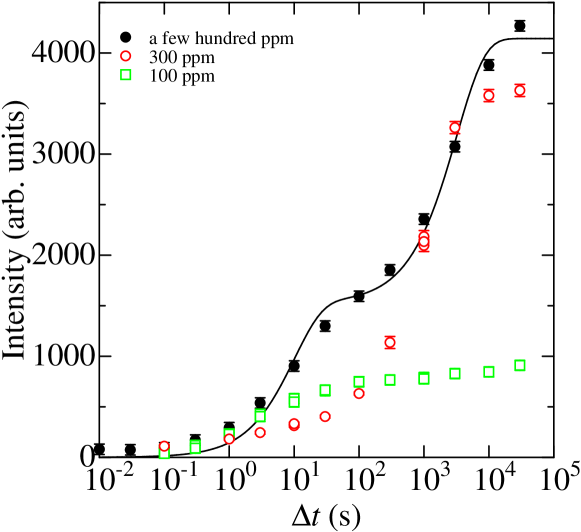
The solid line shown in Fig. 2 fits the data for the sample with a few hundred ppm of 3He with s and s. The slight deviation near indicates that has some distribution. For the sample with 300 ppm of 3He, the signal intensity mostly increases near s. The broad distribution of the signal below s suggests that for this sample distributes in the range between s and s.
We should note that the ratio of the intensities of the S and the L components differs considerably between the samples with 300 and a few hundred ppm of 3He. This might depend on the sample quality because the former sample was maintained at a temperature slightly below the melting point for more than a day whereas the latter sample was cooled much faster. For the sample with 100 ppm of 3He, the L component almost disappears. This suggests that for 3He the location of the S component is more favorable than that of the L component.
The S and L components correspond to 3He clusters, which are formed by the phase separation, because the signal intensity of both components increases with time after cooling through (see Fig. 5). This result implies that a third invisible component (I component) with extremely long exists in this system even below , and this is the source of the 3He atoms that form clusters. The I component probably corresponds to isolated atoms that are separated from each other in the lattice of hcp solid 4He. Thus, three different components, namely, S, L, and I, of 3He exist in the system at low temperature. Because it is difficult to investigate the I component, whose is a large fraction of a day, we investigate the other two components in this experiment.
Figure 4 shows the temperature dependences of the echo height after a /2-- pulse sequence with various waiting times after the last saturation pulse for the sample with a few hundred ppm of 3He. First, the system is maintained at the lowest temperature, 8 mK, for 60 h before any measurement. At the lowest temperature, the echo height for s is approximately 10% larger than the one for s. This difference indicates the existence of the L component. Then, the system is warmed slowly over 20 h. During warming, the echo height decreases as the temperature increases and it disappears in the noise above 140 mK, which is above the phase separation temperature mK. Because the time scale of warming is not sufficiently long, we observe the signal even above ; however, the signal disappears after a while. After a wait time of s at 160 mK, a very strong signal is observed, as indicated by the solid square in Fig. 4, because of the recovery of the I component. The sample was left at 160 mK for over 19 h including this measurement, and then cooled to 8 mK over 10 h. During cooling, the signal recovers as the temperature decreases below . However, the observed echo heights are smaller than those obtained during warming. Moreover, there is almost no difference between two different measurements. This observation indicates that the L component disappears completely. It also indicates that the 3He atoms contained in the L component escape and merge into the I component. The amount of S component, which is estimated from the echo heights at 8 mK after thermal cycling, is approximately half the value of the echo height observed at 8 mK before thermal cycling. This implies that a significant fraction of 3He atoms in the S component remain in a nearby location after the breakup of the cluster.
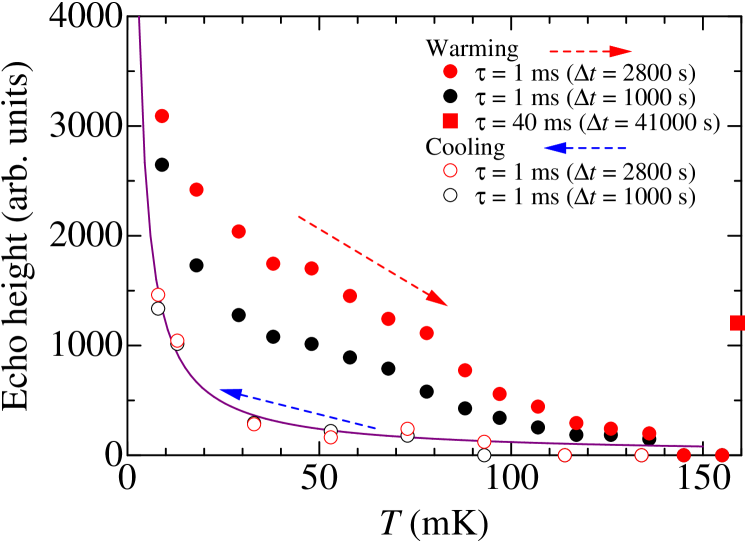
Because the magnitude of the echo height during cooling agrees with Curie’s law, the S component is in the solid state and the amount of S component is conserved during cooling at least in the temperature range below 100 mK. However, the magnitude of the echo height during warming does not agree with Curie’s law. The extracted magnitude of the L component by assuming s does not agree with Curie’s law. The L component may be considered to be in the liquid state. However, this is not the case. The estimated pressure of our sample is as high as MPa, which is well above the bulk melting pressure. In the case of a liquid inclusion, whose pressure is slightly below the melting pressure of 3He, we should have observed a phase transition between solid and liquid, because the melting pressure of 3He changes by approximately 0.3 MPa from 10 mK to 100 mK Edwards and Baliber (1989). However, we observe no evidence of the phase transition in this temperature range. Thus, we believe that the L component is not in the liquid phase.
To further clarify the temperature and time-dependent variation of both components, we measured the time evolution of the S and the L components after thermal cycling to a higher temperature from 8 mK. Figure 5(a) shows the time dependences of the signal intensity of each component at 8 mK for the abovementioned sample, which is warmed to 160 mK and maintained above for approximately 19 h. As can be seen, the S component already exists when the system cools to the lowest temperature of 8 mK. In contrast, the L component does not exist soon after cooling. After reaching 8 mK, both components grow almost linearly with time. Figure 5(b) shows the time dependences of the signal intensity of each component at 8 mK for the sample, which is warmed to 1 K and maintained above for approximately 80 h. Soon after cooling to 8 mK, the signals from both components are not observable.
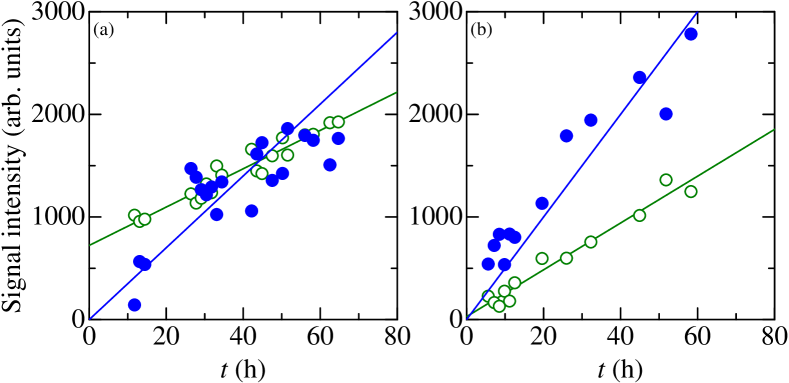
This indicates that 3He atoms contained in both the S and the L components escape completely and merge into the I component. The difference between these two experiments suggests that the 3He atoms contained in the S component remain in a nearby location, whereas the 3He atoms contained in the L component separate in space in the temperature range slightly above . This feature of the S components is called the stability.
III discussion
Such stability of the S component is also observed in other samples. Although both clusters disappear above , the 3He atoms in the S component remain in a nearby location, where atoms can easily form clusters again below . On the other hand, 3He atoms contained in the L component get separated completely. We attribute this difference to the state of the surrounding 4He crystal. Because of the fact that the S component is more stable than the L component, we propose that the S component is formed in the nonuniform part of the crystal, whereas the L component is formed in the homogeneous part of the crystal. If there exists a macroscopic disorder such as this nonuniformity, an extra trapping potential for 3He appears as a natural consequence. The shorter relaxation time for the S component also suggests considerably active motion of atoms due to the imperfect lattice structure in the disorder. The volume fraction of the disordered part could be as large as 100 ppm, because the L component almost disappears in the solid with 100 ppm of 3He. However, further investigations are required to understand the nature of this nonuniformity.
Next, we discuss the strong effect of 3He impurities on the supersolid. As discussed earlier, 100 ppm of 3He can destroy the NCRI response. Although one normalizes 100 ppm by the NCRIf of 0.1%, it is still 10%, which is too small a fraction to destroy the NCRI response completely, if the effect of 3He impurities in the supersolid is similar to that of the 3He impurities in superfluid 4He. Thus, the strong impurity effect is likely to be caused by 3He, whose local concentration is much higher than the averaged concentration. The 3He atoms in the S component of our sample are a good candidate for this type of concentrated 3He, because they remain in a nearby location even above the phase separation temperature . If this is the case, the NCRI response must originate from the region where the S component forms. This is further evidence of the hypothesis that some nonuniformity of hcp 4He is strongly related to the cause of the NCRI response. Because our measurement is performed with an impurity concentration that is sufficient to completely destroy the NCRI response, further investigations with lesser impurities are required to confirm our proposal.
Acknowledgements.
This research was supported by the Grant-in-Aids for Scientific Research on Priority Area “Physics of new quantum phases in superclean materials” (Grant No.17071004) and for the Global COE Program “The Next Generation of Physics, Spun from Universality and Emergence” from the Ministry of Education, Culture, Sports, Science and Technology (MEXT) of Japan.References
- Andreev and Lifshitz (1969) A. Andreev and I. Lifshitz, Sov. Phys. JETP 29, 1107 (1969).
- Chester (1970) G. Chester, Phys. Rev. A 2, 256 (1970).
- Leggett (1970) A. Leggett, Phys. Rev. Lett. 25, 1543 (1970).
- Meisel (1992) M. W. Meisel, Physica B 178, 121 (1992).
- Kim and Chan (2004) E. Kim and M. H. W. Chan, Science 305, 1941 (2004).
- Rittner and Reppy (2006) A. S. C. Rittner and J. D. Reppy, Phys. Rev. Lett. 97, 165301 (2006).
- Galli and Reatto (2008) D. Galli and L. Reatto, J. Phys. Soc. Jpn. 77, 111010 (2008), see this review article and references therein.
- Aoki et al. (2007) Y. Aoki, J. C. Graves, and H. Kojima, Phys. Rev. Lett. 99, 015301 (2007).
- Penzev et al. (2007) A. Penzev, Y. Yasuta, and M. Kubota, J. Low Temp. Phys. 148, 677 (2007).
- Kondo et al. (2007) M. Kondo, S. Takada, Y. Shibayama, and K. Shirahama, J. Low Temp. Phys. 148, 695 (2007).
- Kim et al. (2008) E. Kim, J. S. Xia, J. T. West, X. Lin, A. C. Clark, and M. H. W. Chan, Phys. Rev. Lett. 100, 065301 (2008).
- Day and Beamish (2006) J. Day and J. Beamish, Phys. Rev. Lett. 96, 105304 (2006).
- Edwards and Baliber (1989) D. O. Edwards and S. Balibar, Phys. Rev. B 39, 4083 (1989).
- Kingsley et al. (1998) S. C. J. Kingsley, V. Maidanov, J. Saunders, and B. Cowan, J. Low Temp. Phys. 113, 1017 (1998).
- Poole and Cowan (2004) M. Poole and B. Cowan, J. Low Temp. Phys. 134, 211 (2004).