VLBI Observations of the Type I b/c Supernova 2009bb
Abstract
We report on VLBI, as well as VLA radio observations of the Type Ib/c supernova 2009bb. The high radio luminosity of this supernova seems to require relativistic outflow, implying that the early radio emission was “engine-driven”, that is driven by collimated outflow from a compact object, even though no gamma-ray emission was seen. The radio light curve shows a general decline, with a “bump” near d, seen most prominently at 5 GHz. The lightcurve bump could be either engine-driven, or it might represent the turn-on of the normal radio emission from a supernova, driven by interaction with the CSM rather than by the engine. We undertook VLBI observations to resolve SN 2009bb’s relativistic outflow. Our observations constrain the angular outer radius at an age of 85 d to be mas, corresponding to cm and an average apparent expansion speed of . This result is consistent with the moderately relativistic ejecta speeds implied by the radio luminosity and spectrum.
Subject headings:
supernovae: individual (SN2009bb) — radio continuum: general — gamma rays: bursts1. INTRODUCTION
Supernova SN 2009bb (catalog ) was discovered by the Chilean Automatic Supernova Search Program (CHASE; Pignata et al., 2009b, a) on 2009 March 29.9 UT, in the nearby spiral galaxy NGC 3278 (catalog ). The radial velocity of NGC 3278 is 2964 km s-1 (Paturel et al., 2003), and in what follows we will use a round distance of 40 Mpc for the galaxy and the supernova. SN 2009bb is in a region of high star-formation, approximately 4.2 kpc from the center of the galaxy in projection (Levesque et al., 2010). Stritzinger et al. (2009) obtained an optical spectrum which showed no evidence for hydrogen, and thus SN 2009bb was classified as type I b/c. The shock breakout date is well constrained to be March UT (Soderberg et al., 2010b).
Radio emission was discovered using the NRAO111The National Radio Astronomy Observatory is a facility of the National Science Foundation operated under cooperative agreement by Associated Universities, Inc. Very Large Array (VLA) on April 5.2 UT, at time222We use to refer to time in the observer frame. after shock breakout, of 17 d. The 8.5-GHz flux density was mJy (Soderberg et al., 2010b). This flux density corresponds to a spectral luminosity of 5 erg s-1 Hz-1, which is larger than that observed for any other SN I b/c at a similar time after shock breakout (see Soderberg et al., 2010b, 2006b; Berger et al., 2003). Subsequent VLA observations confirmed the initially high flux density and showed a power-law decay, with the flux density at 8.5 GHz, (Soderberg et al., 2010b). Similar decay rates are seen for other Type I b/c SNe, but also for the nearest gamma-ray burst, GRB 980425. These radio observations gave a position for SN 2009bb of and with an uncertainty of 0.7″ in each coordinate. We give this position, and all others in this paper using J2000 coordinates.
Radio emission in a supernova is generated by the shocks formed as the ejecta interact with the circumstellar material (CSM). Radio emission therefore traces the fastest ejecta, unlike the optical emission, which traces the massive but more slowly-moving bulk of the ejecta. Strong radio emission consequently is a sign of particularly strong interaction with the CSM, which can be due either to a particularly dense CSM, such as is seen for the radio-luminous Type II SNe, or to particularly strong shocks which are caused by relativistic ejecta, whether those latter are collimated or not.
Type I b/c SNe like SN 2009bb are of special interest because GRBs have been shown to be associated with them (e.g., Galama et al., 1998; Stanek et al., 2003; Malesani et al., 2004; Pian et al., 2006; Cobb et al., 2010; Starling et al., 2010). While the optical luminosities of Type I b/c SNe and those associated with GRBs overlap, the GRBs are distinguished by having powerful non-thermal “afterglow” emission. In the radio, the afterglow typically peaks a few days after the explosion, and GRB radio luminosities are observed to be up to a million times higher than those of ordinary Type I b/c SNe (Soderberg et al., 2006a). This bright emission is the observational manifestation of the substantial energy coupled to relativistic velocities in GRBs. However, GRBs are rare events, and Soderberg et al. (2006b) showed that less than 3% of all Type I b/c SNe have similarly relativistic outflows. The presence of relativistic ejecta, therefore, makes a supernova of particular interest. The physical mechanism that distinguishes ordinary Type I b/c SNe from GRB-SNe remains unknown and detailed studies of relativistic Type I b/c SNe are therefore required to make progress.
In particular, Soderberg et al. (2010b) showed that SN 2009bb’s high radio luminosity requires a substantial relativistic outflow powered by a “central engine”, in other words a black hole or a neutron star surrounded by an accretion disk which produces collimated outflow. The radio spectrum as measured at the VLA and the Giant Meterwave Radio Telescope (GMRT) is well fit by a synchrotron self-absorption (SSA) spectrum. The high luminosity and relatively low turnover frequency of 6 GHz at d then imply a blastwave radius of cm (Soderberg et al., 2010b) and therefore a mean apparent expansion speed of , assuming equipartition of energy between electrons and magnetic fields. Note that these are minimum values for the size and expansion velocity, since both deviations from equipartition, and the presense of free-free absorption (FFA) in addition to SSA would result in larger values. No gamma-ray counterpart was detected, but an off-axis viewing angle or a low fluence burst cannot be excluded. SN 2009bb differs from GRBs in that it occurred in a high-metallicity environment (Levesque et al., 2010).
For relatively nearby SNe, a direct measurement of the size of the shockwave is possible with very-long-baseline interferometry (VLBI) observations. Such a measurement provides a model-independent way of measuring the expansion speed and therefore determining the presence or absence of relativistic ejecta, and possibly also determining the emission geometry and testing the assumption of equipartition. Unfortunately, SNe which are both sufficiently nearby and radio-bright to allow VLBI imaging are rare events. Relativistic expansion was clearly detected using VLBI in the case of GRB 030329 (Taylor et al., 2004). In the case of SNe not associated with GRBs, however, the VLBI observations so far have confirmed the rarity of relativistic ejecta: VLBI observations of two Type I b/c SNe which were suspected of having relativistic ejecta, SN 2008D and SN 2001em, showed only subluminal expansion (Bietenholz et al., 2009; Paragi et al., 2008; Schinzel et al., 2009; Bietenholz & Bartel, 2007, 2005; Paragi et al., 2005). In the case of SN 2007gr, relativistic expansion was claimed by Paragi et al. (2010), but Soderberg et al. (2010a) showed that a more conservative interpretation of a normal, non-relativistic supernova can also be reconciled with the VLBI measurements, and provides a more natural explanation of the relatively low radio and X-ray luminosity. Optical and infra-red spectra also suggest a modest ejected mass and explosion energy (Mazzali et al., 2010), whereas relativistic ejecta are usually accompanied by large ejected masses and explosion energies.
2. OBSERVATIONS
We obtained both VLA total-flux-density and VLBI imaging observations of SN 2009bb. The VLA observations were obtained in two ways. Firstly, by using the VLA as a standalone interferometer in parallel with the use of the phased VLA as part of our VLBI array on 2009 June 10 - 11, described below. These observations were at 8.4 GHz in the CnB array configuration. Secondly, as part of a regular VLA monitoring program for Type I b/c supernovae (AS983; PI Soderberg) on 2009 October 23, at both 8.4 and 5.0 GHz, and with the array in the D configuration. The observations were reduced in a standard manner, with the flux density scale being set by observations of 3C 286, and VCS4 J1036-3744 (catalog ) (hereafter J1036-3744; also known as QSO B1034-374) being used for phase-referencing.
The VLBI observations were carried out at 8.4 GHz, and lasted for 10 hours with a midpoint of 2009 June 12.1 UT, or d. Our VLBI array consisted of the NRAO VLBA (-m diameter) and phased VLA (130-m equivalent diameter) telescopes, and the Hobart (25-m diameter) and Tidbinbilla DSS45 (34-m diameter) telescopes of the Australian Long Baseline Array. Unfortunately, due to a bearing failure, the 26-m antenna at Hartebeesthoek, South Africa was not available for these observations. We recorded a bandwidth of 64 MHz in both senses of circular polarization with two-bit sampling, for a total bit rate 512 Mbit s-1, with the exception of the Tidbinbilla antenna, at which we only recorded left circular polarization (IEEE convention). The VLBI data were correlated with NRAO’s VLBA processor, and the analysis carried out with NRAO’s Astronomical Image Processing System (AIPS). The initial flux density calibration was done through measurements of the system temperature at each telescope, and then improved through selfcalibration of the reference source. A correction was made for the dispersive delay due to the ionosphere using the AIPS task TECOR, although the effect at our frequency is not large.
We phase-referenced our VLBI observations to J1036-3744, for which we use the position from the Fourth VLBA calibrator survey of , (Petrov et al., 2006). We used a cycle time of 4 min, with 2.7 min spent on SN 2009bb. Due to SN 2009bb’s southern declination, it was at relatively low elevation at the North American antennas. The source never exceeded 8° in elevation at the BR, HN and NL antennas of the VLBA, therefore we did not use the data from these antennas in the final analysis. The majority of our remaining visibility measurements were made at relatively low elevations, with less than 25% of our individual visibility measurements being obtained with both antennas observing at elevations . We show the final --coverage obtained in Figure 1.

For both imaging and model-fitting of the VLBI data for SN 2009bb, we reduced the weights of the VLA by a factor of 4. As the VLA is more than an order of magnitude more sensitive than any of the remainder of the antennas, the fraction of visibilities involving the VLA will have much higher weight and thus dominate. Although reducing the VLA weights incurs a penalty in statistical efficiency, it improves the stability of both imaging and modelfitting.
3. RESULTS
3.1. VLA Total Flux Density
We describe first the results from the reduction of the 8.4 GHz VLA interferometric data. Our flux-density uncertainties include both statistical standard errors and an assumed 5% uncertainty in the flux density scale, added in quadrature. For our calibrator source, J1036-3744, we obtained a flux density of Jy.
We show the VLA image of NGC 3278 and SN 2009bb in Figure 2. The presence of a small amount of extended emission due to the galaxy NGC 3278 is apparent.
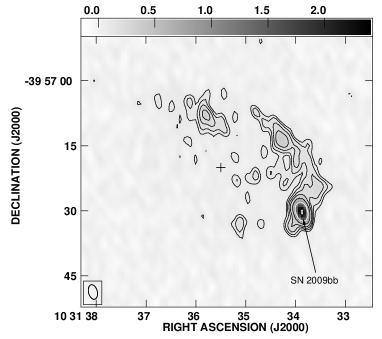
By fitting an elliptical Gaussian of the same dimensions as the restoring beam and a zero level, we determine the 8.4-GHz flux density of SN 2009bb at d to be mJy, where our uncertainty includes a contribution due to the uncertainty in estimating the zero-level (as well as the aforementioned 5% uncertainty in the flux-density scale, all added in quadrature). We estimate the contribution from NGC 3278 to be Jy bm-1 at our resolution of (FWHM).
For our subsequent VLA observations on 2009 Oct. 23, the array was in the lowest-resolution D array configuration with a synthesized beamwidth of at 8.4 GHz and at 5.0 GHz. The subtraction of the galaxy component of the radio emission was not straightforward. We accomplished it by using the image of SN 2009bb and NGC 3278 made on 12 June 2009 (Figure 2), which had adequate resolution and good - coverage, as a template. We assume that NGC 3278 does not change with time, and that any change in the image between June and October is therefore due to SN 2009bb. We convolved the template image to the resolution of the new ones, and in the case of 5 GHz, scaled the brightness distribution by an assumed spectral index of , and then determined the change in the flux density of SN 2009bb. We find the flux density of SN 2009bb on 2009 Oct. 23 ( d) was mJy at 8.4 GHz and mJy at 5.0 GHz. Our uncertainties again include a contribution from the galaxy subtraction, as well as those from noise and the flux-density calibration, all added in quadrature.
In Figure 3, we plot the radio light curves of SN 2009bb at 8.4 and 5 GHz including the flux density measurements described above, as well as earlier values reported in Soderberg et al. (2010b). Note that the VLA flux density obtained for the date and frequency of the VLBI observations ( d, 8.4 GHz) shows no noticeable discrepancy with the remainder of the observed light curve.
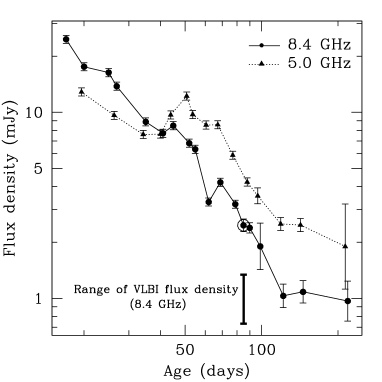
A bump in the light curves is observed near d. It is most prominent in the 5-GHz light curve, which shows an increase by almost a factor of 2, reaching a local maximum of 12 mJy at d, which corresponds to a spectral luminosity of 2.3 erg s-1 Hz-1. A similar although smaller relative increase is seen at 8.4 GHz, with the peak occurring perhaps slightly earlier.
A weighted least-squares fit to all the data up to d shows that on average, the flux density decays as follows: and . There is a possible flattening of the flux density decay at the very latest times ( d), although due to the difficulty of galaxy subtraction the reality of any late-time flattening is difficult to confirm. While the overall average decay rate is significantly flatter at 5 GHz than at 8.4 GHz, this is largely due to the bump being more prominent at 5 GHz, with the decay rates being similar at both frequencies after the bump.
3.2. VLBI
We now discuss the results of the VLBI observations, turning first to our phase-calibrator source, J1036-3744, as the results obtained for it will inform our interpretation of the SN 2009bb results. From a deconvolved (CLEAN) image of J1036-3744, we recovered a total flux density of 687 mJy, with an background rms brightness of 1.6 mJy bm-1. The image is dynamic-range limited, rather than limited by thermal noise. The total flux density recovered is 10% less than the flux density measured at the VLA. It is possible this discrepancy is due to 10% of the flux density being at spatial scales too large for VLBI but too small for the VLA (), although it is not uncommon to see such discrepancies between the flux density scales for VLBI, determined from the system-temperature measurements, from the more accurate one for VLA measurements, determined by observations of calibrator sources such as 3C 286. The residual delays and delay-rates we found for J1036-3744 were moderate, being mostly nsec and milli-Hz respectively, suggesting that the array was performing well, and therefore no particularly strong decorrelation is expected.
We turn now to SN 2009bb. An image made using complex weighting with the robustness factor set to , which is close to uniform weighting, and a - taper of 30% at 120 M had a total clean flux density of 740 Jy, a peak brightness of 610 Jy bm-1, and a background rms brightness of 130 Jy bm-1. We tried different weighting schemes and - tapers, but in no case was the total clean flux density greater than 800 Jy.
For marginally resolved sources, such as SN 2009bb, the best values for the source size and VLBI flux density come from fitting models directly to the visibility data, rather than imaging. We choose as a model the projection of an optically-thin spherical shell of uniform volume emissivity, with an outer radius of the inner one333Our results do not depend significantly on the assumed shell thickness, as the effect of reasonable thicknesses different than the assumed one is considerably less than our stated uncertainties.. Such a model has been found to be appropriate for other radio supernovae (see e.g., Bietenholz et al., 2003; Bartel & Bietenholz, 2008). For a partially resolved source such as SN 2009bb, the exact model geometry is not critical, and our shell model will give a reasonable estimate of the size of any circularly symmetric source, with a scaling factor of order unity dependent on the exact morphology (see discussion in Bartel et al., 2002). The Fourier transform of this shell model is then fit to the visibility measurements by least squares.
For the interested reader, we give the details of the modelfitting results in the appendix. Fitting such a model to the strictly phase-referenced visibilities for SN 2009bb gives our most accurate estimate of its center position, which is , , with an estimated uncertainty, dominated by systematic contributions, of a few mas.
The total flux density recovered from the VLBI data, whether through imaging or modelfitting, was at most 50% of that measured at the VLA. This discrepancy might suggest that the source is over-resolved by the VLBI observations, or, more precisely, that the missing flux density is at angular scales too large to be seen in the VLBI observations, but smaller than the VLA resolution. The VLBI observations had reasonable - coverage even for baselines as short as 10 M (see inset in Figure 1), and are therefore sensitive to structure up to 20 mas in angular size, while the VLA resolution was 3″. If the discrepancy between the VLA and VLBI flux densities is to be ascribed to a source resolved in VLBI, then its size should therefore be in the range of 20 mas to 3″. The minimum angular size makes it unlikely that such hypothetical structure could be related to SN 2009bb, since for a supernova age of 85 d and the distance 40 Mpc, the implied apparent expansion speed is , which we consider improbable.
Another possibility is a source of radio emission unrelated to SN 2009bb but coincidentally so close as to be within the VLA beamwidth. We consider also this possibility to be unlikely. A flux density of at least 1 mJy is required to explain the discrepancy, while the brightest of NGC 3278’s galactic radio emission seen at the VLA was only 400 Jy bm-1, and appears well-resolved (Figure 2). It would seem improbable therefore that there would be such a bright and compact unrelated source of emission located so close to SN 2009bb.
The third possibility, which we consider most likely, is that there is substantial decorrelation in the VLBI measurements, due to uncorrected differences in atmospheric delay between SN 2009bb and the phase-reference source444We note that inaccuracies in the correlator model could also cause coherence loss, but are typically considerably smaller than the un-modelled contributions of the atmosphere.. In other words, the phase-calibration for SN 2009bb is of poor quality. Any determination of the source size must therefore be interpreted with caution. For a sufficiently strong source, the phase calibration could be improved by selfcalibration. SN 2009bb, however, was not bright enough to allow conventional selfcalibration using an image. As an alternative, we introduced the antenna phases as free parameters in the - plane modelfit. Unfortunately, due to the poor - coverage and the low signal-to-noise ratio, we were only able to obtain an upper limit of 0.64 mas to the source radius with this procedure. We found, however, that even with this effective phase selfcalibration, we were not able to recover more than about half of the VLA flux density. Our upper limit on SN 2009bb’s angular size is not a formal statistical limit because of various assumptions made in its derivation, but it is intended as a limit, and should be reasonably robust. We describe the exact procedure by which we arrive at this limit in the appendix for the interested reader.
Since the age of SN 2009bb at the time of our VLBI observations was 85 d, using a distance of 40 Mpc as well as assuming circular symmetry, this limit on the angular radius allows us to obtain a corresponding upper limit on the apparent expansion speed of .
4. DISCUSSION
We have made VLA and VLBI observations of the type I b/c supernova 2009bb. This supernova was of particular interest because the high level of radio emission showed that substantial material was ejected at relativistic speeds (Soderberg et al., 2010b). We discuss first the evolution of the radio light curve as revealed by our VLA measurements of the total flux density
4.1. Radio Light Curve Evolution
| Age (days)aaAge in days since shock breakout. | 20 | 52 | 81 | 145 |
|---|---|---|---|---|
| RadiusbbLinear size computed from radio spectrum by assuming SSA to be the dominant absorption mechanism. Radio spectra in Soderberg et al. (2010b). ( cm) | 4.4 | 8.0 | 22 | 26 |
| Angular Radius (mas)ccAngular radius (for Mpc). | 0.073 | 0.13 | 0.36 | 0.43 |
| Average Apparent Velocity | 0.85 | 0.60 | 0.71 | 0.69 |
Our new data reveal a continuing decline of the radio light curve of SN 2009bb at late times (Figure 3). By assuming that the turnover in the radio spectrum is due to SSA, we can estimate the size at different epochs from the four radio spectra published in Soderberg et al. (2010b). We give these values of the radius, along with the corresponding values angular radius and the average expansion velocity as a fraction of in Table 1. These are minimum radii: if the spectral turnover were due to, for example, FFA rather than SSA, the supernova would be larger. However, our VLBI measurement gives a upper limit on the radius of 0.64 mas at d, which rules out a radius much larger than those derived from SSA. In the case of SN 2009bb, much larger sizes and expansion velocities are probably ruled out also on energetic grounds, as Soderberg et al. (2010b) showed that the above size estimates imply an energy of erg coupled to relativstic ejecta, and much larger amounts of energy coupled to the relativistic ejecta are improbable. More generally, Chevalier (1998) shows that SSA is probably the dominant absorption mechanism for Type I b/c SNe. In summary, we think it unlikely that the sizes or velocities in Table 1 are substantially in error. These radius values suggests deceleration between = 20 d and 52 d, but possibly a re-acceleration between = 50 d and 81 d, and a relatively constant speed expansion since then.
A bump is visible in the light curves, which is most prominent at 5 GHz, where it peaks at d, and the flux density increases by a factor of 2 relative to the longer-term decay. In terms of spectral luminosity, the bump represents a relative increase of 1.2 erg s-1 Hz-1.
What is the origin of this bump? As mentioned, SN 2009bb was distinguished by having mildly relativistic ejecta. One hypothesis is that the bump could be driven by the “engine”, in other words represent a renewed injection of energy: similar bumps in the lightcurve were seen for GRB 980425/SN 1998bw (Kulkarni et al., 1998; Li & Chevalier, 1999) during the relativistic phase, and are thought to be engine-driven. The fact that the SSA sizes derived above suggest a re-acceleration between =50 d and 82 d would be consistent with this interpretation, in other words that there was a renewed energy input at the forward shock somewhere around d.
Alternatively, the bump may be related to the collision between the bulk of the ejecta, which are almost undecelerated, with the leading blast wave, which was initially relativistic but decelerates as it sweeps up the stellar wind. It is not straightforward to predict the outcome of this collision because it essentially depends on the poorly known distributions of density and velocity in the mildly relativistic, outermost layers of SN ejecta. We note, however, that this scenario is similar in many respects to that of the bump representing renewed energy input by the engine: in both cases the bump in the light curve is the result of the collision between the as yet undecelerated inner shell and the decelerating external shock. The difference may be in a possible deviation from a spherical symmetry, which is expected to be larger in the scenario of recurrent jets than in the present case. To summarize, we consider the bump in the light curve likely to be engine-driven, although the collision of the main ejecta with the external shock wave is not excluded.
Interestingly, even the case that bump is engine-driven, i.e., due to recurrent jet activity, the collision of the main SN ejecta with the decelerating blast wave is unavoidable. Such a collision might therefore be expected in supernovae similar to SN 2009bb or SN 1998bw at d, and may produce detectable effects in the radio lightcurves.
4.2. Source Size Derived from VLBI Observations
The primary goal of our VLBI observations was to set limits on the expansion speed by measuring the angular size of SN 2009bb. Unfortunately, the southern declination of the source meant that it was at low elevation for most of our VLBI array, which limited the quality of the data obtained, and consequently the accuracy of the determination of the source’s angular size.
We obtained an estimate of the source outer angular radius between 0 and 0.64 mas, suggesting average apparent expansion speeds between 0 and , with the limits intended to represent a range (see § 3.2 and the appendix for details of our size determination and the caveats applying thereto). This range of apparent expansion speeds implies a radius at d of cm and a bulk Lorentz factor of .
Soderberg et al. (2010b) showed that deceleration had likely occurred relatively early in SN 2009bb, with time of the non-relativistic transition d, occurring well before our VLBI observations. The recent simulations of aspherical supernova explosions in stripped-envelope stars by Couch et al. (2010) and Kifonidis et al. (2006) have also shown that even very aspherical energy releases have a largely spherical outer envelope by d. We would therefore expect an approximately spherical blast-wave at the time of our observations.
Soderberg et al. (2010b) also determined that at d, the radius of the supernova was 4.4 cm. If we assume a standard Sedov-von Neumann-Taylor evolution (see e.g., Granot & Loeb, 2003) after d, we would expect a radius at the time of our VLBI observations ( d) of 8 cm which is well within our observational limits on radius.
VLBI observations of SNe such as SN 2009bb are crucial to directly measuring the expansion speeds and perhaps the geometry of the radio emission, and thus important to confirming a jet model. However, such VLBI observations are difficult and generally limited by the available sensitivity and - coverage, especially if the supernova is at a southern declination. They should become easier in the future with the planned increases in sensitivity of the VLBA (Ulvestad et al., 2010), and by future availability of South African and Australian SKA pathfinder instruments, MeerKAT (Booth et al., 2009) and ASKAP (Johnston et al., 2008) respectively, as VLBI stations.
APPENDIX
In this appendix, we describe in detail how we arrived at the upper limit on the angular size of SN 2009bb from the VLBI observations. We first made an image from the strictly phase-referenced VLBI data for SN 2009bb, using robust weighting and dropping any data taken with telescope elevations below 12°. We found a peak brightness of only Jy bm-1 for a convolving beam of mas at p.a. 0° (FWHM). Even if we restrict ourselves to the baseline-lengths of M,we found a peak brightness of only Jy bm-1, with a convolving beam size of mas. We note however, that due to the uneven - coverage, the sidelobe levels are quite high, reaching peaks %, and that deconvolution is therefore likely not very reliable.
As an alternative to imaging, avoiding the need for deconvolution, we fit a spherical shell model directly to the complex visibilities by least squares as described in § 3.2 above. When fitting the strictly phase-referenced visibility data, the best-fit model had a total flux density of Jy with an outer angular radius, , of 0.47 mas, and a best-fit center position of , . This is the position estimate given in § 3.2 above.
The total flux density of 730 Jy recovered from strictly phase-referenced data is considerably below the value of mJy measured at the VLA (§ 3.1). As detailed in § 3.2 we think this discrepancy is unlikely to be due to either a supernova which is so large as to be over-resolved by the VLBI measurements or to an unrelated nearby source of emission. The discrepancy is therefore most likely due to decorrelation, in other words poor phase calibration. Since most of observations were of necessity made at relativly low elevations, difficulties in calibration are perhaps not unexpected.
Our phase-calibration for J1036-3744 is of good quality, as attested to by our recovery of 90% of its VLA flux density. The delay changes relatively smoothly as a function of time, so there is no reason to suspect the interpolation in time between the J1036-374 scans to the intervening SN 2009bb scans. SN 2009bb, however, is 2.5° away on the sky, with the difference being predominately in declination. Any un-modeled elevation dependence of the delay will therefore result in errors in the delay for SN 2009bb, and poor phase-referencing. The sitution for SN 2009bb is particularly bad since the difference in source position is mostly in declination and since the observations are mostly at low elevation where the airmass is large. Self calibration in phase would in principle allow improving the calibration of the supernova visibilities, although it does have the drawback of introducing biases (see e.g., Massi & Aaron, 1999; Martí-Vidal & Marcaide, 2008), which can be severe in the case of low signal-to-noise.
As our signal-to-noise ratio is too low for traditional selfcalibration using images, we instead introduce the phases of the complex antenna gains as free parameters in the model-fitting procedure, using a slightly modified version of the AIPS task OMFIT. This procedure has the advantage of allowing a more quantitative measure of the goodness-of-fit than traditional selfcalibration using images. Due to the low signal-to-noise, we fitted for only a single phase solution common all 8 intermediate-frequency channels. We fix the source position at the best-fit position obtained above, and let the antenna phases vary on a 30-min timescale. The best fit model for SN 2009bb obtained in this way had mas and a flux density of mJy (statistical uncertainties). Even in this case, the total flux density in the model was only 54% of that measured at the VLA.
For a partly resolved source, the fitted source size is generally also correlated with the antenna amplitude gains. We tested for an additional uncertainty due to mis-calibration of the antenna amplitude gains by artificially varying individual antenna gains by , and then fitting a model to SN 2009bb as above. The resulting rms variation in was 0.05 mas. Adding this to the above uncertainties in quadrature results in a value for of mas.
As mentioned, selfcalibration can introduce biases. To test for this possibility, we calculated simulated visibilities from models with various values of and random noise at a level corresponding to that in our observations. We then fit these simulated visibilities using the same procedure as above, including the addition of the antenna phases as free parameters. These tests suggests that the true value of is in fact 18% higher than that determined from the fitting. For simplicity, we carried out this test using a disk, rather than a spherical shell model, that the relative bias in should be very similar. In other words, selfcalibration tends to make the source appear more compact.
Correcting for this bias, we thus arrive at a final, unbiased estimate of for SN 2009bb of mas, with a upper limit of 0.59 mas. However as noted above, even with phase-selfcalibration, the fitted flux density is still notably below that measured by the VLA, which suggests the presence of further decorrelation (or some other source of error). As the signal-to-noise is already lower than is generally considered safe for selfcalibration, using a shorter solution interval is not advisable.
As a final test, we fixed the model flux density at 2.0 mJy, a round value slightly below but near that measured by the VLA, and again fitted a model of the source as well as the antenna gain-phases. We find that the best fit to the VLBI visibilities is not much larger than the above estimates, having mas, with a statistical upper limit of 0.64 mas. We note that forcing such a large flux density on the model results in a significant increase in over models with lower flux density.
The VLBI visibilities, therefore, seem to robustly suggest a total flux density for SN 2009bb of % of that observed at the VLA. Given this inconsistency, the biases involved in phase-selfcalibration, and the likelihood of coherence losses not accounted for by our phase-selfcalibration, we suggest a probable range for the outer radius of SN 2009bb of mas. The failure to recover the total flux density suggests the possibility that significant decorrelation remains in the VLBI data, but such decorrelation is more likely to increase the apparent size of the source than decrease it, so our upper limit on the angular size should be robust.
A very similar phenomenon was seen in the case of SN 2007gr. Also for this SN, the flux density recovered from VLBI observations was considerably lower than the total flux density measured by a connected-element interferometer. Initially, this discrepancy was interpreted as suggesting a large source size and thus relativistic expansion (Paragi et al., 2010). This was somewhat surprising, given that SN 2007gr’s peak 8.4-GHz spectral luminosity was relatively low, being 500 times lower than that of SN 2009bb. Soderberg et al. (2010a) showed that the radio lightcurves and the lack of detectable X-ray emission were fully consistent with a normal, non-relativistic SN, but were in fact hard to reconcile with relativistic expansion. They also re-examined the SN 2007gr VLBI data and showed that the low VLBI flux density was observed on both short and long baselines, and if it was to be explained by a large, heavily-resolved source, required very large apparent expansion velocities of . They conclude that coherence losses which were larger than normal but not improbably so provided an explanation which as plausible as the original one of modestly relativistic expansion for SN 2007gr. In the present case of SN 2009bb, some loss of coherence is not unexpected, given that the southern declination of the source necessitated observations made mostly at low elevation.
References
- Bartel & Bietenholz (2008) Bartel, N., & Bietenholz, M. F. 2008, ApJ, 682, 1065, arXiv:0806.3482
- Bartel et al. (2002) Bartel, N. et al. 2002, ApJ, 581, 404
- Berger et al. (2003) Berger, E., Kulkarni, S. R., Frail, D. A., & Soderberg, A. M. 2003, ApJ, 599, 408, arXiv:astro-ph/0307228
- Bietenholz & Bartel (2005) Bietenholz, M. F., & Bartel, N. 2005, ApJ, 625, L99
- Bietenholz & Bartel (2007) ——. 2007, ApJ, 665, L47, arXiv:0706.3344
- Bietenholz et al. (2003) Bietenholz, M. F., Bartel, N., & Rupen, M. P. 2003, ApJ, 597, 374, arXiv:astro-ph/0307382
- Bietenholz et al. (2009) Bietenholz, M. F., Soderberg, A. M., & Bartel, N. 2009, ApJ, 694, L6
- Booth et al. (2009) Booth, R. S., de Blok, W. J. G., Jonas, J. L., & Fanaroff, B. 2009, ArXiv e-prints, 0910.2935
- Chevalier (1998) Chevalier, R. A. 1998, ApJ, 499, 810
- Cobb et al. (2010) Cobb, B. E., Bloom, J. S., Perley, D. A., Morgan, A. N., Cenko, S. B., & Filippenko, A. V. 2010, ApJ, 718, L150, 1005.4961
- Couch et al. (2010) Couch, S. M., Pooley, D., Wheeler, J. C., & Milosavljevic, M. 2010, ArXiv e-prints, 1007.3693
- Galama et al. (1998) Galama, T. J. et al. 1998, Nature, 395, 670, arXiv:astro-ph/9806175
- Granot & Loeb (2003) Granot, J., & Loeb, A. 2003, ApJ, 593, L81, arXiv:astro-ph/0305379
- Johnston et al. (2008) Johnston, S. et al. 2008, Experimental Astronomy, 22, 151, 0810.5187
- Kifonidis et al. (2006) Kifonidis, K., Plewa, T., Scheck, L., Janka, H., & Müller, E. 2006, A&A, 453, 661, arXiv:astro-ph/0511369
- Kulkarni et al. (1998) Kulkarni, S. R. et al. 1998, Nature, 395, 663
- Levesque et al. (2010) Levesque, E. M. et al. 2010, ApJ, 709, L26, 0908.2818
- Li & Chevalier (1999) Li, Z., & Chevalier, R. A. 1999, ApJ, 526, 716, arXiv:astro-ph/9903483
- Malesani et al. (2004) Malesani, D. et al. 2004, ApJ, 609, L5, arXiv:astro-ph/0405449
- Martí-Vidal & Marcaide (2008) Martí-Vidal, I., & Marcaide, J. M. 2008, A&A, 480, 289, 0801.1272
- Massi & Aaron (1999) Massi, M., & Aaron, S. 1999, A&AS, 136, 211
- Mazzali et al. (2010) Mazzali, P. A., Maurer, I., Valenti, S., Kotak, R., & Hunter, D. 2010, MNRAS, 1078, 1006.4259
- Paragi et al. (2005) Paragi, Z., Garrett, M. A., Paczyński, B., Kouveliotou, C., Szomoru, A., Reynolds, C., Parsley, S. M., & Ghosh, T. 2005, Memorie della Societa Astronomica Italiana, 76, 570, arXiv:astro-ph/0505468
- Paragi et al. (2010) Paragi, Z. et al. 2010, Nature, 463, 516, 1001.5060
- Paragi et al. (2008) Paragi, Z., van der Horst, A., Kouveliotou, C., Garrett, M., Wijers, R. A. M. J., Granot, J., Ramirez-Ruiz, E., & Strom, R. 2008, in The role of VLBI in the Golden Age for Radio Astronomy
- Paturel et al. (2003) Paturel, G., Petit, C., Prugniel, P., Theureau, G., Rousseau, J., Brouty, M., Dubois, P., & Cambrésy, L. 2003, A&A, 412, 45
- Petrov et al. (2006) Petrov, L., Kovalev, Y. Y., Fomalont, E. B., & Gordon, D. 2006, AJ, 131, 1872, arXiv:astro-ph/0508506
- Pian et al. (2006) Pian, E. et al. 2006, Nature, 442, 1011, arXiv:astro-ph/0603530
- Pignata et al. (2009a) Pignata, G. et al. 2009a, in American Institute of Physics Conference Series, Vol. 1111, American Institute of Physics Conference Series, ed. G. Giobbi, A. Tornambe, G. Raimondo, M. Limongi, L. A. Antonelli, N. Menci, & E. Brocato, 551–554
- Pignata et al. (2009b) Pignata, G. et al. 2009b, Central Bureau Electronic Telegrams, 1731, 1
- Schinzel et al. (2009) Schinzel, F. K., Taylor, G. B., Stockdale, C. J., Granot, J., & Ramirez-Ruiz, E. 2009, ApJ, 691, 1380, 0810.1478
- Soderberg et al. (2010a) Soderberg, A. M., Brunthaler, A., Nakar, E., Chevalier, R. A., & Bietenholz, M. F. 2010a, ArXiv e-prints, 1005.1932
- Soderberg et al. (2010b) Soderberg, A. M. et al. 2010b, Nature, 463, 513, 0908.2817
- Soderberg et al. (2006a) ——. 2006a, Nature, 442, 1014, arXiv:astro-ph/0604389
- Soderberg et al. (2006b) Soderberg, A. M., Nakar, E., Berger, E., & Kulkarni, S. R. 2006b, ApJ, 638, 930, arXiv:astro-ph/0507147
- Stanek et al. (2003) Stanek, K. Z. et al. 2003, ApJ, 591, L17, arXiv:astro-ph/0304173
- Starling et al. (2010) Starling, R. L. C. et al. 2010, ArXiv e-prints, 1004.2919
- Stritzinger et al. (2009) Stritzinger, M., Philips, M. M., Morrell, N., Salgado, F., & Folatelli, G. 2009, Central Bureau Electronic Telegrams, 1751, 1
- Taylor et al. (2004) Taylor, G. B., Frail, D. A., Berger, E., & Kulkarni, S. R. 2004, ApJ, 609, L1
- Ulvestad et al. (2010) Ulvestad, J. S., Romney, J. D., Brisken, W. F., Deller, A. T., Walker, R. C., & Durand, S. J. 2010, in Bulletin of the American Astronomical Society, Vol. 41, Bulletin of the American Astronomical Society, 407