Eight -ray pulsars discovered in blind frequency searches of Fermi LAT data
Abstract
We report the discovery of eight -ray pulsars in blind frequency searches using the Large Area Telescope (LAT), onboard the Fermi Gamma-ray Space Telescope. Five of the eight pulsars are young ( kyr), energetic ( erg s-1), and located within the Galactic plane (). The remaining three are older, less energetic, and located off the plane. Five pulsars are associated with sources included in the Fermi-LAT bright -ray source list, but only one, PSR J14136205, is clearly associated with an EGRET source. PSR J10235746 has the smallest characteristic age ( kyr) and is the most energetic ( erg s-1) of all -ray pulsars discovered so far in blind searches. PSRs J1957+5033 and J2055+25 have the largest characteristic ages ( Myr) and are the least energetic ( erg s-1) of the newly-discovered pulsars. We present the timing models, light curves, and detailed spectral parameters of the new pulsars. We used recent XMM observations to identify the counterpart of PSR J2055+25 as XMMU J205549.4+253959. In addition, publicly available archival Chandra X-ray data allowed us to identify the likely counterpart of PSR J10235746 as a faint, highly absorbed source, CXOU J102302.8–574606. The large X-ray absorption indicates that this could be among the most distant -ray pulsars detected so far. PSR J10235746 is positionally coincident with the TeV source HESS J1023575, located near the young stellar cluster Westerlund 2, while PSR J1954+2836 is coincident with a 4.3 excess reported by Milagro at a median energy of 35 TeV. Deep radio follow-up observations of the eight pulsars resulted in no detections of pulsations and upper limits comparable to the faintest known radio pulsars, indicating that these pulsars can be included among the growing population of radio-quiet pulsars in our Galaxy being uncovered by the LAT, and currently numbering more than 20.
1 Introduction
Until the launch of the Fermi Gamma-ray Space Telescope, only seven pulsars were found to have pulsed emission in rays (Thompson, 2008), and only one of these pulsars (Geminga) was undetectable by radio telescopes (i.e. radio quiet). The Large Area Telescope (LAT) has detected -ray emission from a large number of pulsars using radio ephemerides, both from young isolated pulsars (e.g. Abdo et al., 2009c, h), and from millisecond pulsars (Abdo et al., 2009a). In addition, sixteen pulsars were found in blind frequency searches of the LAT -ray data (Abdo et al., 2009b). Radio follow-up observations of those pulsars resulted in the detection of radio pulsations from three of them: PSRs J1741–2054 and J2032+4127 (Camilo et al., 2009) and PSR J1907+0602 (Abdo et al., 2010b). Two of these were found to have remarkably low radio luminosities. Perhaps more surprising is the fact that 13 out of these 16 pulsars were not detected in radio (Ray et al., 2010), and should therefore be considered radio quiet, or at least radio faint.
This paper reports on eight new -ray pulsars discovered in blind frequency searches of LAT data, not included in the recently published First Fermi LAT Catalog of -ray Pulsars (Abdo et al., 2009d). As in the pulsar catalog paper, we present detailed timing and spectral results for each of these pulsars, including the pulse shape parameters, the fluxes, and the spectral indices and energy cutoffs for each pulsar. We also discuss possible associations, including previous -ray detections. While a large number of the first sixteen -ray pulsars discovered in blind searches (Abdo et al., 2009b) were found to be coincident with previously known -ray sources, such as EGRET unidentified sources, none of the pulsars in this sample have a definite counterpart in the 3rd EGRET catalog (Hartman et al., 1999), although one pulsar, PSR J14136205, has a counterpart, EGR J14146244, in a revised catalog of EGRET sources (Casandjian & Grenier, 2008). This pulsar is also coincident with the AGILE source 1AGL J14126149 (Pittori et al., 2009). We also discuss possible X-ray and TeV associations with the newly-discovered pulsars. The 8 pulsars identified here are among the 1451 sources included in the Fermi LAT First Source Catalog111Available at http://fermi.gsfc.nasa.gov/ssc/data/access/lat/1yr_catalog/ (Abdo et al., 2010a).
Finally, deep radio follow-up observations of these eight new pulsars have resulted in no new detections of pulsations, and we include the upper limits of our radio searches.
2 Observations and Data Analysis
The LAT is a high-energy -ray telescope onboard the Fermi satellite that is sensitive to photons with energies from 20 MeV to over 300 GeV. It features a solid-state silicon tracker, a cesium-iodide calorimeter and an anti-coincidence detector (Atwood et al., 2009). Events recorded with the LAT have time stamps derived from a GPS-synchronized clock on the Fermi satellite with s accuracy (Abdo et al., 2009i).
For pulsar science, the LAT represents a major advance over EGRET. It has a much larger effective area (8000 cm2 for 1 GeV photons at normal incidence, or approximately 6 times that of EGRET), a larger field of view (2.4 sr, or almost five times that of EGRET), and a finer point spread function (68% containment angle of 06 at 1 GeV for the Front section and about a factor of 2 larger for the Back section, vs. 17 at 1 GeV for EGRET). The LAT also has a more efficient viewing strategy, operating primarily in continuous sky survey mode, as opposed to the inertial pointing mode used by EGRET 222For a single region in particular, however, a pointed observation would be more efficient for detecting pulsations, by accumulating more photons over a shorter time period.. This optimizes the amount of time the sky is in the field of view, covering the entire sky every two orbits (3 hr). These improvements allow more photons to be accumulated per unit time, and provide a better signal-to-noise ratio in photon selection, making the LAT the first highly effective instrument for blind searches of -ray pulsars (Abdo et al., 2009b). For more details on the LAT, see Atwood et al. (2009).
2.1 Blind Frequency Searches
Since -ray photon data are extremely sparse (a typical -ray pulsar flux in the LAT may be of order 1000 photons per year), searches for -ray pulsars require long integration times. Furthermore, young rotation-powered pulsars spin down as they radiate away energy, so their signals are not precisely periodic, making it necessary to search over a range of both frequencies and frequency derivatives. Fully coherent blind searches for -ray pulsars are therefore extremely computer intensive, since the number of frequency bins in the FFT increases with the length of the observational time (), where is the duration of the observation and is the maximum search frequency (Chandler et al., 2001). A fully coherent pulsar search, for example, would require the computation of hundreds of thousands of Gigapoint FFTs to cover the spin-down range of the majority of young -ray pulsars. Such a search would also be highly sensitive to timing irregularities (e.g. timing noise and glitches). Instead, calculating the FFT of the arrival time differences, up to a maximum time difference of order week, greatly reduces the number of bins in the FFT. By doing this, we are able to reduce dramatically the computational demands (both in processor and memory), as well as the required number of trials to span the same parameter space, while at the same time reducing our sensitivity to timing noise. All of this is achieved with only a modest reduction in the sensitivity, relative to fully coherent techniques (Atwood et al., 2006). For these searches, we used a maximum time difference of ( days). We binned our difference search at a time resolution of 7.8 ms, resulting in a Nyquist frequency of 64 Hz for our searches and searched through 2000 steps of width s-1 to cover roughly the spin-down range up to that of the Crab pulsar (s-1).
The data analyzed in this paper were collected from sky survey mode observations beginning on 2008 August 4 (MET333Mission Elapsed Time (MET), the number of seconds since the reference time of January 1, 2001, at 0h:0m:0s in the Coordinated Universal Time (UTC) system, corresponding to a Modified Julian Date (MJD) of 51910 in the UTC system. = 239557414, MJD = 54682) and ending on 2009 July 4 (MET = 268411953, MJD = 55016). We used events with the most stringent background cuts (diffuse class photons of Pass 6.3 (Atwood et al., 2009)) with zenith angle (to avoid photons from the Earth’s limb), and rocking angle444The rocking angle is the angle between the pointing direction of the LAT and the zenith direction, defined as the direction along a line from the center of the earth through the spacecraft. . In addition, a few minutes were excised around two bright gamma-ray bursts (GRBs 080916C and 090510). We applied the time-differencing technique to photons with energies above 300 MeV, selected from a 0.8–0.9∘ (see Table 3) circular region of interest (ROI) around selected target positions given by the LAT first source catalog (Abdo et al., 2010a). We corrected the photon event times from each source to the solar system barycenter using the Fermi Science Tool gtbary, assuming all photons come from the target position. We searched 650 source positions from a preliminary version of the Fermi LAT First Source Catalog555Note that at the time we carried out our searches, the 8 sources in which we found these pulsars were not known to contain a pulsar and their position was therefore much less well determined. (Abdo et al., 2010a) that were not coincident with likely active galactic nuclei (AGN).
After finding a significant signal in the initial search, we followed up on the candidate signal by performing an epoch-folding search over a narrow region of frequency and frequency-derivative space using the PRESTO (Ransom, 2001) pulsar software suite. All eight pulsars were discovered within months of routine survey observations. They have since been confirmed with several months of additional data. A pulsar detection is confirmed if adding the new data and folding using the original timing solution results in a continued increase in the significance of the detection of the pulsation, as measured by the chi-squared obtained from fitting the pulse profile to a constant.
Compared to previous searches, the ones reported here are considerably more sensitive. In particular, these searches benefit from more than twice the amount of data, and a much better LAT source localization, than those that resulted in the discovery of the first 16 blind search -ray pulsars (Abdo et al., 2009b). The names and locations of the new pulsars are given in Table 1, along with known associations, including those from the Fermi LAT First Source Catalog (Abdo et al., 2010a) and the Bright Gamma-ray Source List (Abdo et al., 2009f)
2.2 Timing Analysis
We have generated phase-connected pulse timing models for each of the pulsars. To do this, we first extracted photons for each source using a radius and energy cut chosen to optimize the signal to noise ratio for each pulsar. We corrected the photon event times to the geocenter using gtbary in its geocentric mode. We then determined a set of times of arrival (TOAs) by first dividing our data into segments of approximately equal duration666The number of days of LAT data used to generate each TOA varied for the different pulsars, ranging from 9 days for PSR J2055+25 to 23 days for PSR J1846+0919. See Table 2. and then folding the photon times using a preliminary ephemeris to generate a set of pulse profiles. The TOAs were then measured by cross-correlating each pulse profile with a kernel density template that was derived from fitting the full mission data set, as described in Ray et al. (2010). Finally, we used Tempo2 (Hobbs et al., 2006) to fit the TOAs to a timing model that included position, frequency, and frequency derivative. In the case of PSR J1023–5746, our timing model also included second and third derivative terms, as well as a glitch, as described below. The timing solutions, along with the number of days of data and TOAs that went into generating them, and the rms of the resulting model, are given in Table 2 (with the positions in Table 1). In the case of PSR J14136205, there is an apparent glitch at MJD 54735. Periodicity searches of the data before the glitch indicate that the magnitude was , fairly large, though not unusually so for young Vela-like pulsars (Dodson et al., 2002; Saz Parkinson, 2009). However, the short span of data before the glitch prevented us from including the glitch in the timing model and thus the model for J1413–6205 in the table is constructed only from post-glitch data.
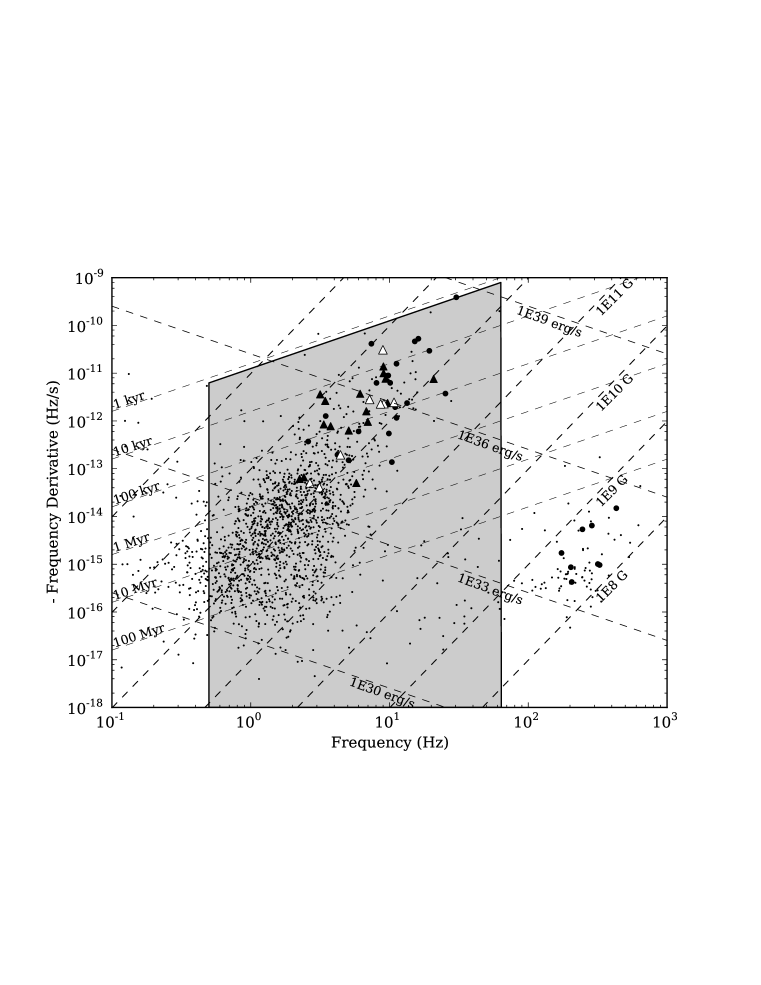
The case of PSR J1023–5746 is especially complicated. As is often the case in young pulsars (Hobbs et al., 2004), this pulsar suffers from large timing irregularities. In addition to experiencing a glitch of magnitude at MJD 55041, this pulsar has a level of timing noise that required the use of higher order frequency derivative terms to model. Our model that fitted for position required terms up to to obtain featureless residuals to the fit and resulted in a position that is 2″from the Chandra X-ray source CXOU J102302.8–574606. To test whether the proposed association with CXOU J102302.8–574606 was compatible with the timing measurements, we made a fit with the position fixed at that of the Chandra source. This model required terms up to , but also resulted in a good fit with essentially featureless residuals. The high order polynomial terms required to model the timing noise are strongly covariant with the position, resulting in the statistical errors being a significant underestimate of the true error. The Tempo2 timing models used in this paper will be made available online at the FSSC web site777http://fermi.gsfc.nasa.gov/ssc/data/access/lat/ephems/. Figure 1 shows the distribution in frequency and frequency derivative of the new pulsars (shown with unfilled triangles), compared with the previously known -ray selected pulsars (shown as solid triangles) (Abdo et al., 2009b) and the total known pulsar population.
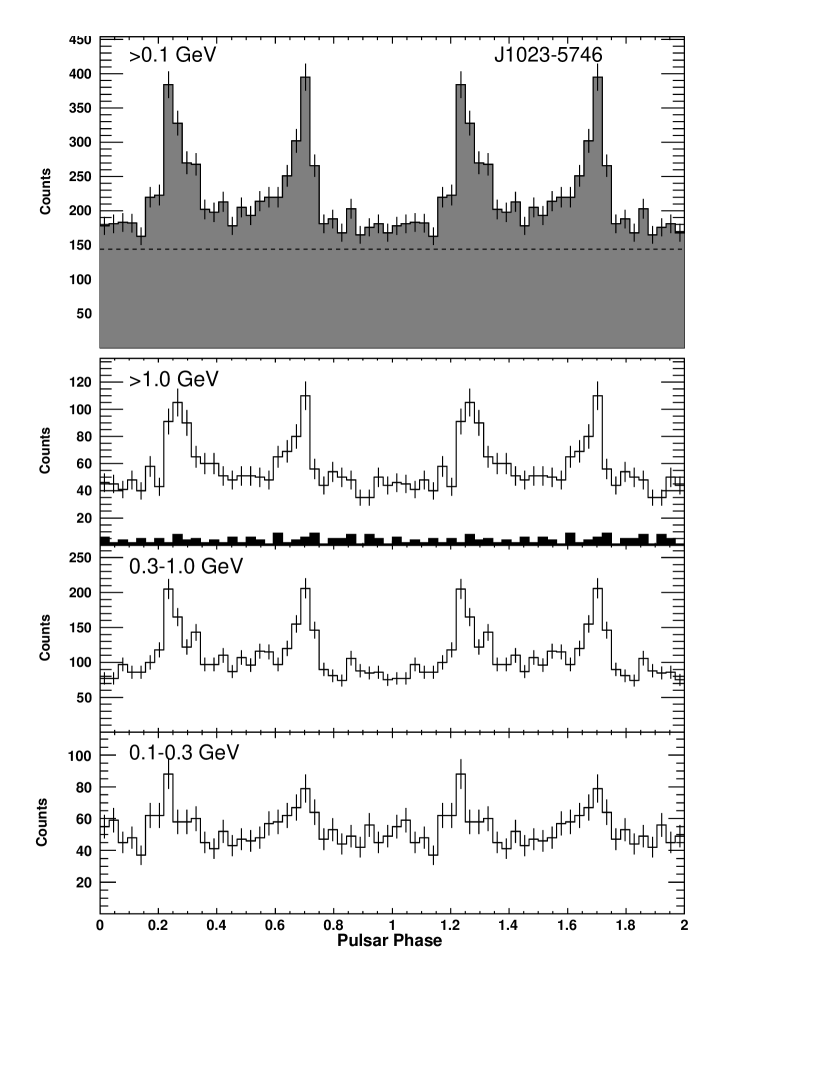
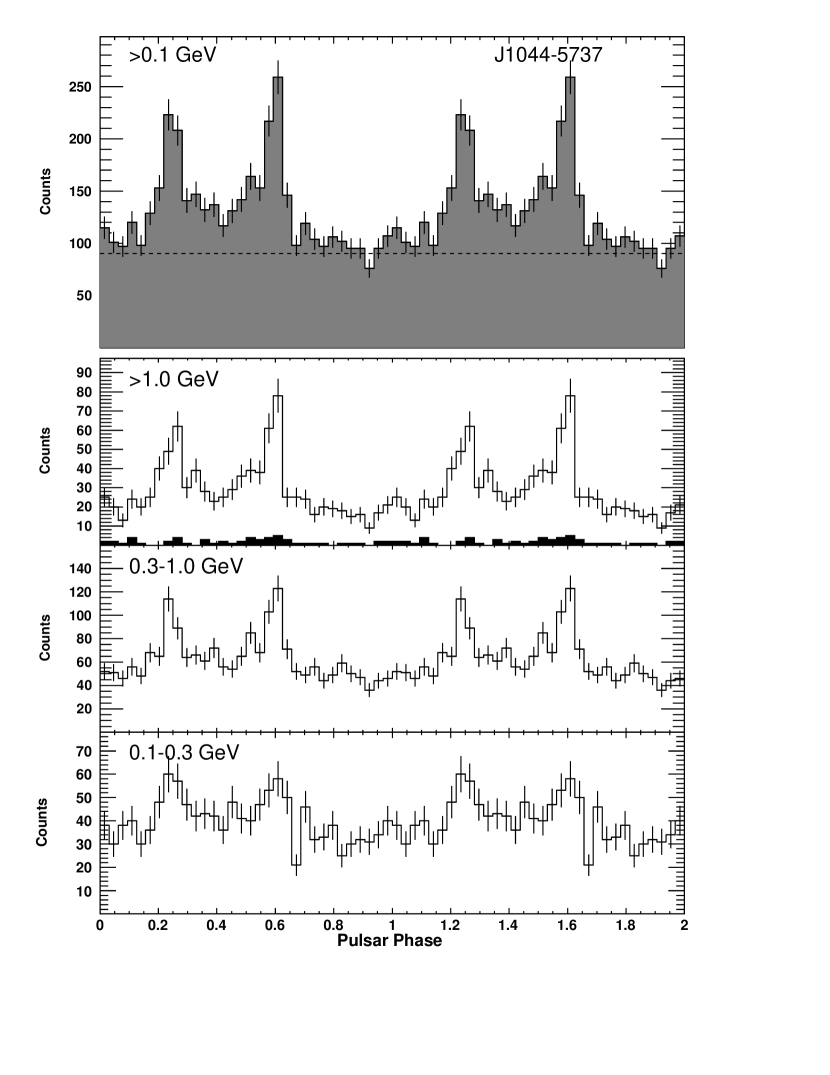
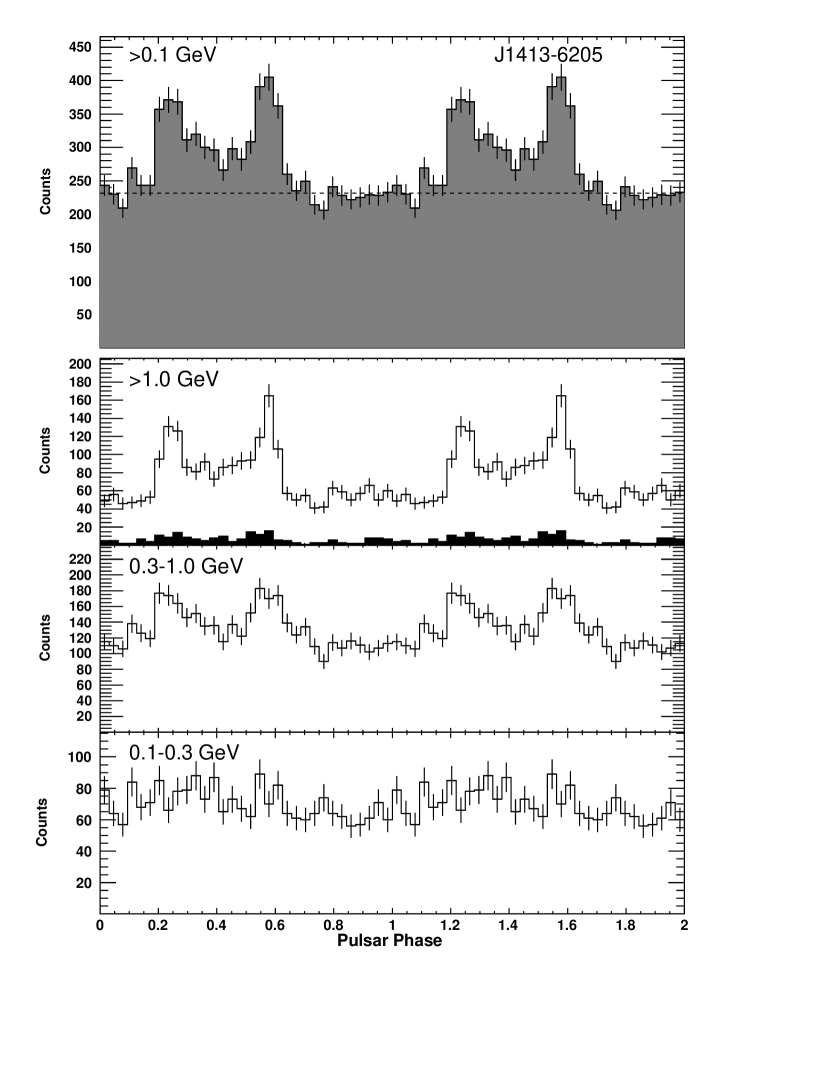
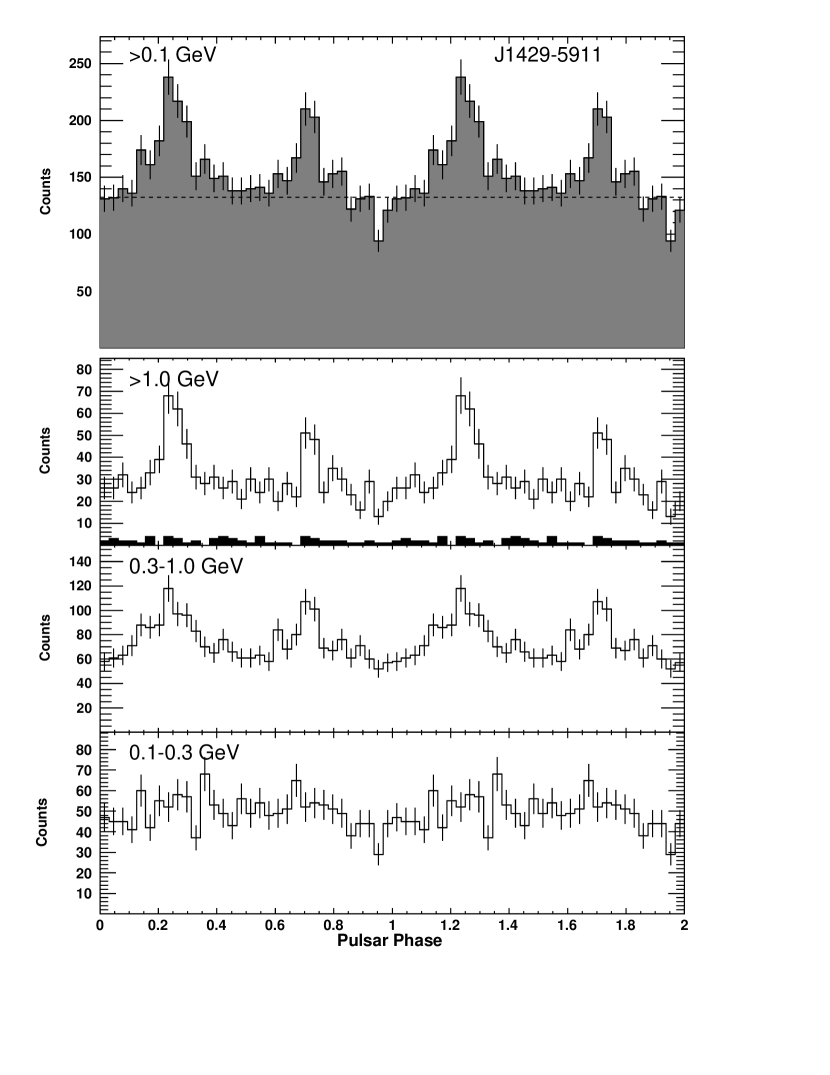
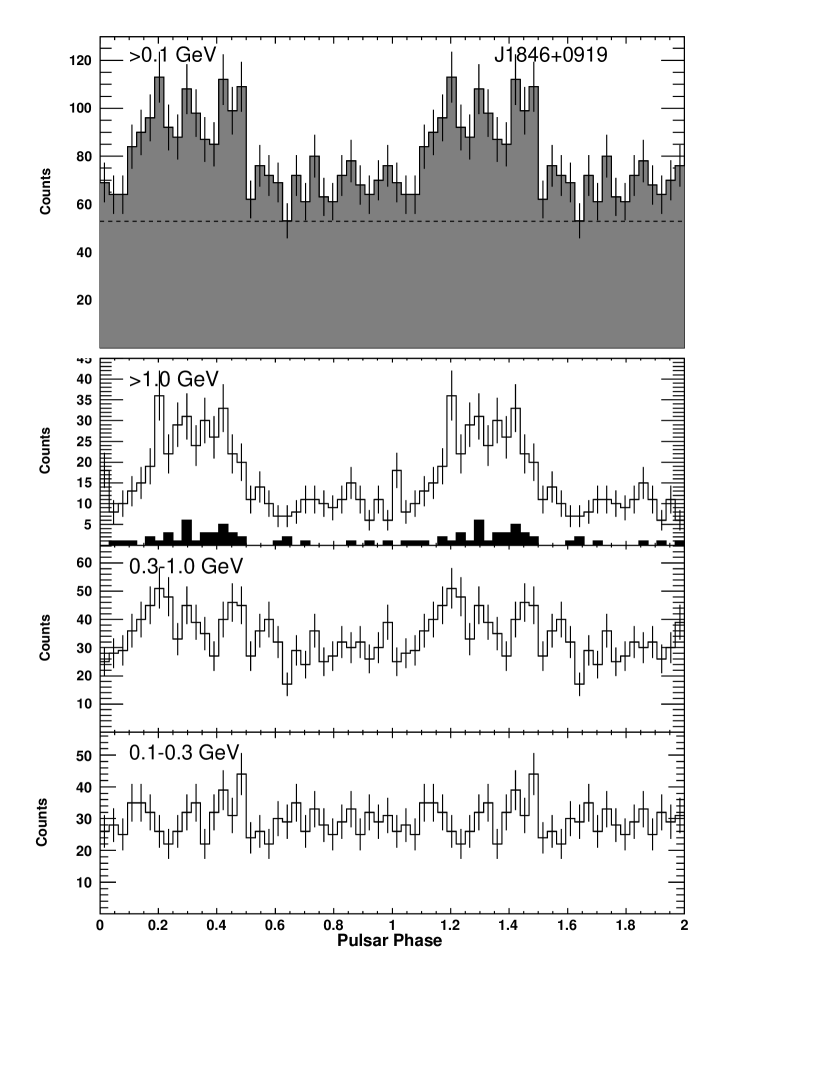
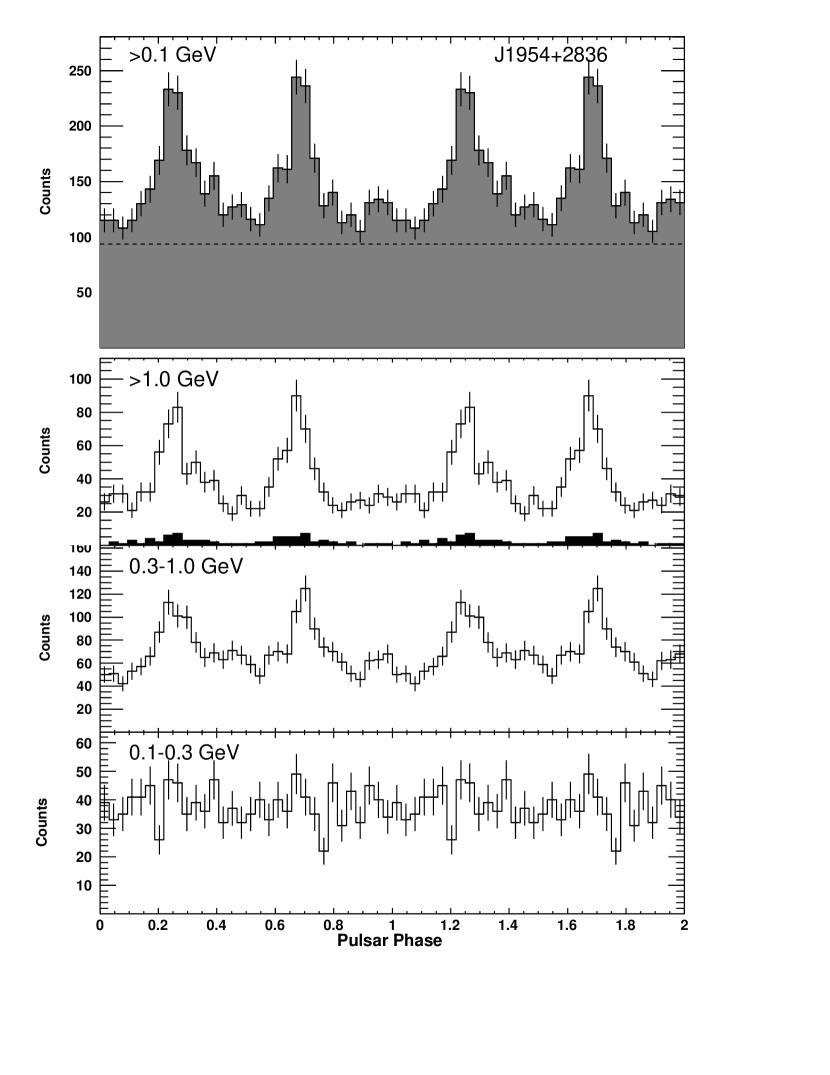
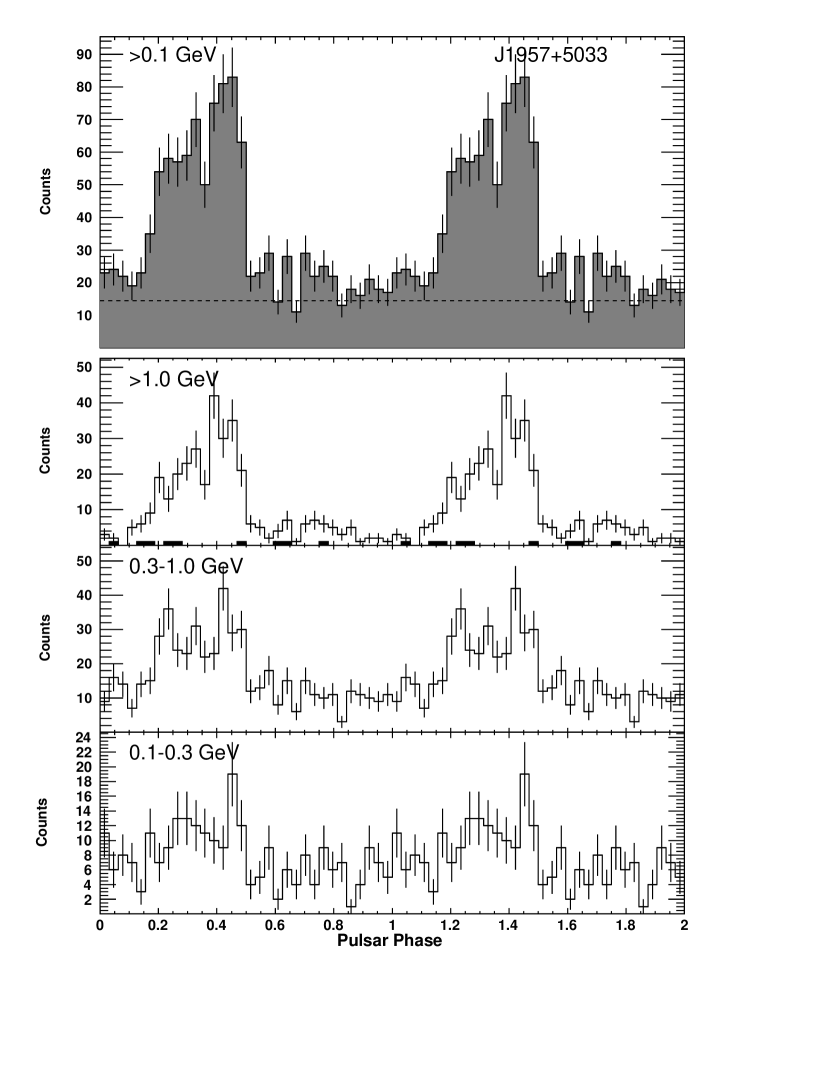
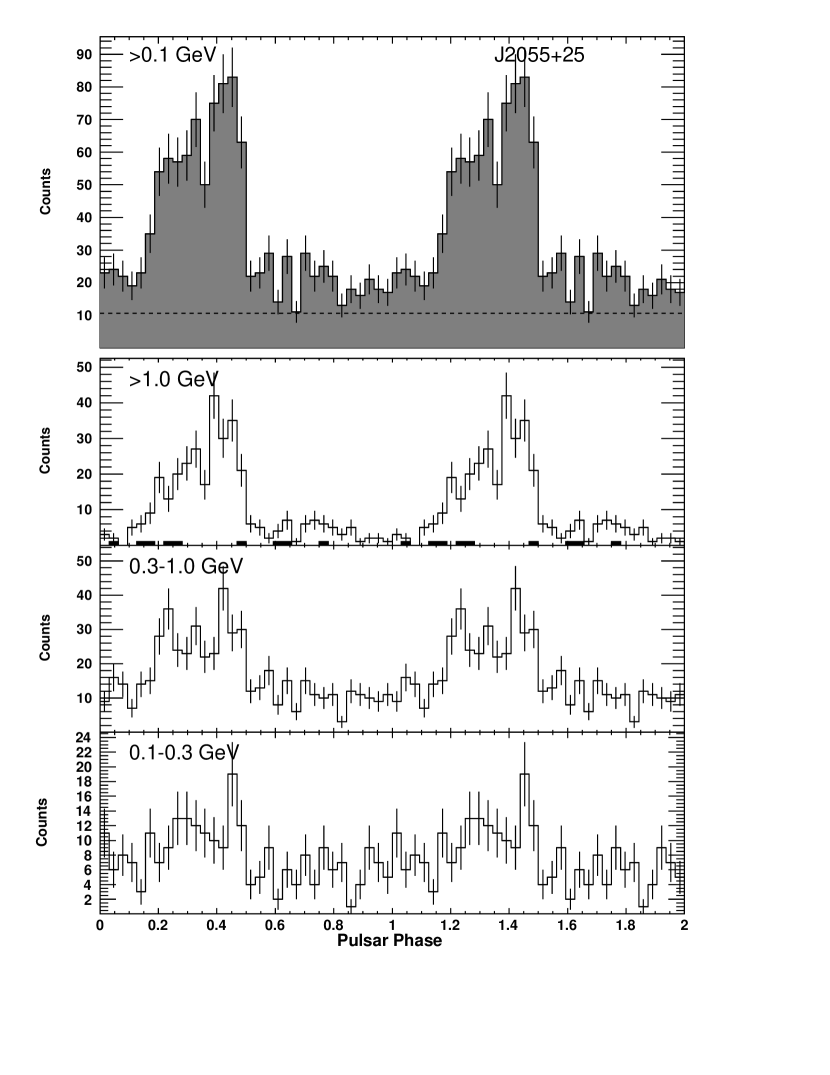
Figures 2-9 show the folded light curves (two rotations, for clarity, and 32 bins per rotation) of the eight new pulsars in five energy bands ( 100 MeV, 100–300 MeV, 300–1000 MeV, 1 GeV, and 5 GeV), ordered by increasing right ascension. Each band illustrates the peak structure across different energies. The phases have been shifted so that the “first” peak lies approximately at =0.25. The name of each peak (i.e. “first” vs “second”) refers to their respective order of arrival relative to the off-peak emission. We caution, however, that for some pulsars (e.g. PSR J1954+2836) there may be no appreciable difference between the off-peak emission and the “bridge” emission between the two peaks, leading to some ambiguity in such designation. Consequently, there is also some ambiguity in our measurement of the corresponding peak separation. Five of the eight pulsars have a clear double peak structure, while three of them (PSR J1846+0919, PSR J1957+5033, and PSR J2055+25) are currently dominated by a single broad peak. For those pulsars showing a single peak, we tried folding the events at half or a third of the frequency (in case the original frequency found in our search was the second or third harmonic), but the various peaks obtained in this way were not statistically distinguishable. The additional statistics accumulated from continued observations by the LAT are necessary to firmly establish whether the single broad peaks are real, or whether they can be resolved into narrow multiple peaks with small peak separations.
The pulse shape parameters, including peak multiplicity, -ray peak separation (computed by fitting the peaks with two gaussians and taking the difference between the means), and off-peak definition, are given in Table 3.
2.3 Spectral Analysis
We have performed the same spectral analysis on the eight pulsars as was performed on the 46 pulsars presented in the First LAT Catalog of -ray Pulsars (Abdo et al., 2009d). The pulsar spectra were fitted with an exponentially cut off power law model of the form:
| (1) |
where the three parameters are the photon index , the cutoff energy , and a normalization factor (in units of ph cm-2 MeV-1), defined at an energy of 1 GeV. In order to extract the spectra down to 100 MeV, we must take into account all neighboring sources and the diffuse emission together with each pulsar. This was done using a 6-month source list that was generated in the same way as the Bright Source List, following the prescription described in Abdo et al. (2009d). We used all events in an ROI of 10∘ around each pulsar, and included all sources up to 17∘ into the model (sources outside the ROI can contribute at low energy). The spectral parameters for sources outside a 3∘ radius of the pulsar were frozen, taken from the all-sky analysis, while those for the pulsar and sources within 3∘ were left free for this analysis. In general, nearby -ray sources are modeled by a simple power law. In the case of PSR J1023–5746, however, the nearby sources include the -ray pulsar PSR J1028–5819 (Abdo et al., 2009c), as well as the bright pulsar-like LAT source 1FGL J1018.6-5856, both of which were modeled by a power law with an exponential cutoff. For the eight pulsars, an exponentially cut off power law spectral model was significantly better than a simple power law. This can be seen by computing the test statistic = 2log(likelihood) of the model with a cutoff relative to one with no cutoff, as shown in column 7 of Table 4, where the lowest value of is 20. Because the -ray sources we are fitting might contain a significant unpulsed component, we attempt to improve our fits to the pulsar spectrum by splitting the data into an on-peak and off-peak component, and performing the fit only to the on-peak events, while using the off-peak component to better estimate our background. Table 3 gives the definition of the off-peak phase intervals (the on-peak interval being the complement of the off-peak one), as determined by visual inspection of the light curves in all energy bands (the same method used in Abdo et al., 2009d). We used the off-peak window to estimate the unpulsed emission. We re-fitted the on-peak emission to the exponentially cut off power law, with the off-peak emission (scaled to the on-peak phase interval) added to the model and fixed to the off-peak result. The resulting spectral index and energy cutoff for the on-peak emission of each pulsar are those given in columns 4 and 5 of Table 4. For more details on the spectral fitting see Abdo et al. (2009d).
Three of the pulsars (J1023–5746, J1413–6205, and J2055+25) showed significant emission (25) in the off-peak component. The off-peak energy spectrum of PSR J1023–5746 shows no indication of a cutoff. Furthermore, the distribution of this emission does not follow the Galactic plane (as might be expected if this were due to an improperly modeled diffuse background) and peaks close to the pulsar position, all of which suggests that such emission may be due to a pulsar wind nebula (PWN). However, the other two pulsars, J1413–6205 and J2055+25, have an off-peak component that is best fit by a power law with exponential cutoff, with photon index of and , and GeV and GeV respectively. This could be an indication of magnetospheric origin, similar to what is seen in the case of PSR J1836+5925 (Abdo et al., 2009e). We caution, however, that these results are subject to some caveats. In the case of J1413–6205, the significance of the preference of the power law with a cutoff over a simple power law is marginal (a of 36 vs 26). The case of J2055+25, on the other hand, is highly sensitive to our definition of the off-peak phase interval. A reduction of the off-peak interval from 0.66 to 0.5 (i.e. a 25% reduction) reduced the from 99 to 52 (nearly 50%), which seems to suggest that we may be overestimating the “true” size of the off-peak interval. After obtaining the spectral parameters for each pulsar, we compute the corresponding photon and energy fluxes, and present the results in columns 2 and 3 of Table 4. It is interesting to note that the oldest pulsars tend to have the hardest spectra and lowest cutoff energies. Earlier studies in Abdo et al. (2009d) showed a weak trend of spectral index with , and a stronger trend is evident here, albeit with lower statistics.
3 The New -ray Pulsars
The new pulsars are drawn from similar populations as the first 16 pulsars discovered in blind searches. Five of the pulsars (J1023–5746, J1044–5737, J1413–6205, J1429–5911, and J1954+2836) are energetic ( erg s-1) and young ( kyr), with a large magnetic field at the light cylinder ( kG). The remaining three (J1846+0919, J1957+5033, J2055+25) have smaller 0.3–1 kG, are less energetic ( erg s-1) and have much larger characteristic ages ( kyr).
3.1 Source Associations
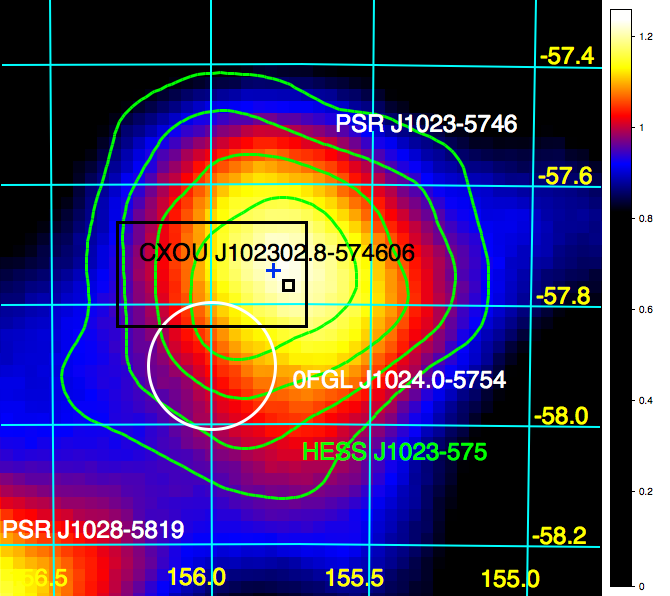
As shown in Table 1, five of the eight -ray pulsars are associated with sources found in the Fermi bright source list (Abdo et al., 2009f), while two of the pulsars were also reported as -ray sources by the AGILE team (Pittori et al., 2009). Only PSR J1413–6205 was clearly detected as a -ray source by EGRET (EGR J1414–6224 (Casandjian & Grenier, 2008)888Given the complicated nature of this region, it is safe to assume that at least part of the -ray emission from PSR J1413–6205 was captured as 3EG J1410–6147 (Hartman et al., 1999), even if PSR J1413–6205 falls slightly outside the EGRET 95% statistical error error circle.) although it is very likely that another one, PSR J1023–5746, was at least partly responsible for the EGRET source 3EG J1027–5817 (Abdo et al., 2009c). Three pulsars (PSRs J1023–5746, J1413–6205, and J1954+2836) may have even been detected as sources by the COS-B detector (2CG 284–00, 2CG 311–01, and 2CG 065+00 respectively (Swanenburg et al., 1981)), though it is difficult to establish a one-to-one correspondence between such sources and the pulsars, since the COS-B error radii are quite large () and source confusion becomes an issue. It appears, for example, that the COS-B source 2CG 284-00 was made up of various contributions which the LAT has now resolved into three separate -ray sources, including the pulsars PSR J1028–5819 and the newly-discovered PSR J1023–5746 (Abdo et al., 2009c). We should point out that the issue of source confusion is one faced by the LAT too, albeit at a different sensitivity level than EGRET. The problem is particularly severe in the Galactic plane, where there is a large component of diffuse emission. In the case of PSR J1023–5746, for example, this resulted in an initial LAT source location that was far removed () from the true position of the pulsar (see Figure 11), making the early detection of pulsations from this source all the more challenging.
3.2 Distance Estimates
In the absence of distance information from observations in other wavebands, for example radio dispersion measures or optical parallax determinations, it is still possible to discern a general idea of the distance to these blind search pulsars. The method hinges upon the observed correlation between intrinsic -ray luminosity above 100 MeV and pulsar spin-down energy loss rate , as depicted in Figure 6 of Abdo et al. (2009d). The luminosity trend is calibrated from the observed MeV fluxes using standard radio pulsar distance determination techniques and the presumption of a beam correction factor999The beam correction factor, , allows us to convert the observed flux into -ray luminosity, , using the formula =4, where D is the distance. for the -ray emission cone for all pulsars.
The correlation is benchmarked at erg s-1 in Figure 6 of Abdo et al. (2009d), where is in units of erg s-1. Note that for erg s-1 there is a break in the observed trend to a stronger dependence on (e.g. L (Abdo et al., 2009d). This is expected as pulsars cannot exceed 100% radiative efficiency. For the two pulsars that are below this transitional (PSR J1957+5033 and PSR J2055+25), the efficiencies will be overestimated and thus the pseudo-distances given in Table 4 may be overestimates.
There is considerable scatter (by factors of 3-10) of inferred pulsar -ray luminosities about this linear relationship, possibly due to the inaccuracy of the assumption. An earlier version of this correlation was calculated for the EGRET pulsar database (Thompson et al., 1999). Physical origins for such a relationship are discussed in Zhang & Harding (2000), having first been identified by Harding (1981).
For a blind search pulsar with unknown dispersion measure, we can use this correlation, along with our determination of from the measured spin-down parameters, to specify , and then invert it to obtain a measure of its distance. This is referred to as the -ray pulsar pseudo-distance , and incorporates the presumption of in the absence of refined estimates of the solid angle, which can be obtained using pulse profile information (Watters et al., 2009). In this way, one obtains
| (2) |
Here is the observed energy flux , as listed in Table 4, in units of erg cms-1. The significant scatter of inferred luminosities for radio-loud LAT pulsars about the correlation translates to uncertainties in pseudo-distances of the order of factors of 2–3. The resulting estimates for the new blind search pulsars are listed in Table 4, ranging from kpc for PSR J2055+2539 to kpc for the high PSR J1023–5746. The relatively large pseudo-distance for PSR J1023–5746 is naturally expected due to interplay between its more-or-less typical flux and its high . It is of considerable interest because of the possible association of this pulsar with the Westerlund 2 cluster, as discussed in Sections 4.2 and 4.3.
4 Multiwavelength Observations
4.1 Radio
These pulsars were all discovered in -ray searches and thus are -ray selected pulsars, but targeted radio observations are required to determine if they are also radio quiet, or could have been discovered in radio surveys independently. The population statistics of radio quiet vs. radio loud -ray pulsars have important implications for -ray emission models (e.g. Gonthier et al., 2004). The precise positions derived from the LAT timing of these pulsars allowed us to perform deep follow up radio observations to search for pulsations from each of the new pulsars. We used the NRAO 100-m Green Bank Telescope (GBT), the Arecibo 305-m radio telescope, and the Parkes 64-m radio telescope for these observations. The log of observations is shown in Table 5 and the instrument parameters used in the sensitivity calculations are shown in Table 6. All observations were taken in search mode and the data were reduced using standard pulsar analysis software, such as PRESTO (Ransom, 2001). We searched for pulsations for a range of values of dispersion measure (DM), from 0 to some maximum, given in Table 5.
To compute the minimum pulsar flux that could have been detected in these observations, we use the modified radiometer equation (e.g. Lorimer & Kramer, 2004):
| (3) |
where is the instrument-dependent factor due to digitization and other effects; is the threshold signal to noise for a pulsar to have been confidently detected; ; is the telescope gain; is the number of polarizations used (2 in all cases); is the integration time; is the observation bandwidth; is the pulsar period; and is the pulse width (for uniformity, we assume ).
We use a simple approximation of a telescope beam response to adjust the flux sensitivity in cases where the pointing direction was offset from the true direction to the pulsar. This factor is
| (4) |
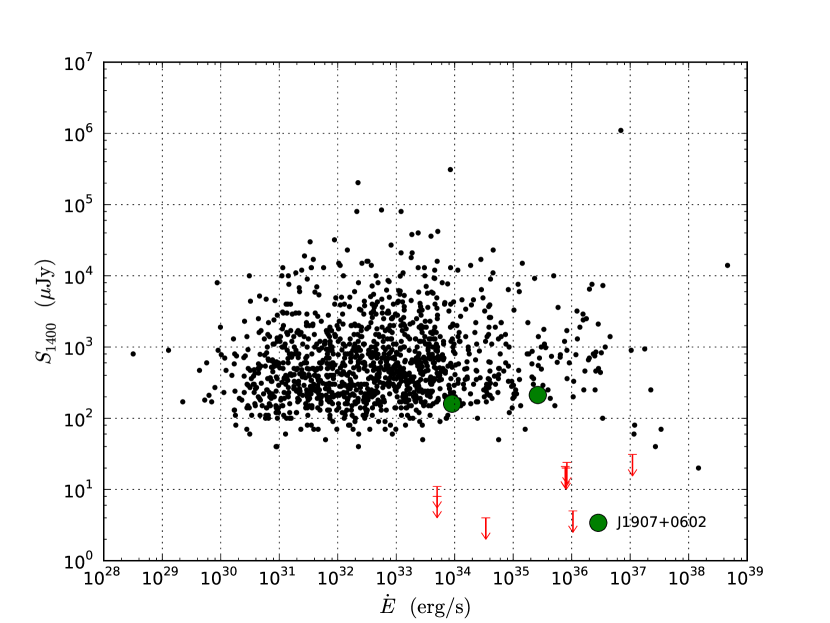
where is the offset from the beam center and HWHM is the beam half-width at half maximum. A computed flux limit of at the beam center is thus corrected to for target offset from the pointing direction. The resultant flux limits are compiled in Table 5. We compare these flux limits with the measured fluxes of the population of pulsars in the ATNF pulsar catalog (Manchester et al., 2005) in Figure 10. To make the fluxes comparable, we have scaled them all to the equivalent 1400 MHz flux density using a typical pulsar spectral index of 1.6. Using the scaled flux densities and the pseudo-distances given in Table 4, we can estimate the luminosity limits at 1.4 GHz. Seven out of the eight pulsars have luminosity limits below mJy kpc2. The remaining one, PSR J1023–5746, has a limit of mJy kpc2. Prior to the detection of radio pulsations from three LAT blind search pulsars (Camilo et al., 2009; Abdo et al., 2010b), the least luminous young radio pulsar known was PSR J0205+6449 in SNR 3C 58 with mJy kpc2 (Camilo et al., 2002). Two of the new radio LAT pulsars, however, have luminosities an order of magnitude below this level. Thus, while the radio limits we present here are quite stringent by comparison with the overall known population of young pulsars, they are still far above the now least luminous pulsars known, and it is entirely possible that some of the new pulsars could be radio emitters at a level below our limits. It should also be noted that some of these pulsars, and in particular PSRs J1846+0919, J1957+5033, and J2055+25 located at high Galactic latitudes (), may be very nearby and have very low values of DM. As was seen in the case of PSR J1741–2054 (Camilo et al., 2009), the received flux from such a nearby pulsar can vary greatly due to interstellar scintillation. The best way to detect such pulsars in radio might involve multiple low frequency observations. However, of the three pulsars mentioned, only PSR J2055+25 has at present been observed more than once (see Table 5).
The lack of even a single radio detection among these eight pulsars brings the total number of known radio quiet pulsars to 22 (including Geminga), out of a total of 46 known young -ray pulsars, or 50%. Such a high fraction may indicate that the size of the -ray beam is significantly larger than that of the radio beam, consistent with the predicitons of fan-beam outer-magnetosphere models for -rays and narrow polar-cap models for radio beams. However, more detailed population studies will be required to quantify this effect.
4.2 X-ray
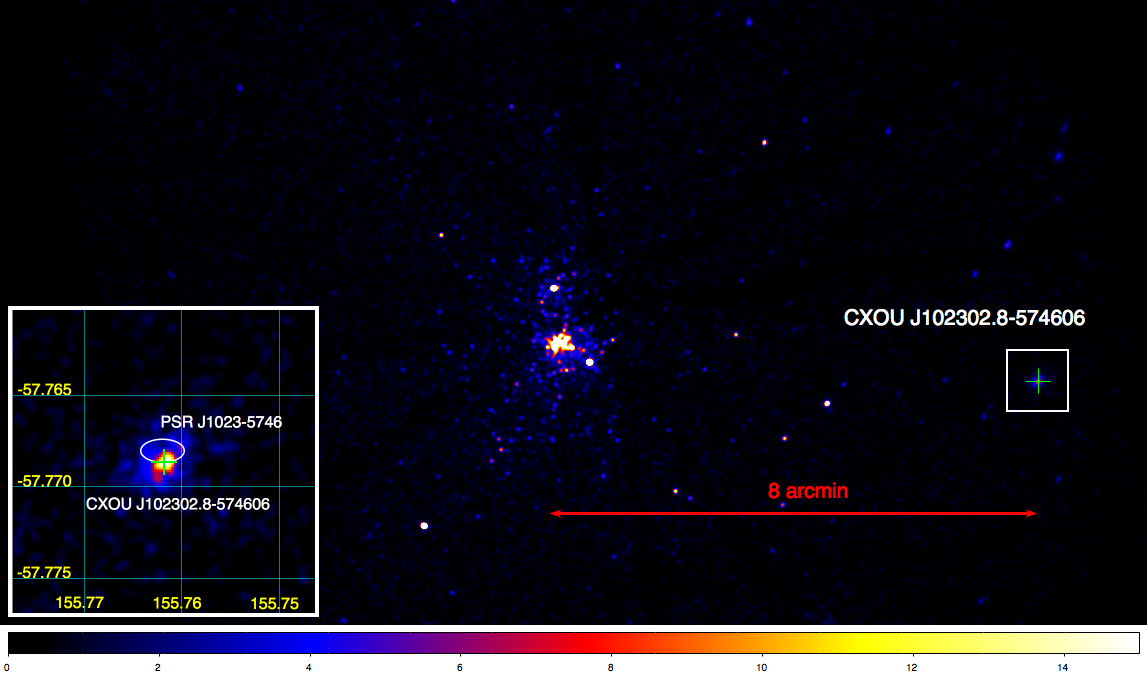
We searched archival X-ray observations for possible counterparts of the newly-discovered LAT pulsars, but found the pre-existing X-ray coverage of these fields to be extremely sparse. PSR J1023–5746 is the only pulsar with any significant X-ray observations, due to its proximity to the Westerlund 2 cluster. It was observed on three different occasions101010Obsids 3501, 6410, and 6411. (August 2003 and September 2006) by Chandra in the ACIS-S vfaint mode, with a total exposure of 130 ks. In a new analysis of the Chandra data, we found a faint source at = 10h 23m 028, = –57°46′0701 with a 95% error radius of 2″, consistent with our best timing position for the pulsar obtained from LAT data (see Figure 12). This source is one of 468 X-ray sources previously reported by Tsujimoto et al. (2007) in their survey of the massive star-forming region RCW 49. While Tsujimoto et al. (2007) identify it as CXOU J102302.84–574606.9, it is also referred to in the SIMBAD111111http://simbad.u-strasbg.fr/simbad/ astronomical database as CXOU J102302.8–574606, and we hereon after adopt this designation.
We find no optical source within 5″ (upper limit m 21) in the NOMAD optical catalog. CXOU J102302.8–574606 has a typical PWN-like power law spectrum with a photon index of 1.20.2 and an of (1.5 cm-2, resulting in an unabsorbed flux of 1.2 erg cm-2 s-1 (for a total of 600 counts). No other simple spectral model was statistically suitable. The off-axis PSF of the Chandra ACIS camera is a complicated function of energy, and given that this source is from the center of the field of view we cannot make any claims about the spatial extension of the counterpart. The NH value is comparable to the Galactic one ( cm-2) implying a fairly large distance (possibly greater than 10 kpc). The distance to the Westerlund 2 cluster has been a matter of debate, with estimates as low as 2.8 kpc (Ascenso et al., 2007), or as high as 8.0 1.4 kpc (Rauw et al., 2007). The most recent estimate, based on an analysis of the CO emission and 21 cm absorption along the line of sight to the cluster places it at a distance of 6.0 1.0 kpc (Dame, 2007). We note that the pseudo-distance that we have estimated for PSR J1023–5746 (given in Table 4) is 2.4 kpc. A rough estimate of the average transverse velocity of the pulsar from its birth site to its current location over its lifetime is given by km s-1, where is the angular separation between the pulsar and its birth site, in units of 8 arcminutes, is the distance to the pulsar, in units of 2.4 kpc, and is the age of the pulsar, in units of 4.6 kyr. This would be among the highest transverse velocities measured for any pulsar (e.g. Hobbs et al., 2004). Accordingly, the association seems improbable unless a) the pulsar was born far from the cluster core (e.g. from a runaway progenitor), b) the cluster and pulsar distance are lower than our pseudo-distance estimate of 2.4 kpc, or c) the true pulsar age is substantially greater than its characteristic age. An on-axis Chandra observation might be able to resolve the expected bow shock structure of the apparent PWN and test this association.
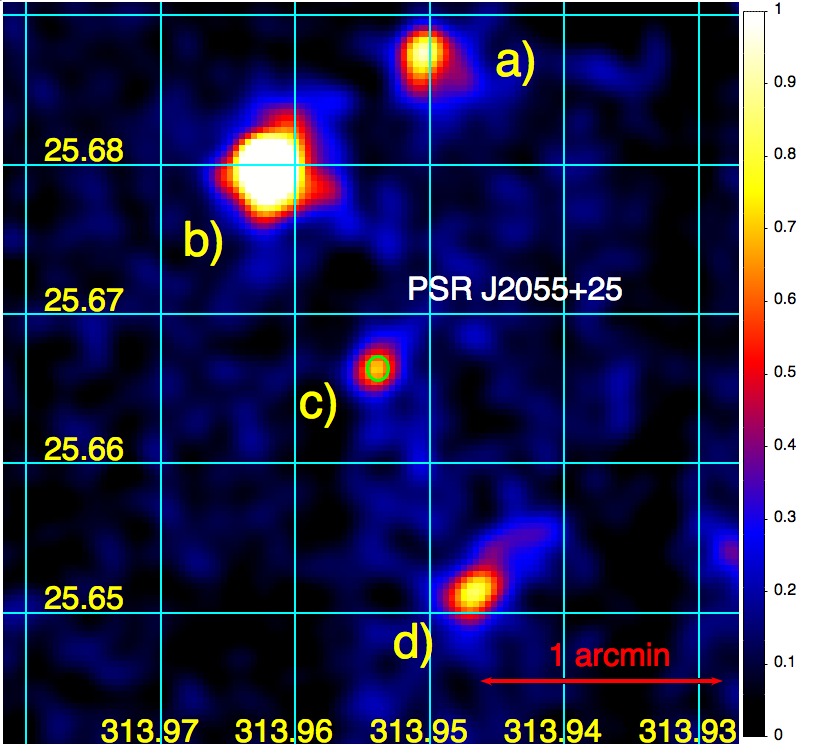
Shortly after identifying these 8 LAT sources as pulsars, we obtained short (5 ksec) Swift-XRT observations in PC-mode of 5 of them (J1044–5737, J1413–6205, J1846+0919, J1957+5033, and J2055+25). In the first four cases, no likely X-ray counterparts were found within the LAT error circle. In the case of J2055+25, a 6.3 ks observation revealed two sources relatively close to the pulsar location (1′ away), but inconsistent with the current best position derived from the timing and likely associated with bright field stars (sources b) and d) in Figure 13). The upper limit on the flux for a putative X-ray counterpart in any of these five Swift XRT observations is 1.5–2 erg cm-2 s-1, under the hypothesis of a power law spectrum with a photon index of 2 and of 1021 cm-2. Neither PSR J1429–5911 nor PSR J1954+2836 have significant X-ray coverage.
On October 26, 2009 the XMM-Newton satellite observed the field of PSR J2055+25 using the three European Photon Imaging Cameras (EPIC) MOS1, MOS2, and pn instruments. For MOS1 and pn cameras thin filters were used while for MOS2 the medium filter was used. All three instruments obtained data in Full Frame mode which resulted in a time resolution of 2.6 s for the MOS1, MOS2 cameras and 73.4 ms for the pn camera. The data from each instrument were analyzed utilizing the XMM-Newton Science Analysis System software (SAS) version 9.0.0. The calibration data utilized by SAS was the latest available at the time of data reduction. We filtered the event data for bad events, retaining only those events from the MOS cameras with predefined patterns 0-12, and also excluded times of high background.
In Figure 13 we show the combined image from the MOS1, MOS2, and pn cameras on XMM, resulting from an effective exposure of 19.0 ks after filtering. XMMU J205550.8+254048 and XMMU J205547.2+253906 (the “tadpole”) are apparent in the Swift XRT image but owing to the higher effective area of XMM a number of fainter sources were also detected in the image including a faint source virtually coincident with the pulsar position: XMMU J205549.4+253959. The region is crowded so in order to minimize contamination from other X-ray sources we form a spectrum by extracting events in a 29 arcsec circular region around the X-ray position centroid and also extract a background spectrum from a region that appears to be free of X-ray sources on the same CCD. For a circular region 29 arcsec in radius around a point source the MOS1 PSF encircles roughly 85% of the photons at 1.5 keV. We can extract 97 photons from the source region and thus can form only an approximate spectrum for XMMU J205549.4+253959. Fitting an absorbed power law to this spectrum we obtain an approximate flux of ergs cm-2 s-1 in the 0.5–10 keV energy band with a power law index of .
4.3 TeV
Four of the eight new pulsars are in the Northern Hemisphere and four are in the Southern Hemisphere. Only the Milagro TeV observatory, an all-sky survey instrument, has observed the four northern hemisphere pulsars. Milagro has reported a 4.3 excess from the location of PSR J1954+2836, with a measured flux at 35 TeV of 37.1 TeV-1 s-1 cm-2 (Abdo et al., 2009g). The remaining three pulsars in the Milagro field of view show no sign of TeV emission, though this is perhaps not surprising given that they have spin-down luminosities that are 30–200 times lower than PSR J1954+2836.
Of the Southern Hemisphere pulsars, three have no reported TeV observations. The remaining one, PSR J1023–5746 is coincident with the TeV source HESS J1023–575 (see Figure 11). The HESS collaboration reported the detection of TeV emission from a source with an extension of in the vicinity of the young stellar cluster Westerlund 2 (Aharonian et al., 2007). Three possible scenarios for the TeV emission were presented by the HESS team: the massive WR binary system WR 20a, the young stellar cluster Westerlund 2, and cosmic rays accelerated in bubbles or at their termination shock and interacting with their environment (Aharonian et al., 2007). The estimated luminosity above 380 GeV (for an assumed distance of 8 kpc) is 1.5 erg s-1 or less than 1.5% of the spin-down luminosity of this pulsar, making the energetics of such an association plausible (e.g. Camilo et al., 2009). Recently, a jet and arc of molecular gas toward this source has been reported which suggests the possible occurrence of an anisotropic supernova explosion (Fukui et al., 2009). The discovery of the very young and energetic pulsar PSR J1023–5746 suggests that it likely plays an important role in the TeV emission from HESS J1023–575. Given the long list of known TeV PWNe (currently the most numerous class of TeV sources121212http://tevcat.uchicago.edu/) and the significant number of these associated with bright -ray pulsars, such a scenario seems at least plausible, if not probable.
5 Conclusion
The first five months of LAT data led to the discovery of the first 16 pulsars found from blind searches of -ray data (Abdo et al., 2009b). Here we report the discovery of an additional eight -ray selected pulsars by performing blind frequency searches on 11 months of Fermi-LAT data. These new pulsars are largely drawn from the same population as the previous 16 (see Figure 1). Deep radio follow-up observations of these newly-discovered pulsars suggest that they are all either radio-quiet, or extremely radio faint.
While the less energetic -ray selected pulsars are found at high Galactic latitudes (b ), pointing to a nearby Geminga-like population, the remaining ones, characterized by a higher , are well aligned with the Galactic plane. Thus, the newly found pulsars represent well the two types of non-millisecond pulsars the LAT is unveiling: low , nearby ones at high latitude, and high , far away ones near the Galactic plane. Fainter, less energetic pulsars in the Galactic plane would be difficult to disentagle from the diffuse emission.
Among the low latitude -ray pulsars, we find PSR J1023–5746, a neutron star with a remarkably large rotational energy loss rate of erg s-1, the largest so far of all -ray pulsars found in blind searches (Abdo et al., 2009b), and higher than 90% of the entire -ray pulsar population (Abdo et al., 2009d). The number of such energetic gamma-ray pulsars along the Galactic plane, however, could in fact be much higher. The very narrow distribution in Galactic latitude of the unassociated LAT sources (Abdo et al., 2010a) implies that many of them could be located at distances of several kpc, and have luminosities in excess of 1035 erg s-1. Using an average value of the conversion efficiency measured for the young -ray pulsars detected so far (Abdo et al., 2009d), objects such as PSR J1023–5746 could account for many of the bright sources seen at low Galactic latitudes and so far unidentified.
References
- Abdo et al. (2009a) Abdo, A. A., et al. 2009a, Science, 325, 848
- Abdo et al. (2009b) —. 2009b, Science, 325, 840
- Abdo et al. (2009c) —. 2009c, ApJ, 695, L72
- Abdo et al. (2009d) —. 2009d, ApJ, submitted – Fermi LAT Pulsar Catalog
- Abdo et al. (2009e) —. 2009e, ApJ, accepted – PSR J1836+5925
- Abdo et al. (2009f) —. 2009f, ApJS, 183, 46
- Abdo et al. (2009g) —. 2009g, ApJ, 700, L127
- Abdo et al. (2009h) —. 2009h, ApJ, 700, 1059
- Abdo et al. (2009i) —. 2009i, Astroparticle Physics, 32, 193
- Abdo et al. (2010a) —. 2010a, ApJS, submitted – Fermi LAT First Source Catalog
- Abdo et al. (2010b) —. 2010b, ApJ, 711, 64
- Aharonian et al. (2007) Aharonian, F., et al. 2007, A&A, 467, 1075
- Ascenso et al. (2007) Ascenso, J., Alves, J., Beletsky, Y., & Lago, M. T. V. T. 2007, A&A, 466, 137
- Atwood et al. (2006) Atwood, W. B., Ziegler, M., Johnson, R. P., & Baughman, B. M. 2006, ApJ, 652, L49
- Atwood et al. (2009) Atwood, W. B., et al. 2009, ApJ, 697, 1071
- Camilo et al. (2002) Camilo, F., et al. 2002, ApJ, 571, L41
- Camilo et al. (2009) —. 2009, ApJ, 705, 1
- Casandjian & Grenier (2008) Casandjian, J.-M., & Grenier, I. A. 2008, A&A, 489, 849
- Chandler et al. (2001) Chandler, A. M., Koh, D. T., Lamb, R. C., Macomb, D. J., Mattox, J. R., Prince, T. A., & Ray, P. S. 2001, ApJ, 556, 59
- Dame (2007) Dame, T. M. 2007, ApJ, 665, L163
- Dodson et al. (2002) Dodson, R. G., McCulloch, P. M., & Lewis, D. R. 2002, ApJ, 564, L85
- Fukui et al. (2009) Fukui, Y., et al. 2009, PASJ, 61, L23
- Gonthier et al. (2004) Gonthier, P. L., Van Guilder, R., & Harding, A. K. 2004, ApJ, 604, 775
- Harding (1981) Harding, A. K. 1981, ApJ, 245, 267
- Hartman et al. (1999) Hartman, R. C., et al. 1999, ApJS, 123, 79
- Haslam et al. (1981) Haslam, C. G. T., Klein, U., Salter, C. J., Stoffel, H., Wilson, W. E., Cleary, M. N., Cooke, D. J., & Thomasson, P. 1981, A&A, 100, 209
- Hobbs et al. (2004) Hobbs, G., Lyne, A. G., Kramer, M., Martin, C. E., & Jordan, C. 2004, MNRAS, 353, 1311
- Hobbs et al. (2006) Hobbs, G. B., Edwards, R. T., & Manchester, R. N. 2006, MNRAS, 369, 655
- Lorimer & Kramer (2004) Lorimer, D. R., & Kramer, M. 2004, Handbook of Pulsar Astronomy, ed. Lorimer, D. R. & Kramer, M.
- Manchester et al. (2005) Manchester, R. N., Hobbs, G. B., Teoh, A., & Hobbs, M. 2005, AJ, 129, 1993
- Pittori et al. (2009) Pittori, C., et al. 2009, A&A, 506, 1563
- Ransom (2001) Ransom, S. M. 2001, Harvard University, 93, 216
- Rauw et al. (2007) Rauw, G., Manfroid, J., Gosset, E., Nazé, Y., Sana, H., De Becker, M., Foellmi, C., & Moffat, A. F. J. 2007, A&A, 463, 981
- Ray et al. (2010) Ray, P. S., et al. 2010, ApJ, – in preparation
- Saz Parkinson (2009) Saz Parkinson, P. M. 2009, in American Institute of Physics Conference Series, Vol. 1112, American Institute of Physics Conference Series, ed. D. Bastieri & R. Rando, 79
- Swanenburg et al. (1981) Swanenburg, B. N., et al. 1981, ApJ, 243, L69
- Thompson (2008) Thompson, D. J. 2008, Reports on Progress in Physics, 71, 116901
- Thompson et al. (1999) Thompson, D. J., et al. 1999, ApJ, 516, 297
- Tsujimoto et al. (2007) Tsujimoto, M., et al. 2007, ApJ, 665, 719
- Watters et al. (2009) Watters, K. P., Romani, R. W., Weltevrede, P., & Johnston, S. 2009, ApJ, 695, 1289
- Zhang & Harding (2000) Zhang, B., & Harding, A. K. 2000, ApJ, 532, 1150
| PSR | Source AssociationbbSources are from the Fermi LAT First Source Catalog (1FGL, Abdo et al., 2010a), the Fermi LAT Bright Source List (0FGL, Abdo et al., 2009f), EGRET (EGR, Casandjian & Grenier, 2008), and AGILE (1AGL, Pittori et al., 2009). We also list a TeV association (HESS) and X-ray counterparts identified with Chandra (CXOU) and XMM (XMMU). | R.A.ccRight Ascension (R.A.) and Declination (Dec.) obtained from the timing model. The errors quoted are statistical (2.45 times the tempo2 uncertainties). They do not account for covariance between model parameters or systematic errors caused by timing noise, which can amount to several arcseconds, and should be considered when looking for counterparts. | Dec.ccRight Ascension (R.A.) and Declination (Dec.) obtained from the timing model. The errors quoted are statistical (2.45 times the tempo2 uncertainties). They do not account for covariance between model parameters or systematic errors caused by timing noise, which can amount to several arcseconds, and should be considered when looking for counterparts. | ddGalactic longitude () and latitude (), rounded to the nearest decimal. | ddGalactic longitude () and latitude (), rounded to the nearest decimal. |
|---|---|---|---|---|---|
| hh:mm:ss.s | dd:mm:ss.s | (∘) | (∘) | ||
| J1023–5746 | 1FGL J1023.0–5746 | 10:23:02.9(5) | –57:46:05(2) | 284.2 | –0.4 |
| 0FGL J1024.0–5754 | |||||
| HESS J1023–575 | |||||
| CXOU J102302.8–574606 | |||||
| J1044–5737 | 1FGL J1044.5–5737 | 10:44:32.8(1) | –57:37:19.3(8) | 286.6 | 1.2 |
| 1AGL J1043–5749 | |||||
| J1413–6205 | 1FGL J1413.4–6205 | 14:13:29.9(1) | –62:05:38(1) | 312.4 | –0.7 |
| 0FGL J1413.1–6203 | |||||
| 1AGL J1412–6149 | |||||
| EGR J1414–6224 | |||||
| J1429–5911 | 1FGL J1429.9–5911 | 14:29:58.6(1) | –59:11:36.6(7) | 315.3 | 1.3 |
| 0FGL J1430.5–5918 | |||||
| J1846+0919 | 1FGL J1846.4+0919 | 18:46:26.0(6) | +09:19:46(11) | 40.7 | 5.3 |
| J1954+2836 | 1FGL J1954.3+2836 | 19:54:19.15(4) | +28:36:06(1) | 65.2 | 0.4 |
| 0FGL J1954.4+2838 | |||||
| J1957+5033 | 1FGL J1957.6+5033 | 19:57:38.9(8) | +50:33:18(9) | 84.6 | 11.0 |
| J2055+25aaThe current position uncertainty only allows for two decimal places in declination. | 1FGL 2055.8+2539 | 20:55:48.8(2) | +25:40:02(3) | 70.7 | –12.5 |
| 0FGL J2055.5+2540 | |||||
| XMMU J205549.4+253959 |
| PSR | rms | ||||||||
|---|---|---|---|---|---|---|---|---|---|
| (Hz) | ( Hz s-1) | (ms) | (kyr) | ( erg s-1) | ( G) | (kG) | |||
| J1023–5746 | 4365 | 8.970827684(7) | 30.8825(1)† | 550/56 | 1.0 | 4.6 | 1095.5 | 6.6 | 44.0 |
| J1044–5737 | 2362 | 7.192749594(2) | 2.8262(2) | 395/21 | 0.8 | 40.3 | 80.3 | 2.8 | 9.5 |
| J1413–6205‡ | 5716 | 9.112389504(2) | 2.2984(3) | 361/19 | 0.5 | 62.9 | 82.7 | 1.8 | 12.3 |
| J1429–5911 | 2750 | 8.632402182(2) | 2.2728(2) | 395/21 | 0.8 | 60.2 | 77.5 | 1.9 | 11.3 |
| J1846+0919 | 1042 | 4.433578172(4) | 0.1951(5) | 412/18 | 12.4 | 360.2 | 3.4 | 1.5 | 1.2 |
| J1954+2836 | 2953 | 10.78643292(3) | 2.4622(4) | 383/22 | 0.9 | 69.5 | 104.8 | 1.4 | 16.4 |
| J1957+5033 | 449 | 2.668045340(2) | 0.0504(3) | 415/20 | 10.6 | 837.7 | 0.5 | 1.6 | 0.3 |
| J2055+25 | 715 | 3.12929129(1) | 0.040(1) | 503/56 | 8.2 | 1226.9 | 0.5 | 1.2 | 0.3 |
Note. — The reference epoch for the timing solutions is MJD 54800, except for PSR J1023–5746 (MJD 54856) and PSR J2055+25 (MJD 54900). ‡All timing solutions are valid for the period MJD 54682–55016, except for that of PSR J1413–6205, which is only valid in the range MJD 54743–55016, due to a glitch which occurred around MJD 54718. Column 1 gives the pulsar name. Column 2 lists the number of photons obtained with the standard cuts used (diffuse class, 300 MeV, R ) over the 11 month observational period. Columns 3 and 4 list the frequency and frequency derivative.†PSR J1023–5746 requires second and third order frequency derivatives to model the timing noise: Hz s-2 and Hz s-3. Column 5 gives the span of days of data used to generate the timing model and the number of TOAs that were generated from such data. Column 6 gives the rms timing residual of the model. Columns 7 and 8 give the characteristic age and spin-down luminosity. Columns 9 and 10 give the magnetic field strength at the neutron star surface and at the light cylinder. The derived quantities in columns 7–10 are are obtained from the timing parameters of the pulsars and are rounded to the nearest significant digit.
| PSR | Peak | -ray peak separation | Reference phase | off-peak definition | ROI |
|---|---|---|---|---|---|
| multiplicity | (∘ ) | ||||
| J1023–5746 | 2 | 0.66 | 0.75–1.16 | 0.8 | |
| J1044–5737 | 2 | 0.62 | 0.66–1.16 | 0.8 | |
| J1413–6205 | 2 | 0.85 | 0.69–1.09 | 0.8 | |
| J1429–5911 | 2 | 0.86 | 0.84–1.13 | 0.8 | |
| J1846+0919 | 1 | 0.36 | 0.50–1.09 | 0.8 | |
| J1954+2836 | 2 | 0.68 | 0.84–1.16 | 0.9 | |
| J1957+5033 | 1 | 0.77 | 0.53–1.13 | 0.8 | |
| J2055+25 | 1 | 0.83 | 0.50–1.16 | 0.8 |
Note. — Light curve shape parameters of each pulsar, including the peak multiplicity, the phase separation between the two -ray peaks, the value of the phase at the reference epoch, barycentric MJD 54800 (UTC), and the off-peak region used in the spectral analyses. Column 6 lists the Region of Interest used to make the light curves, where we have selected only diffuse class events.
| PSR | Photon Flux () | Energy Flux () | |||||
|---|---|---|---|---|---|---|---|
| () | () | () | (kpc) | ||||
| J1023–5746 | 41.5 0.5 | 26.9 1.8 | 1.58 0.13 | 1.8 0.3 | 686 | 88 | 2.4 |
| J1044–5737 | 14.3 1.7 | 10.3 0.65 | 1.60 0.12 | 2.5 0.5 | 799 | 69.7 | 1.5 |
| J1413–6205 | 12.9 2.2 | 12.9 1.0 | 1.32 0.16 | 2.6 0.6 | 461 | 64.9 | 1.4 |
| J1429–5911 | 16.2 2.4 | 9.26 0.81 | 1.93 0.14 | 3.3 1.0 | 318 | 20.8 | 1.6 |
| J1846+0919 | 4.1 0.77 | 3.58 0.35 | 1.60 0.19 | 4.1 1.5 | 363 | 19.8 | 1.2 |
| J1954+2836 | 11.9 1.6 | 9.75 0.68 | 1.55 0.14 | 2.9 0.7 | 595 | 54.3 | 1.7 |
| J1957+5033 | 3.3 0.52 | 2.27 0.20 | 1.12 0.28 | 0.9 0.2 | 395 | 39.3 | 0.9 |
| J2055+25 | 11.1 1.1 | 11.5 0.70 | 0.71 0.19 | 1.0 0.2 | 779 | 127 | 0.4 |
Note. — Results of the unbinned maximum likelihood spectral fits for the new -ray pulsars (see Section 2.3). Columns 2 and 3 list the on-peak (defined as the complement of the off-peak region defined in column 5 of Table 3) photon flux and on-peak energy flux respectively. The fits used an exponentially cutoff power law model (see Equation 1) with photon index and cutoff energy given in columns 4 and 5. The systematic uncertainties on , , and due to uncertainties in the Galactic diffuse emission model have been added in quadrature with the statistical errors. Uncertainties in the instrument response induce additional biases of , , , and . The test statistic () for the source significance is provided in column 6. The significance of an exponential cutoff (as compared to a simple power law) is indicated by in column 7, where a value indicates that the exponentially cutoff model is significantly preferred in every case. Column 8 gives a pseudo-distance estimate, , calculated using equation (2), described in Section 3.2.
| Target | Obs Code | Date | DM maxaaMaximum value of dispersion measure (DM) searched. | R.A.bbTelescope pointing direction (not necessarily source position). | Decl.bbTelescope pointing direction (not necessarily source position). | OffsetccOffset between telescope pointing direction and pulsar position. | ddSky temperature estimated by scaling 408 MHz (Haslam et al., 1981) all sky map to observing frequency using spectral index of . | eeFlux limits are at the observing frequency, not scaled to an equivalent 1.4 GHz flux. | |
|---|---|---|---|---|---|---|---|---|---|
| (s) | (pc cm | (J2000) | (J2000) | (arcmin) | (K) | (Jy) | |||
| J1023–5746 | Parkes-AFB | 2009 Apr 14 | 16200 | 2000 | 10:23:10.6 | –57:44:20 | 2.0 | 6.0 | 31 |
| Parkes-10cm | 2009 Nov 26 | 11500 | 1000 | 10:23:02.3 | –57:46:09 | 0.1 | 0.9 | 22 | |
| J1044–5737 | Parkes-BPSR | 2009 Aug 02 | 16200 | 2000 | 10:44:33.3 | –57:37:15 | 0.1 | 4.2 | 21 |
| J1413–6205 | Parkes-BPSR | 2009 Aug 02 | 16200 | 2000 | 14:13:14.2 | –62:04:34 | 2.1 | 8.1 | 25 |
| J1429–5911 | Parkes-BPSR | 2009 Aug 03 | 16200 | 2000 | 14:30:02.2 | –59:11:20 | 0.5 | 6.5 | 22 |
| J1846+0919 | AO-Lwide | 2009 Aug 07 | 3600 | 2000 | 18:46:26.8 | +09:19:42 | 0.2 | 3.8 | 4 |
| J1954+2836 | AO-Lwide | 2009 Aug 04 | 1200 | 1310 | 19:54:18.9 | +28:36:10 | 0.1 | 3.2 | 7 |
| AO-Lwide | 2009 Oct 14 | 2700 | 1310 | 19:54:19.2 | +28:36:06 | 0.0 | 3.2 | 4 | |
| J1957+5033 | GBT-820 | 2009 Sep 21 | 4900 | 1100 | 19:57:32.3 | +50:36:33 | 3.4 | 6.9 | 25 |
| J2055+25 | AO-327 | 2009 May 15 | 1800 | 2500 | 20:55:34.8 | +25:40:23 | 3.2 | 62.2 | 85 |
| AO-Lwide | 2009 May 15 | 1800 | 2500 | 20:55:34.8 | +25:40:23 | 3.2 | 1.4 | 106 |
| Obs Code | Telescope | Gain | Freq | bbInstrument-dependent sensitivity degradation factor. | HWHM | |||
|---|---|---|---|---|---|---|---|---|
| (K/Jy) | (MHz) | (MHz) | (arcmin) | (K) | ||||
| GBT-820 | GBT | 2.0 | 820 | 200 | 1.05 | 2 | 7.9 | 29 |
| AO-327 | Arecibo | 11 | 327 | 50 | 1.12 | 2 | 6.3 | 116 |
| AO-Lwide | Arecibo | 10 | 1510 | 300 | 1.12 | 2 | 1.5 | 27 |
| Parkes-AFB | Parkes | 0.735 | 1374 | 288 | 1.25 | 2 | 7.0 | 25 |
| Parkes-BPSR | Parkes | 0.735 | 1352 | 340 | 1.05 | 2 | 7.0 | 25 |
| Parkes-10cm | Parkes | 0.67 | 3078 | 864 | 1.25 | 2 | 3.3 | 30 |