The ACS LCID project IV: detection of the RGB
bump
in isolated galaxies of the Local Group11affiliation: Based on observations made with the NASA/ESA Hubble Space
Telescope, obtained at the Space Telescope Science Institute, which is
operated by the Association of Universities for Research in Astronomy,
Inc., under NASA contract NAS5-26555. These observations are associated
with program 10505.
Abstract
We report the detection and analysis of the red giant branch luminosity function bump in a sample of isolated dwarf galaxies in the Local Group. We have designed a new analysis approach comparing the observed color-magnitude diagrams with theoretical best-fit color-magnitude diagrams derived from precise estimates of the star formation histories of each galaxy. This analysis is based on studying the difference between the V-magnitude of the RGB bump and the horizontal branch at the level of the RR Lyrae instability strip () and we discuss here a technique for reliably measuring this quantity in complex stellar systems. By using this approach, we find that the difference between the observed and predicted values of is mag. This is smaller, by about a factor of two, than the well-known discrepancy between theory and observation at low metallicity commonly derived for Galactic globular clusters. This result is confirmed by a comparison between the adopted theoretical framework and empirical estimates of the parameter for both a large database of Galactic globular clusters and for four other dSph galaxies for which this estimate is available in the literature. We also investigate the strength of the red giant branch bump feature (), and find very good agreement between the observed and theoretically predicted values. This agreement supports the reliability of the evolutionary lifetimes predicted by theoretical models of the evolution of low-mass stars.
keywords:
Local Group — galaxies: individual (Cetus dSph, Tucana dSph, IC1613 dIrr, Leo A dIrr, LGS 3 dIrr/dSph) — galaxies: stellar content — stars: general — stars: evolution1 Introduction
In low-mass stars, the evolution of the H-burning shell along the Red Giant Branch (RGB) involves an extremely small mass (0.001 or less near the RGB Tip). Therefore, its crossing of any discontinuity in the H-abundance profile causes a change in the H-burning efficiency and, in turn, a sudden change in the stellar surface luminosity. During the RGB evolution, the H-burning shell crosses the chemical discontinuity left by the convective envelope after the first dredge-up. When the shell encounters this discontinuity, the matter in the shell expands and cools slightly, causing a sharp drop in the stellar surface luminosity. When thermal equilibrium is restored, the stellar luminosity starts to monotonically increase up to the RGB Tip. As a consequence, the star crosses three times a narrow luminosity interval. This produces the characteristic bump in the theoretical luminosity function (LF).
Since its detection in 47 Tucanae (King et al., 1985), the RGB bump has become the crossroad of several theoretical and observational investigations (Fusi Pecci et al., 1990; Ferraro et al., 1990; Cassisi & Salaris, 1997; Alves & Sarajedini, 1999; Zoccali et al., 1999; Bono et al., 2001; Riello et al., 2003; Di Cecco et al., 2010). In order to detect the bump, a large sample of RGB stars is required – stars in the upper four magnitudes of the RGB according to Fusi Pecci et al. (1990) – and until a few years ago it was detected only in metal-rich globular clusters (GC). In fact, with increasing cluster metallicity, the luminosity extension of the bump is larger and the bump is also shifted to lower luminosity, where the RGB is more densely populated; both effects work in the direction of making the bump detection easier. However, in the last decade, the RGB bump has been detected in metal-poor GCs, due to the HST capability of imaging the dense GC cores and the availability of wide field-of-view CCD detectors on ground-based telescopes (Riello et al. 2003, see also Di Cecco et al. 2010).
The parameter widely adopted to study the RGB bump brightness is the (), that is, the V-magnitude difference between the RGB bump and the horizontal branch (HB) at the RR Lyrae instability strip level (Fusi Pecci et al., 1990; Cassisi & Salaris, 1997). From an observational point of view, this has the advantage of being independent of distance and reddening, but it requires that the instability strip is well populated (Ferraro et al., 1999). From a theoretical point of view, depends not only on the bump level predicted by models, but also on the HB luminosity set by the value of the He core mass at the He-flash. For a detailed discussion of the model uncertainties and the impact on the RGB bump properties see Cassisi & Salaris (1997), Salaris et al. (2002) and Bjork & Chaboyer (2006).
The first exhaustive comparison between theory and observations of in Galactic GCs was performed by Fusi Pecci et al. (1990). Using the theoretical models available at that time, they found that the observed dependence of on cluster metallicity was in good agreement with theoretical predictions, but theoretical values were smaller than the observed ones by mag. For a long time, this result has been considered a clear drawback of canonical theoretical models of low-mass RGB stars. Therefore, it was suggested by Alongi et al. (1991) that this discrepancy could be removed by accounting for the efficiency of overshooting from the base of the formal boundary of the convective envelope, which shifts the bump level to a lower brightness because of the resulting deeper convective envelope.
Cassisi & Salaris (1997) reanalyzed the problem using their updated canonical stellar models applied to a sample of 8 clusters with spectroscopic determinations of [Fe/H] and [/Fe], accounting for the effect of the -element overabundance. They concluded that their models provided a good match to the available observational data. Zoccali et al. (1999) and Ferraro et al. (1999) have produced larger observational databases and compared these empirical data with suitable stellar models. From this comparison, one can draw the conclusion that lingering uncertainties on the HB theoretical brightness and the GC metallicity scale still leave open the possibility that a discrepancy at the level of 0.20 mag between theory and observations may exist. The recent analysis made by Di Cecco et al. (2010) with up-to-date theoretical models seems to support this. For a detailed discussion about the differences between the stellar models adopted by Cassisi & Salaris (1997) and the most recent theoretical framework, see Di Cecco et al. (2010).
All the empirical evidence quoted above refers to RGB bump detections in Galactic GCs. However, there is a growing number of detections of—single and double—RGB bumps in dwarf spheroidal (dSph) satellites of the Milky Way (Sculptor: Majewski et al. 1999; Sextans: Bellazzini et al. 2001; Sagittarius: Monaco et al. 2002; Ursa Minor: Bellazzini et al. 2002; Leo II: Bellazzini et al. 2005) while the first detection in an isolated Local Group (LG) galaxy was presented for DDO210 by McConnachie et al. (2006).
It is now well known that dSph galaxies are not simple stellar populations, but rather they are a mix of populations, with different ages and chemical properties. Therefore, it is clear that dSph galaxies are not the best target - when compared with ‘simple’ Galactic GCs - in order to check the capability of the evolutionary framework to reproduce the RGB bump brightness. This notwithstanding, the RGB bump detections in dSph galaxies have been used for constraining properties (e.g., possible differences in age and/or metallicity) of the various stellar populations present in the corresponding stellar systems (see references above).
In the present work, we present a different approach for the analysis of the RGB bump, in particular for dwarf galaxies. Recently, we have carried out a project with the aim of studying a sample of isolated LG dwarf galaxies. A summary of the goals and results of the LCID project (Local Cosmology from Isolated Dwarfs 777http://www.iac.es/project/LCID) can be found in C. Gallart et al. (in prep.). Here it is worth recalling that the main aim of the LCID project was to derive precise star formation histories (SFHs) over the lifetime of the selected objects, in order to obtain a detailed description of their evolution and to analyze their properties in a cosmological context. This was possible due to the observational capabilities of the ACS camera aboard the Hubble Space Telescope for the Local Group galaxies Cetus, Tucana, Leo A, IC 1613, and LGS 3888The Phoenix dwarf is the sixth galaxy in the LCID project, but was observed with the WFPC2, and the WFPC2 data did not allow a robust detection of the RGB bump. Therefore, this galaxy is not included in the present analysis.. The ACS observations allowed us to obtain color-magnitude diagrams (CMDs) of unprecedented depth and quality for these objects. The analysis of these CMDs allowed us to detect the RGB bump(s) in all five galaxies observed with the ACS.
Preliminary results on this issue have been presented for the Cetus dSph by Monelli et al. (2010a). In the present paper, we extend the analysis and present our approach to compare the observed and theoretical values of . The essence of our method is to take advantage of the derived SFHs, which provide a reliable description of the ages, chemical properties, and counts of the stars in both the RGB and the HB stages. The SFHs are used to calculate a synthetic CMD, which is then compared with the observed CMD.
The outline of this paper is as follows: in the next section we discuss the method and provide the relevant data about both the observational and the theoretical framework; in §3 we compare theoretical predictions based on the retrieved SFHs with the observational measurements. We close with some discussion and final remarks.
2 Data reduction and analysis: the parameter estimate

We present the analysis of the RGB bump for five of the LCID galaxies: Cetus, Tucana, LGS 3, IC1613, and Leo A. An in-depth discussion of the data reduction and photometry can be found in Monelli et al. (2010a). We note that the photometry was obtained using both the DAOPHOT/ALLFRAME (Stetson, 1994) and DOLPHOT (Dolphin, 2000) packages. Monelli et al. (2010a) discuss the small zero points detected between the two photometry sets. However, note that the results of this paper, based on the magnitude difference of the RGB bump and the HB, are not affected by such small offsets. The CMDs and SFHs of the five galaxies are being presented in a series of papers (Cetus: Monelli et al. 2010a; Tucana: M. Monelli et al., in prep.; IC1613: E. Skillman et al., in prep.; LGS 3: Hidalgo et al. 2010; Leo A: Cole et al. 2007). The variable stars, and in particular the RR Lyrae used in this work, have been presented in Bernard et al. (2009a, Cetus and Tucana), Bernard et al. (2010, IC 1613), and Bernard (2009b, LGS 3, Leo A).
Since galaxies are complex stellar systems with mixtures of stellar populations of different ages and metallicities, we devised a new approach to compare the theoretical and the observed . In particular, we take advantage of the detailed knowledge of the SFHs of the sample galaxies to build a best-fit model, or best fit CMD999The best fit CMD was built using the IAC-star code Aparicio & Gallart (2004), available at the web page http://iac-star.iac.es, which was used to estimate the theoretical to be compared with the observed one. We emphasize that the SFHs and the best fit CMDs adopted in present analysis have been derived using the BaSTI stellar model library (Pietrinferni et al., 2004).
In the following, we outline the details of the method to estimate the parameters in the empirical and in the best fit CMDs, presenting both the HB luminosity level estimates (§2.1) and the bump detections (§2.2).
Since the data collected for this project have been observed in the ACS and passbands, we define the color, which is adopted for both CMDs101010With the usual notation, we will refer to and for the absolute and apparent magnitude, respectively.. The reason for this choice is twofold: i) the magnitude is quite close to the Johnson V band commonly used to study the RGB bump, and ii) the luminosity of the HB is roughly constant as a function of color within the RR Lyrae instability strip (see below).
2.1 Estimate of the HB luminosity
In concordance with other studies, we estimate the HB luminosity at the color corresponding to the RR Lyrae star instability strip ( mag). However, we estimate that the mean magnitude of the HB changes by mag from the bluest to the reddest limit of the instability strip. Therefore, we obtained the HB luminosity in a 0.2 mag wide color bin consistent with the center of the instability strip, centered at mag. Note that the change in the HB luminosity is 0.03 mag when using the full color range instead of the adopted range which is well within our quoted uncertainties.
In the case of the observed CMD, we cannot estimate the Zero Age Horizontal Branch (ZAHB) by adopting the lower envelope of the observed stellar distribution (as is usually done in the case of Galactic GCs) since the presence of blends, unresolved galaxies, and/or RR Lyrae variables with poorly measured mean magnitudes can affect the estimate of the ‘real’ ZAHB level. Therefore, we have adopted a different approach. By using the synthetic, best fit, CMDs, we have verified that the luminosity level at 1.5 fainter than the peak magnitude of the HB LF, calculated by means of a Gaussian fit, nicely reproduces the location of the theoretical HB lower envelope for all of the galaxies in our sample; the same method was then used for estimating the ZAHB level in all galaxies.
Figure 1 shows the example of Cetus. The left panel shows a zoom of the CMD, where the thick black line marks the estimated ZAHB. The right panel shows the histogram of the HB stellar magnitudes. The dashed line represents all the HB stars in the color range 0.4 0.9, while the solid line represent the adopted sub-sample in a restricted color range. Over-plotted on this we present the fitted Gaussian profile and the position of the estimated ZAHB, marked by the arrow. The observed HB levels for all the galaxies of our sample are shown in Figure 2, left panels, and summarized in Table 1.
| galaxy | ||||
|---|---|---|---|---|
| Cetus | ||||
| IC1613 | ||||
| LGS 3 | ||||
| Tucana | ||||
In the case of the best fit CMD, the HB is populated by stars which are, by construction, on the ZAHB, or eventually brighter due to evolutionary effects (which are modeled in IAC-star, Aparicio & Gallart 2004). Therefore, we can safely adopt the minimum of the distribution to characterize the HB luminosity. We adopted the same color range as for the observed CMD. The derived values are presented in Table 2.
2.2 Detection and characterization of the RGB bump
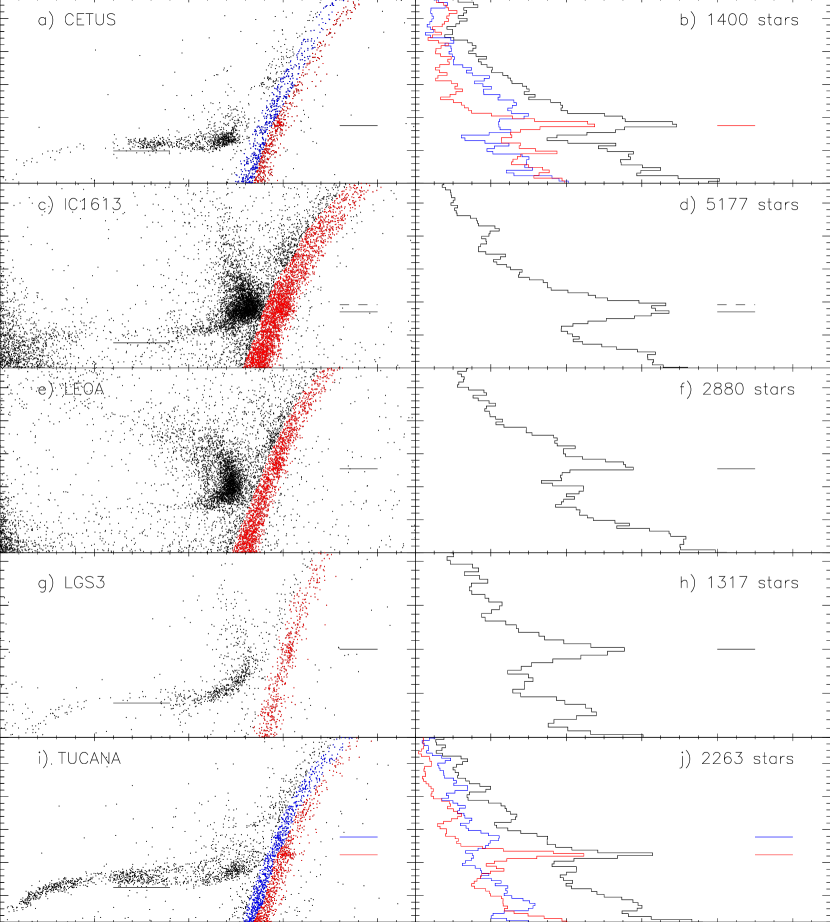
The RGB bump appears as an obvious feature in the five observed CMDs (see Figure 2). To estimate the magnitude of the observed bumps, we first performed a selection of the RGB regions, in order to avoid the contamination by the stars in different evolutionary stages (colored dots in Figure 2, left panels). We then calculated the luminosity function of the RGB using a running average, to smooth out the binning effect. The dimension of the smallest bin is 0.04 mag, which is the assumed error on the bump magnitude estimate. Figure 2 shows the location of the detected RGB bump for the five galaxies, both in the CMD and in the differential LF. Note that the histograms in the right panels have been arbitrarily normalized for clarity.
| galaxy | Age (Gyr) | Metalicity (Z) | ||||
|---|---|---|---|---|---|---|
| Cetus | 8 | [0.0003, 0.0006] | 0.41 | |||
| 8 | [0.0006, 0.0010] | 0.43 | ||||
| IC1613 | 5 | [0.0006, 0.0012] | 0.43 | |||
| 5 | [0.0012, 0.0020] | 0.45 | ||||
| LGS3 | 5 | [0.0003, 0.0006] | 0.41 | |||
| Tucana | 8 | [0.0001, 0.0005] | 0.41 | |||
| 8 | [0.0005, 0.0010] | 0.45 |
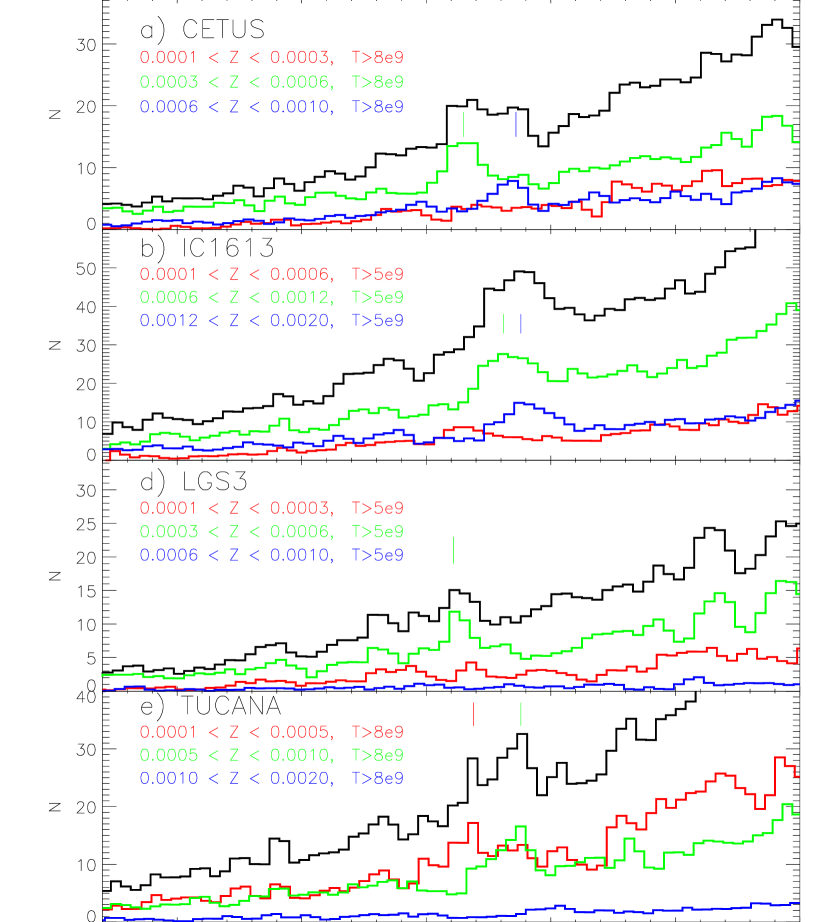
The same approach was applied to the best fit CMD. However, the information from the SFH, reflected in the best fit CMD, allows a deeper analysis of this diagram. Since these galaxies have composite stellar populations, their RGB bumps can be the result of the superposition/contribution of different sub-populations with different ages and/or chemical compositions. Therefore, using the information from the SFHs, we can identify which stellar component is the dominant contributor to the RGB bump. To do this, we tested different metallicity bins, building the corresponding LFs and comparing them with the global one. A few tests allowed us to find out the optimal age and metallicity ranges for each galaxy. The final result of this analysis is shown in Figure 3, for the four galaxies for which we have been able to estimate both the HB and RGB bump luminosity level. Note that the age and metallicity bins slightly change from one object to another, because of their different evolutionary histories, and that we only adopt a weak constraint on the age, since the dominant parameter affecting the RGB bump brightness is the metallicity.
Table 2 summarizes the derived quantities for the best fit CMDs: the estimated luminosity of the HB and RGB bump, and the calculated , together with the adopted age and metallicity ranges. The error associated to the RGB bump brightness has been estimated as half of the width of the magnitude bin of the RGB luminosity function.
We wish to emphasize that, since in retrieving the SFH we have not taken into account the RGB and HB stages (Monelli et al., 2010a; Hidalgo et al., 2010), the obtained model predictions are the results of a ‘blind’ technique for which no a priori constraints (such as star counts and CMD location) have been applied. Consequently, the comparison between theory and observations can provide useful (albeit indirect) clues concerning the accuracy of the theoretical framework reproducing the RGB bump brightness in composite stellar populations.
2.3 Notes on individual galaxies
TUCANA – A visual inspection of the observed CMD reveals the presence of two clear over-densities along the RGB: the brightest is located on the blue edge of the RGB, while the faintest is on the red edge. To further investigate the possible occurrence of two distinct bumps in Tucana, we calculated the LF of both the red and the blue portion of the RGB, as shown in panel of Figure 2. The corresponding histograms (in color in panel ), shown together with the global LF (solid black line), support the detection of two distinct RGB bumps in Tucana, separated by 0.27 0.06 mag.
The presence of a double bump has direct connections with the SFH of Tucana.
Two of the main results of the LCID project concerning this galaxy are:
Tucana experienced a strong initial burst of star formation, at the oldest
possible ages ( 12.5 Gyr ago, implying a substantial population of metal
poor stars), and followed by a steady decrease until reaching a complete
termination roughly 8 Gyr ago (Monelli et al. in prep.)
Tucana hosts two distinct populations of RR Lyrae variable stars, characterized
by different luminosity, pulsational properties, and radial distributions
(Bernard et al., 2008).
These two findings suggest that the Tucana dSph was able to form two different
generations of stars with different chemical properties in a very short time
interval early on, so both populations are old enough to produce RR Lyrae.
Therefore, there is a good qualitative agreement between these results
and the independent detection of two RGB bumps, which can be interpreted
using the LF of the best fit CMD. In fact, the latter also possesses a similar
double peak (Figure 3, panel ).
Interestingly, the two peaks are associated to two populations of different
metallicity: the brighter is made of stars with metallicity in the most
metal-poor range, 0.0001 0.0005, while the fainter is populated
by stars in the range 0.0005 0.001. The magnitude difference between
these two features, 0.19 mag, is in good agreement with the magnitude
difference of the observed bumps, 0.27 mag. Moreover, we verified that, as
expected, the most metal-poor stars populate the blue side of the RGB, while
the more metal-rich are located on the red side. Therefore, as for the observed
bump, the brightest bump is also the bluest, and the faintest is also the reddest.
Another interesting aspect is that the two Tucana bumps are the narrowest
among the LFs of the five galaxies, with estimated dispersions of =
0.04 mag and 0.06 mag for the faintest and the brightest,
respectively. This is possibly linked to the intrinsic short duration
of the bursts of star formation (Monelli et al. in prep.).
CETUS – The RGB bump of Cetus is also very prominent, as shown by Figure 2, panel . Interestingly, the position of the bump is similar to the faintest bump detected in Tucana, and both are located on the red edge of the RGB. The bump clearly stands out in the observed LF as well (Figure 2, panel ). The analysis of the red and the blue portion of the RGB (red and blue lines) shows that the global peak (solid black line) seems to be the result of the superposition of two different features. The main narrow peak is populated by stars on the red side of the RGB, while the bluer portion mostly contributes to broaden it. The width of the main peak, mag, is slightly larger than the corresponding faint bump in Tucana.
The comparison of the SFHs of Cetus and Tucana, presented in Monelli et al. (in prep.), shows that Cetus did not experience an initial burst as strong or as early as in Tucana. In particular, Monelli et al. found that the main star formation peak is 1 Gyr younger in Cetus than in Tucana. These differences, and the smoother SFH of Cetus, plausibly explain both the absence of a second brighter bump in Cetus, and the rather homogeneous properties of the RR Lyrae stars, which do not show any clear dichotomy, as in the case of Tucana (Bernard et al., 2009a).
The theoretical LF (Figure 3, panel ), shows quite a broad peak, formed by the contribution of two populations, in the ranges 0.0004 Z 0.0007, and 0.0007 Z 0.001. The LF of the most metal-poor stars does not show any clear feature.
IC 1613 – The bump region in the LF of IC 1613 is the widest among our sample (= 0.15 0.02 mag). This can be explained by the extended SFH of this galaxy, which was continuous from the oldest epoch to the present time. There are hints of the presence of two peaks, separated by 0.12 mag. The theoretical LF (Figure 3, panel ) shows that two populations are contributing to the main peak, in a wide range of metallicities. The corresponding peaks are separated by 0.07 mag.
LEO A – This galaxy has the most unusual SFH in our sample. Cole et al. (2007) found very low level of star formation starting 13 Gyr ago, in agreement with the small number of RR Lyrae stars detected (8: Dolphin et al. 2002, and 10: Bernard 2009b). Cole et al. (2007) further found that 90% of all star formation occurred in the last 8 Gyr, resulting in the only galaxy in the LCID sample with a dominant intermediate-age population. As a result, the HB inside and to the blue of the instability strip is very scarcely populated by old stars. Moreover, the time sampling in our ACS observations was poor and not adequate to accurately estimate the periods, and therefore the mean magnitudes, of the RR Lyrae stars. For these reasons, Leo A is not included in our analysis.
| Galaxy | [M/H] | |
|---|---|---|
| Sculptor | aaMajewski et al. 1999; | bbKirby et al. 2009; |
| Sculptor | aaMajewski et al. 1999; | bbKirby et al. 2009; |
| Ursa Minor | ccBellazzini et al. 2002; | ccBellazzini et al. 2002; |
| Sagittarius | ddMonaco et al. 2002; | ddMonaco et al. 2002; |
| Sextans | eeLee et al. 2003; | ffLee et al. 2009. |
3 Comparison between theory and observations
In the previous section, we have discussed our approach to attribute the contributions of the various sub-populations present in the galaxy to the RGB bump feature(s) in the global LF. When a double RGB bump is present in the empirical CMD, we checked the theoretical LF to determine which stellar components are responsible for the observed feature.

Since the HB luminosity level is strongly dependent on the metallicity, comparing theoretical predictions and observations of in stellar systems with mixed stellar populations with different metallicities could be liable to uncertainties. However, by using our best fit CMDs, we have tested that the more metal-rich populations are either too metal rich to populate the RR Lyrae instability strip, or that the difference in the HB luminosity level (the lower envelope of the two distributions within the instability strip) with respect to the lower metallicity stellar population contributing to the RGB bump feature(s), is of the order of 0.02- 0.03 mag, therefore within the error bars of our estimate from the observed CMD. Thus, when estimating the empirical , we have adopted for all galaxies, the magnitude corresponding to the lower envelope of the HB distribution, estimated as detailed above.
In Figure 4, we show the magnitude difference between the parameter as estimated from the observed and the synthetic CMDs. The error on this difference has been obtained by summing in quadrature the errors on the observational and theoretical estimates. Note that the average difference is mag. This result appears in qualitative agreement with the one obtained by comparing theory with observations of Galactic GCs concerning the parameter: the observed magnitude difference between the RGB bump and the HB appears lower than expected on theoretical grounds. Nevertheless, the difference estimated for our sample of dwarf galaxies appears significantly less than that obtained for Galactic GCs.

In order to allow a more direct analysis of how present results compare with those obtained for galactic GCs, we show in Figure 5 the comparison between theory and observations in the - metallicity diagram, for a large sample of Galactic GCs investigated by Di Cecco et al. (2010)111111We selected a subsample of 15 GCs with accurate ground based photometry, adopting the iron content from Carretta et al. (2009) and an average -enhancement = 0.3 dex to calculate the global metallicity., for a selected sample of LG dwarfs for which estimates are available in literature (see data in Table 3), and for the LCID dwarf sample121212 We note that, since we are comparing the parameter with the theoretical estimate for a single, simple stellar population, for each RGB Bump detection in a given galaxy we should evaluate the observed parameter by considering the HB luminosity level of the corresponding stellar population producing this feature. However, as discussed at the beginning of this section, this would cause a change in the parameter of about 0.02-0.03 mag, i.e., small with respect to the empirical uncertainty in the estimation of the HB luminosity level. Therefore, we have decided to not apply any correction to the values listed in Table 1.. In the latter case, the comparison between theory and observations has been performed by using the parameter, after transferring the model predictions into this observational plane.
We note that the adopted theoretical framework is the one provided by Pietrinferni et al. (2004), i.e., the same adopted by Di Cecco et al. (2010), and by our group in the framework of the LCID project for retrieving the SFHs of the selected dwarfs. For the galaxies in our sample, we adopt the metallicity distribution coming from the SFH analyses. That is, we have chosen the metallicity value corresponding to the average of the metallicity range of the stellar populations contributing to the RGB bump in the best fit CMD (see the discussion in section §2.2 and data in Table 2) and a spread equal to the half width of the same interval131313We wish to note that, at odds with the case of Galactic GCs, this metallicity range is not related to the observational uncertainty in the metal content of the stellar population, but it provides an indication of the metallicity interval covered by the various sub-populations contributing to the RGB bump feature in each dwarf in our sample..
Since detailed SFH analysis, similar to those for our LCID sample, do not exist for the LG dwarfs selected from the literature, we are not able to properly characterize the particular stellar population(s) contributing to the RGB bump. Thus, we compare theoretical predictions with the measured by using the literature data at their face value. Table 3 summarizes the values from the original papers, the adopted metallicities, and the related references. In particular, the metallicity values have been taken, when available, from the most recent spectroscopic measurements, or from the comparison with fiducial RGB loci of selected Galactic GCs. We wish to note that the adopted empirical estimates for the parameter are not fully self-consistent due to the differences in the adopted procedure for estimating the HB luminosity level and/or the approach used for estimating the average metallicity of the stellar population to which the parameter is associated. Nevertheless, it is worth noting that this is, so far, the largest data-set ever collected for the parameter of LG dwarf galaxies.
The comparison between the theoretical predictions and the empirical (or ) estimates show that, despite the quoted limitations of the observational data for the dSphs, a better agreement exists with the theoretical predictions in the metallicity range explored with respect to the similar comparisons for Galactic GCs.

To investigate further the level of agreement between theory and observations for the various samples of objects, we have computed for each object the difference between the empirical estimate of the parameter and the corresponding theoretical prediction for a mean age of 12.8 Gyr141414This age value has been adopted as the mean age of the Galactic GC systems according to the assumption made by Marin-Franch et al. (2009). Note that a change of Gyr would change the theoretical predictions by about mag, which would have a marginal impact on our analysis. and the metallicity appropriate for the object under scrutiny. These differences are plotted in Figure 6. This figure shows that for the more metal-poor GCs there is a mean difference with respect to the theoretical predictions of about 0.24 0.16 mag. For the more metal-rich GCs and for the dwarf galaxies this average difference decreases to 0.08 and 0.02 mag respectively, with a standard deviation of 0.09 and 0.11 mag respectively. In addition, note that for the dwarfs there is no evident trend with the global metallicity. These results support the conclusions based on the data in Figure 4, and seem to point toward the presence of a problem in measuring the parameter in metal-poor GCs or, alternatively, to a problem in the GC metallicity scale.
An alternative possibility is that the complexity of the SFHs of the dwarf galaxies under investigation, can contribute to ‘mask’ the existence of a clear disagreement between theory and observations. To clarify this point, we performed a test devoted to verify if - and eventually at what extent - the RGB bump brightness detection in the global stellar population would be affected when removing sub-populations characterized by a different spread in age and metallicity. It is clear that this analysis can be performed only by using the synthetic best fit CMDs. Specifically, we removed from the global CMD all the stars younger than 6.5 Gyr and progressively increased this age limit with bins of 1 Gyr, i.e., removing all the stars younger than 7.5, 8.5, …, Gyr. In each case, we measured the brightness of the RGB bump of the remaining sample of stars. The same test was performed subtracting stars older than a certain age (12.5 Gyr), and decreasing this age limit (11.5, 10.5, … Gyr). In both cases we found that, at a certain point of this procedure, the RGB bump disappears, as expected. However, until this moment, the magnitude difference between the RGB bump in the global and in the selected CMD is of the order of few hundredths of magnitude, well within the uncertainties. We found the same effect in another analogous test where the stars were removed according to their metallicity.
As far as it concerns the HB luminosity level within the RR Lyrae instability strip, as well known it is not affected by the presence of an age spread in the stellar population, and the impact of the existence of a metallicity spread has been discussed - at least in the case of our sample of galaxies - in section 2.1. This analysis confirms that the complexity of the SFH - at least in the case of our dwarfs galaxies - does not hamper the possibility of a meaningful comparison between theory and observations. However, one has to bear in mind that, in case of a more complex, or peculiar, SFH, this result might not be valid; therefore it is important to investigate in detail each individual case.
For our purpose, it is enough to remark that the existence of a better agreement between theory and observations with respect to Galactic GCs cannot be an artifact due to complex stellar populations. In order to understand the causes of the discrepancy existing for Galactic GCs, a detailed analysis of the possible observational biases (uncertainties) is mandatory, but this is beyond the scope of the present work.
3.1 The parameter
In the previous section, we have investigated the level of agreement between the observational measurements of the RGB bump brightness in our sample of dwarf galaxies and the theoretical predictions as obtained both by synthetic CMDs, reproducing the complex SFH of these galaxies, and by stellar models covering a range of age and metallicity. However, there is another important piece of information that can be retrieved from the RGB in the observed CMDs, i.e., the star counts. It is well known (for a review see Salaris et al., 2002, and references therein) that an appropriate comparison between the empirical and theoretical RGB LFs is one of the best tools for checking the capability of stellar models to predict the evolutionary lifetimes along this important evolutionary stage.
In particular, Bono et al. (2001) defined a new observable, the , parameter, defined as the ratio between the star counts across the RGB bump and in a region located at a fainter magnitude along the RGB. They used this new parameter for investigating the occurrence of non-canonical deep-mixing during the RGB bump stage (see Weiss et al. 2000) in a large sample of Galactic GCs. As a result of their analysis, they found a very good agreement - with very few exceptions - between theory and observations.

Due to the evident complexity of the SFH in dwarf galaxies with respect of Galactic GCs151515However, we refer the interested reader to Cassisi et al. (2008) for a short review about the growing observational evidence that many - if not all - Galactic GCs host multiple stellar populations., our CMDs are not the best tool for investigating the occurrence of deep-mixing in RGB stars. This notwithstanding, we have decided to measure the in our empirical CMDs and compare these measurements with the corresponding ones provided by the accurate best fit synthetic CMDs. This comparison allows us to check if the predicted star counts along the RGB are in agreement with the empirical data. In this context, we wish to emphasize again that, when obtaining the best fit synthetic CMD for each galaxy in our sample, we have not imposed any constraints on this evolutionary stage.
As far as it concerns the method for measuring the parameter, we have adopted the same method outlined by Bono et al. (2001). The values measured in the empirical and synthetic CMDs are provided with the corresponding errors in Tables 1 and 2. In Figure 7, we plot the differences between the observed value(s) of in each dwarf in our sample, and the theoretical value(s) as estimated from the synthetic best fit CMD. This figure shows very good agreement between theory and observation: the mean difference is equal to . This result provides further evidence of the capability of retrieving the SFH of these complex stellar systems as well as of the evolutionary theoretical framework of providing correct predictions of stellar lifetimes along the RGB stage.
4 Summary and Conclusions
We have presented an homogeneous analysis of the RGB for five isolated dwarf galaxies in the LG. This analysis allowed us to obtain the first detection of the RGB LF bump in these stellar systems. In order to perform a direct comparison with theoretical data, we measured the parameter in four galaxies in our sample.
We have designed and implemented a new approach to estimate this parameter, based on comparing an observed CMD with a theoretically calculated CMD. This method takes advantage of the detailed knowledge of the stellar content of the sample galaxies, in terms of age, metallicities, and star counts, to identify which sub-population is actually contributing to form the RGB bump. This is a fundamental advantage when working with complex stellar populations.
The comparison between the observations and the theoretical predictions reveal that the well-known discrepancy between the observed and predicted brightness of the RGB bump seen in Galactic GCs is smaller, by more than a factor of two, in our dSph sample. This evidence is supported by the inclusion of four additional dSph, for which the values are available in the literature.
It may be somewhat surprising that the level of agreement between theory and observations is better for complex stellar populations (dSphs) than for simple stellar populations (Galactic GCs). However, although the complex nature of the stellar population could represent a drawback for clearly detecting the observational features and reliably identifying the stellar component responsible for the observed feature - and in this context our approach is a big advantage -, the statistical significance of the stellar samples is quite larger. In the case of our sample of dwarf galaxies, we have investigated if the complexity of the SFH can affect our estimates of the parameter in the empirical CMDs. As a result, we have found that - at least for our sample of dSph - the measurement of the parameter is not significantly affected by the mix of sub-populations in the host galaxy.
Our analysis has also shown the existence of a very good agreement between observations and theoretical predictions concerning the parameter. This agreement represents supporting evidence that the adopted theoretical framework is providing accurate estimates of stellar evolutionary lifetimes.
The present analysis also emphasizes the importance of combining the detection and characterization of the RGB bump(s), with other information concerning the properties of the stellar populations hosted by a galaxy. In this context, it is particularly important to note the case of the Tucana dSph; the detection of a double bump can be correlated both with the properties of the RR Lyrae stars and the SFH of this galaxy, supporting the coexistence of two old stellar populations, with slightly different metallicities, formed during an initial strong episode of star formation. This provides support for the use of the RGB bump as a stellar population indicator for CMD which do not reach the oldest main sequence turn-off.
Acknowledgements.
Facilities: HST (ACS). We warmly thank our referee for her/his pertinent comments and suggestions that have improved the readability and the content of this paper. Support for this work was provided by NASA through grant GO-10515 from the Space Telescope Science Institute, which is operated by AURA, Inc., under NASA contract NAS5-26555, the IAC (grant 310394), the Education and Science Ministry of Spain (grants AYA2004-06343 and AYA2007-3E3507). This research has made use of NASA’s Astrophysics Data System Bibliographic Services, which is operated by the Jet Propulsion Laboratory, California Institute of Technology, under contract with the National Aeronautics and Space Administration. S.C. acknowledges the financial support of the Ministero della Ricerca Scientifica e dell’Universita’ PRIN MIUR 2007: ‘Multiple stellar populations in globular clusters’ (PI: G. Piotto), ASI grant ASI-INAF I/016/07/0, and the Italian Theoretical Virtual Observatory Project (PI: F. Pasian).References
- Alongi et al. (1991) Alongi, M., Bertelli, G., Bressan, A., & Chiosi, C. 1991, A&A, 244, 95
- Alves & Sarajedini (1999) Alves, D. R., & Sarajedini, A. 1999, ApJ, 511, 225
- Marin-Franch et al. (2009) Marín-Franch, A., Aparicio, A., Piotto, G., Rosenberg, A., Chaboyer, B., Sarajedini, A., Siegel, M., et al. 2009, ApJ, 694, 1498
- Aparicio & Gallart (2004) Aparicio, A., & Gallart, C. 2004, AJ, 128, 1465
- Aparicio & Hidalgo (2008) Aparicio, A., & Hidalgo, S. L. 2009, AJ, 138, 558
- Bellazzini et al. (2001) Bellazzini, M., Ferraro, F. R., & Pancino, E. 2001, MNRAS, 327, L15
- Bellazzini et al. (2002) Bellazzini, M., Ferraro, F. R., Origlia, L., Pancino, E., Monaco, L., & Oliva, E. 2002, AJ, 124, 3222
- Bellazzini et al. (2005) Bellazzini, M., Gennari, N., & Ferraro, F. R. 2005, MNRAS, 360, 185
- Bernard et al. (2008) Bernard E., et al. 2008, ApJ, 678, L21
- Bernard et al. (2009a) Bernard E., et al. 2009, ApJ, 699, 1742
- Bernard (2009b) Bernard E. 2009, PhD Thesis, Universidad de La Laguna, Tenerife, Spain
- Bernard et al. (2010) Bernard E., et al. 2009, ApJ in press
- Bjork & Chaboyer (2006) Bjork, S. R., & Chaboyer, B. 2006, ApJ, 641, 1102
- Bono et al. (2001) Bono, G., Cassisi, S., Zoccali, M., & Piotto, G. 2001, ApJ, 546, L109
- Carretta et al. (2009) Carretta, E., Bragaglia, A., Gratton, R., D’Orazi, V., & Lucatello, S. 2009, A&A, 508, 695
- Cassisi & Salaris (1997) Cassisi, S., & Salaris, M. 1997, MNRAS, 285, 593
- Cassisi et al. (2008) Cassisi, S., Bragaglia, A., Gratton, R., Milone, A., Piotto, G., & Renzini, A. 2008, The Messenger Supplement, 134, 13
- Cole et al. (2007) Cole, A. et al. 2007, ApJ659, 17
- Di Cecco et al. (2010) Di Cecco, A., et al. 2010, ApJ, 712, 527
- Dolphin (2000) Dolphin, A. E. 2000, PASP, 112, 1383
- Dolphin et al. (2002) Dolphin, A. E., et al. 2002, AJ, 123, 3154
- Ferraro et al. (1999) Ferraro, F. R., Messineo, M., Fusi Pecci, F., de Palo, M. A., Straniero, O., Chieffi, A., & Limongi, M. 1999, AJ, 118, 1738
- Ferraro et al. (1990) Ferraro, F. R., Clementini, G., Fusi Pecci, F., Buonanno, R., & Alcaino, G. 1990, A&AS, 84, 59
- Fusi Pecci et al. (1990) Fusi Pecci, F., Ferraro, F. R., Crocker, D. A., Rood, R. T., & Buonanno, R. 1990, A&A, 238, 95
- Hidalgo et al. (2010) Hidalgo, S.L. et al., 2010, ApJ submitted
- Kirby et al. (2009) Kirby, E.N., Guhathakurta, P., Bolte, M., Sneden, C., & Geha, M.C. 2009, ApJ, 705, 328
- King et al. (1985) King, C. R., Da Costa, G. S., & Demarque, P. 1985, ApJ, 299, 674
- Lee et al. (2003) Lee, M. G., et al. 2003, AJ, 126
- Lee et al. (2009) Lee, M.G., Yuk, I.-S., Park, H.S., Harris, J., & Zaritsky, D. 2009, ApJ, 703, 692
- Majewski et al. (1999) Majewski, S. R., Siegel, M. H., Patterson, R. J., & Rood, R. T. 1999, ApJ, 520, L33
- McConnachie et al. (2006) McConnachie, A. W., Arimoto, N., Irwin, M., & Tolstoy, E. 2006, MNRAS, 373, 715
- Monaco et al. (2002) Monaco, L., Ferraro, F. R., Bellazzini, M., & Pancino, E. 2002, ApJ, 578, L47
- Monelli et al. (2010a) Monelli, M. et al., 2010a, ApJ accepted
- Pietrinferni et al. (2004) Pietrinferni, A. et al. 2004, ApJ, 612, 168
- Riello et al. (2003) Riello, M., et al. 2003, A&A, 410, 553
- Salaris et al. (2002) Salaris, M., Cassisi, S., & Weiss, A. 2002, PASP, 114, 375
- Schlegel et al. (1998) Schlegel, D.J., Finkbeiner, D.P., Davis, M. 1998, ApJ, 500, 525
- Sirianni et al. (2005) Sirianni, M. et al. 2005, PASP, 117, 1049
- Stetson (1994) Stetson, P. B. , 1994, PASP, 106, 250
- Weiss et al. (2000) Weiss, A., Denissenkov, P.A., & Charbonnel, C. 2000, A&A, 356, 181
- Zoccali et al. (1999) Zoccali, M., Cassisi, S., Piotto, G., Bono, G., & Salaris, M. 1999, ApJ, 518, L49