LCD-Note-2010-005
∗ CERN, Geneva, Switzerland,
† University of California at Santa Cruz, Santa Cruz, CA, USA,
‡ Laboratoire d’Annecy-le-Vieux de Physique des Particules, Annecy-le-Vieux, France
The determination of smuon and neutralino masses in smuon pair production is an important part of the program of spectroscopic studies of Supersymmetry at a high energy linear collider. In this note we report the first results of a study of in a high-mass, cosmology-motivated Supersymmetric scenario at 3 TeV at CLIC. This process is a good example to study requirements on the beam energy spectrum and polarisation and the track momentum resolution in a simple final state. We discuss the expected accuracy on the mass measurements as a function of the momentum resolution, luminosity spectrum, beam polarisation and time stamping capability. Results obtained at generator level are validated by comparison to full simulation and reconstruction. Preliminary requirements for the detector performances and beam polarisation are presented.
1 Introduction
One of the main objectives of linear collider experiments is the precision spectroscopy of new particles predicted in theories of physics beyond the Standard Model (SM), such as Supersymmetry (SUSY). Since some, or most, of these particles may have masses of , these studies may be central to the physics program of a multi-TeV linear collider, such as CLIC.
In this note, we study the production of the supersymmetric partners of the muon in a specific SUSY scenario, where we assume R–parity conservation within the so-called constrained Minimal Supersymmetric extension of the SM (cMSSM). In this model the neutralino () is the lightest supersymmetric particle and the specific parameters of the benchmark point [1] are chosen to make it compatible with current collider and cosmology data. In particular, the properties of the lightest neutralino are such that it generates the correct amount of relic dark matter density in the universe, as obtained from the analysis of the WMAP data [2]. Scalar muons ( and ) are the supersymmetric partners of the right- and left-handed charged muons. Smuons are produced in pair through -channel exchange in the process and each decay into an ordinary muon and a neutralino, . The neutralino, being weakly-interacting, escapes detection. Therefore, the experimental signature of the process is two oppositely charged muons plus missing energy. This study concentrates on the lightest smuon, , which, for the chosen model parameters, has a mass of 1108.8 GeV , while the mass of the lightest neutralino is 554.3 GeV. The accurate determination of their masses is an essential part of the spectroscopy study of a high mass SUSY scenario at CLIC. A study of the variation of the predicted relic dark mass density in the universe with the lightest neutralino mass in the cMSSM shows that a 1.0 GeV uncertainty on its mass corresponds to a 0.05 relative uncertainty on , i.e. the current accuracy from cosmic microwave background observations [3]. The main aim of this study is to assess the requirements for a detector at CLIC operating at a centre-of-mass energy, , of 3 TeV as a function of the track momentum resolution, luminosity spectrum and beam polarisation. The reconstruction of the particle masses through the endpoints of the muon momentum spectrum is a good example for these requirements since the analysis is particularly simple and can be carried out using a simple momentum smearing on generator-level observables. Results are validated using full simulation and reconstruction with the CLIC-ILD detector model.
2 Simulation data sample
The simulation is performed for the cMSSM parameters of point K’ of ref. [1]. In the cMSSM the mass parameters are defined at the GUT scale. The subsequent evolution to the electro-weak scale is performed using the renormalisation group equations of Isasugra 7.69 [4]. Signal events are generated using Pythia 6.125 [5]. At 3 TeV, the production cross section for the process , for unpolarised beams, is 0.71 fb. Beamstrahlung effects on the luminosity spectrum are included using results of the CLIC beam simulation for the 2008 accelerator parameters [6]. Initial state radiation (ISR) is included in the event generation in Pythia. The following background processes have been included in the background calculation:
| Process | Cross section |
|---|---|
| =10.5 fb | |
| =0.5 fb | |
| =0.4 fb | |
| (inclusive SM) | =135 fb |
The first three processes have been simulated with Pythia. In addition, the inclusive SM process is generated using CompHep [7], removing the contributions from the and diagrams, to avoid double counting. The estimated cross section is 135 fb. In the background study we neglect the contribution not due to and decays, since its cross section is only 0.2 fb. We assume a data sample corresponding to an integrated luminosity of 2 ab-1 taken at a nominal energy of 3 TeV, corresponding to 3.5 years (1 year = s) of run at the nominal CLIC luminosity of 61034 cm-2s-1. Beam polarisation is in general extremely helpful in the study of SUSY processes both to improve the signal-to-background ratio and as an analyser [8]. We consider here three options for beam polarisation: i) unpolarised beams, ii) P()=+80 % and P()=0 % and iii) P() = +80 % and P()=-60 %. The main benefits of beam polarisation for this analysis are the suppression of the background (by a factor of five for ii, and ten for iii)), the enhancement of the smuon cross section (by a factor 1.5 for ii), and 2.3 for iii)) and the possibility to disentangle from and production. In this analysis we use observables at the generator level applying a track momentum smearing. Results are validated by comparing with fully simulated and reconstructed events in section 3.3.7.
3 Analysis Procedure
3.1 Signal topologies and event pre-selection
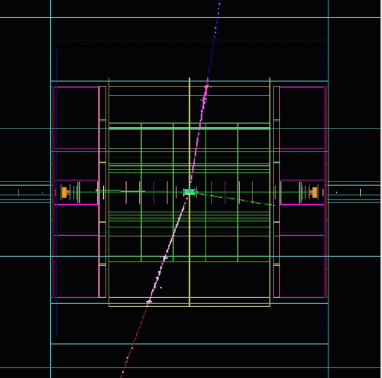
The signal process has two undetected ’s in the final state. Therefore, the main characteristics of signal events are large missing transverse momentum, missing energy and acoplanarity (see Figure 1).
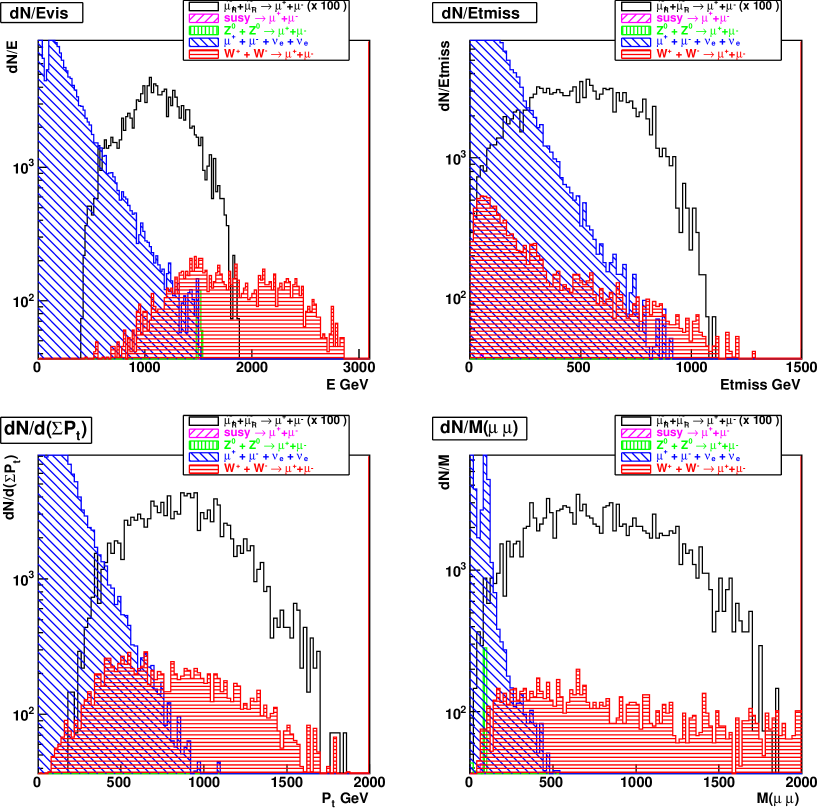
Despite the striking signature of two muons and large missing energy, the small anticipated signal production cross section at the K’ benchmark point, makes this analysis rather challenging. In our analysis, the signal selection proceeds as follows. First, we apply an event pre-selection, which requires two oppositely-charged muons with 5 GeV and , where is the particle polar angle. Next, we combine the values of the signal probabilities for the following discriminating variables into a global likelihood variable Prob:
-
•
visible energy ,
-
•
missing transverse energy ,
-
•
sum of transverse momentum of the muons ,
-
•
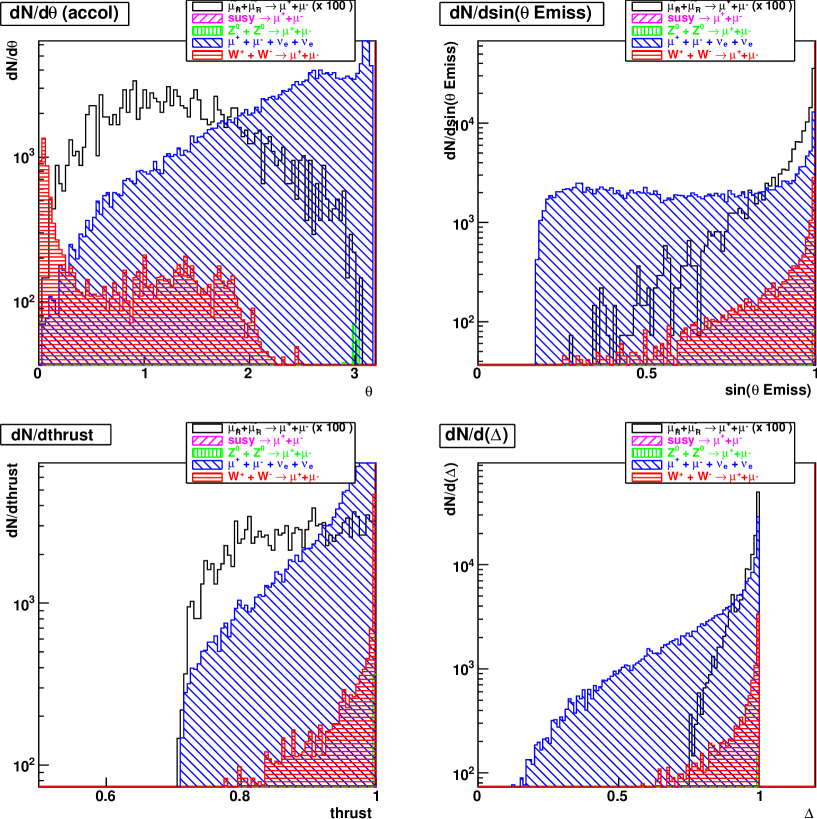
maximum acollinearity and acoplanarity,
-
•
polar angle of the missing energy vector ()
-
•
invariant mass of the two muons,
-
•
the thrust of the two muons,
-
•
unbalance of the muon momenta
-
•
missing mass
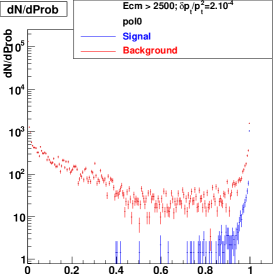
where and with the missing mass calculated from the visible energy and momentum , and . Figures 2 and 3 show the distributions of some of the discriminating observables for signal and background samples after pre-selection and requiring GeV.
 |
3.2 Final selection efficiency and background estimate
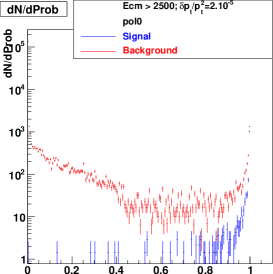
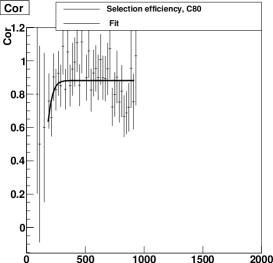
The normalised signal-to-background ratio, S/B, values of these variables, as well as the combined probability Prob are computed for different detector resolution assumptions: = , , , and GeV-1. Fig. 4 shows the distribution of the combined probability for signal and background events, the selection efficiency and the signal-over-background ratio as a function of the combined probability value, as well as the signal selection efficiency as a function of muon momentum.
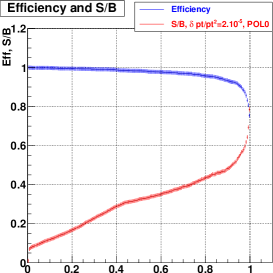
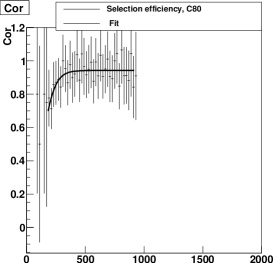
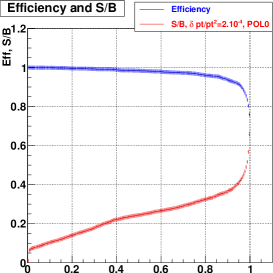
There are two main effects on the muon momentum distribution in selected events. First, the efficiency of the selection on the combined probability is not flat with the muon momentum. Therefore, a cut on this variable introduces an inefficiency at the lower edge of the distribution and a subsequent bias towards higher momenta, see Figure 4(c). This inefficiency increases with the value of the probability cut applied. The inefficiency and the bias increase also when the momentum resolution degrades. Fig. 5 shows the same distributions for = GeV-1, Fig. 5(c) shows a bias towards higher momenta. This effect is accounted and corrected for in the fits performed for signal+background (see Figure 12 (b)) Both beamstrahlung and momentum resolution introduce a smearing of the upper momentum edge. Both effect have a potential impact on the statistical accuracy and the bias in extracting the SUSY particle masses from a fit to the reconstructed momentum distribution, as discussed below.
The Signal-over-background ratio depends also on the beam polarisation. Fig. 6 shows the efficiency and S/B as a function of the probability value for different polarisation options.
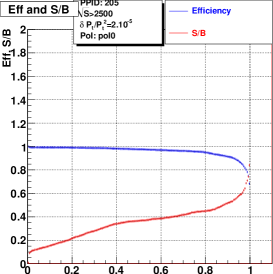
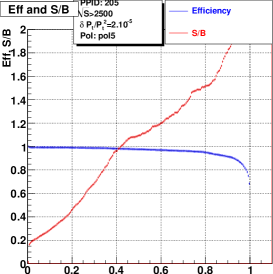
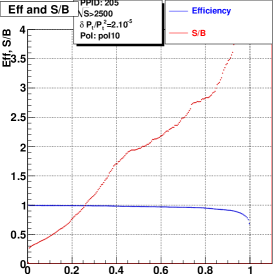
Table 1 lists the number of signal (S) and background (B) events, the selection efficiency and the S/B ratio for different values of the probability cut, momentum resolution, polarisation and time stamping values.
| Prob cut | pol | BX | |||||
| ( | |||||||
| 0.80 | 0 | 0/0 | 0 | 1315 | 2937 | 0.93 | 0.45 |
| 0.80 | 2 10-5 | 0/0 | 0 | 1319 | 2984 | 0.93 | 0.44 |
| 0.80 | 4 10-5 | 0/0 | 0 | 1319 | 2953 | 0.93 | 0.45 |
| 0.80 | 6 10-5 | 0/0 | 0 | 1318 | 3098 | 0.93 | 0.43 |
| 0.80 | 8 10-5 | 0/0 | 0 | 1317 | 3316 | 0.93 | 0.40 |
| 0.80 | 2 10-4 | 0/0 | 0 | 1318 | 4033 | 0.93 | 0.33 |
| 0.80 | 2 10-5 | 80/0 | 0 | 1319 | 1381 | 0.93 | 0.96 |
| 0.80 | 2 10-5 | 80/60 | 0 | 1319 | 1180 | 0.93 | 1.11 |
| 0.80 | 2 10-5 | 80/60 | 5 | 1317 | 1271 | 0.93 | 1.04 |
| 0.80 | 2 10-5 | 80/60 | 20 | 1299 | 1301 | 0.91 | 1.0 |
| 0.90 | 2 10-5 | 0/0 | 0 | 1285 | 2619 | 0.91 | 0.49 |
| 0.90 | 2 10-5 | 80/0 | 0 | 1285 | 1179 | 0.91 | 1.09 |
3.3 Smuon and neutralino mass determination
The smuon and neutralino masses are extracted from the position of the kinematic edges of the muon momentum distribution, a technique first proposed for squarks [9], then extensively applied to sleptons [10]:
| (1) |
The smuon and neutralino masses depend on the beam energy and the kinematic edges as:
| (2) |
where and are the high and low momentum edges of the muon momentum distribution. This shows that an accurate measurement of the shape of the luminosity spectrum must be achieved and the value of masses extracted from the momentum spectrum are correlated. We extract the and masses from a 2-par fit to the reconstructed momentum distribution. The fit is performed with the Minuit minimisation package [11]. We model the momentum spectrum according to (1), where accounts for beamstrahlung and ISR effects, as discussed below. Momentum resolution is included through a parametric smearing of the distribution for the analysis performed at generator level or full tracking for simulated and reconstructed events. The fit also accounts for the correlations between the and masses. To investigate the different contributions to the statistical uncertainty on the smuon and neutralino masses, several fits are performed by changing the input conditions.
3.3.1 Energy spread and ISR
We study the contribution of the centre-of-mass energy spread to the statistical accuracy of the fit. There are three sources of energy spread: the momentum spread in the linac, which gives a 7.5 GeV Gaussian smear on for the CLIC parameters, beamstrahlung, which contributes a long tail and initial state radiation (ISR); the first two are induced by the machine and we shall refer to them collectively as “luminosity spectrum”. We estimate the contribution of the luminosity spectrum to the statistical accuracy on the masses and of the knowledge of its shape to the mass accuracy and bias. We use the luminosity spectrum obtained from the GuineaPig [12] beam simulation for the 2008 CLIC parameters. First, we compare the results of the fit for i) events generated without luminosity spectrum spread at = 3 TeV, ii) events in the main peak of the luminosity spectrum, 2950 3020 GeV and iii) all events with 2500 GeV. In all these cases we apply a loose signal selection and we assume no resolution smearing for the muon momentum. Even without the luminosity spectrum contribution, the sum of the energies of the colliding electrons extends to energies significantly below the nominal due to QED effects. We model the ISR spectrum by an approximate solution to the Gribov-Lipatov equation, proposed in [13]. In the formula we leave free the parameter and the fraction of events off the full energy peak. We determine them by a fit to the ISR spectrum of Pythia signal events (see Figure 7).
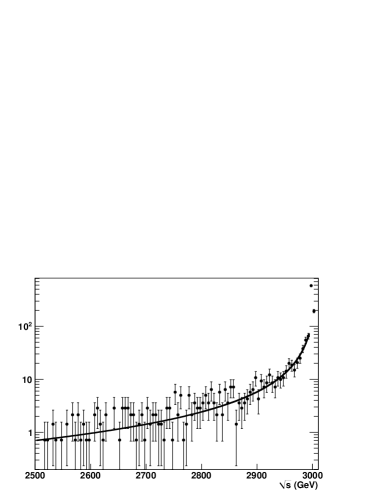
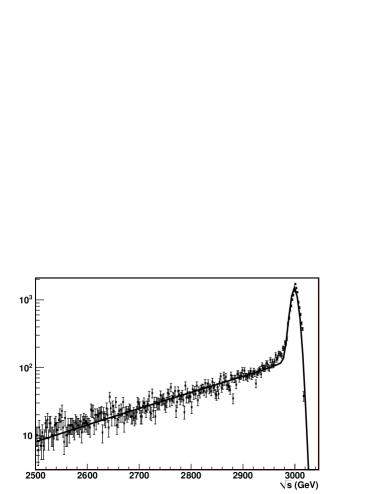
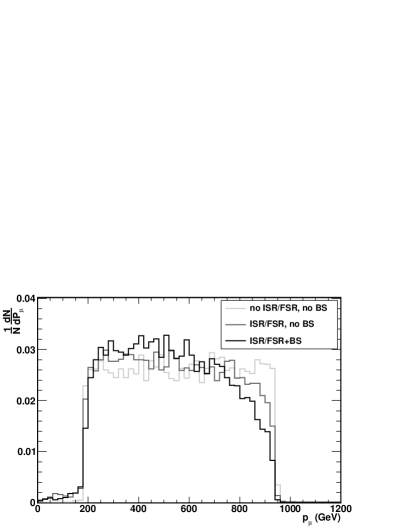
The resulting function is used to fold the ISR contribution in the shape of the muon momentum spectrum used in the mass fits. Fig. 8 shows the effect of ISR and ISR + beamstrahlung on the signal muon momentum spectrum.
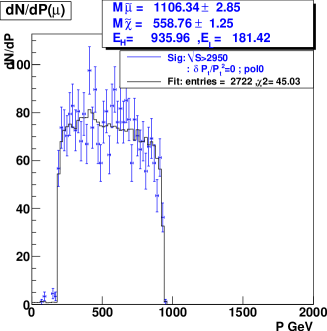
In order to assess the effect of the knowledge of the luminosity spectrum on the mass measurement accuracy, we consider the luminosity spectrum obtained from Calypso for simulated signal events and we model it using the parametrisation proposed in [14]. This parametrisation has two components: a core, which we assume to be Gaussian, and a tail. We perform a to the luminosity spectrum with five free parameters: the width of the Gaussian core, two parameters describing the tail shape and two normalisation coefficients. The result of the fit is shown in Figure 7. Then, we compare the results of the mass fit when we use the fitted parameters of the luminosity spectrum parametrisation to those we obtain by varying these by 15% of their values in a fully correlated way. This change of parameters corresponds to a change of the average value by 210-3. The mass and statistical uncertainty of the smuon change by 0.8 GeV and 15%, respectively, and that of the neutralino by 1.6 GeV and 10%, respectively. The actual accuracy on the determination of the shape of the luminosity spectrum will need to be assessed from a detailed study of observables such as the electron acollinearity in Bhabha events [15], but are expected to be not larger than those assumed here. Fig. 9 (left) shows the fitted muon momentum distribution for events with 2950 GeV 3000 GeV and (right) for events with 2500 GeV 3000 GeV. Results are summarised in Table 2. The fitted masses are in agreement with those generated = 1109 GeV and =554 GeV, within statistical uncertainties.

3.3.2 Muon photon radiation (FSR)
A source of resolution loss is photon radiation from muons. At 3 TeV, in about 15% of the events the muon radiates a photon. A fit to the muon momentum distribution for signal events applying only a loose selection, probability cut=0.5, a cut on the centre-of-mass energy, and without momentum resolution smearing leads to a small increases of the uncertainty on the neutralino mass, but a shift on the mass value. (see Table 2).
3.3.3 Event selection systematics
The signal selection cut may introduce a bias on muon momentum distribution which propagates on the result of the fit to the smuon and neutralino masses. In order to study the effect of this cut, we fit the muon momentum distribution for signal events with a momentum resolution smearing and two different probability cuts, in the range 0.8 to 0.99, For a cut at 0.99 GeV and GeV. For a cut at 0.8 GeV and GeV. For the events selected with a cut of 0.8 the fitted masses are in agreement with those generated, while for the tighter cut at 0.99 results are significantly biased. This could be eliminated by applying an efficiency correction which could carry systematic uncertainties. Therefore, for this analysis we adopt a selection cut at 0.8, which appears safe both in terms of signal-to-background ratio and signal bias.
3.3.4 Muon momentum resolution
Next, we estimate the contribution of the muon momentum resolution on the accuracy of the the masses coming from the fit. In multi-TeV collisions there is no equivalent of the Higgstrahlung , ( = , ) process, which sets a strict requirement for momentum resolution at lower values. Reactions such as smuon production in SUSY and in the SM [16] can provide useful guidance on the track momentum resolution requirements at high energies. We express the resolution in terms of , where is momentum component in the plane normal to the beam axis. We perform the mass fit for signal events fulfilling a loose selection and 2500 GeV 3000 GeV assuming different momentum resolution values: = 0, = GeV-1, = GeV-1, = GeV-1, = GeV-1 and = GeV-1. Fig. 10 and 11 show the fits to the signal muon momentum distribution for various momentum resolution values.
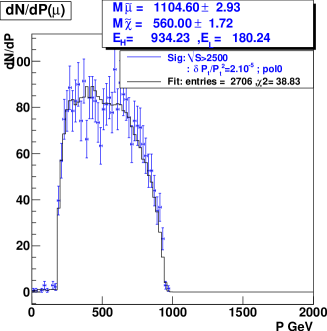
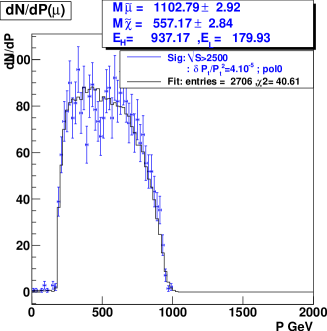
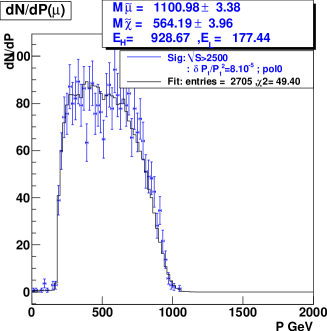
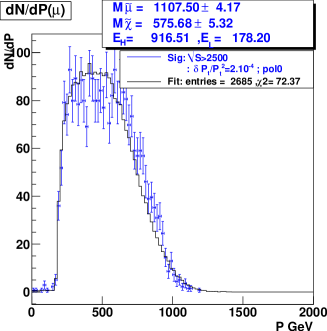
The smuon and neutralino masses are in good agreement with the generated masses. The uncertainty on the masses starts being significantly impacted from the momentum resolution when is larger than GeV-1 (see Table 2).
3.3.5 Background subtraction
The cross sections for the SM processes which can lead to the same final state as the signal are one to two orders of magnitude larger compared to that of the signal, in absence of beam polarisation. In order to assess the impact of the background on the statistical accuracy for the extraction of the and masses we repeat the analysis to the momentum distribution with both signal and background events.
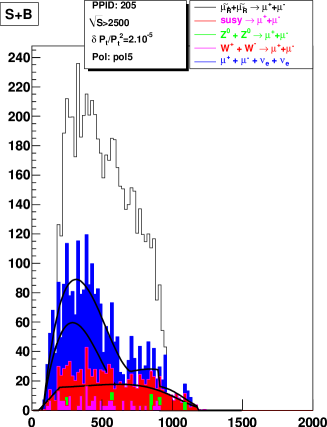
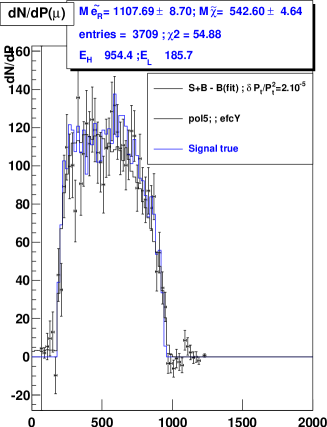
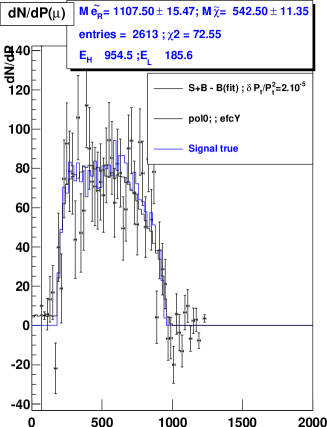
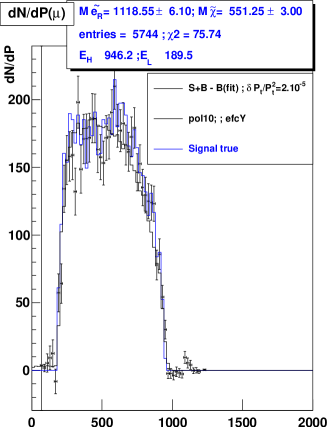
The background is modelled using an “ARGUS” function [17] in the range 200 GeV and a first order polynomial in the range 100 GeV200 GeV. The other backgrounds are modelled using a polynomial distribution. These functions are fitted on the momentum distribution of background events passing all the selection cuts and used to subtract the estimated background contribution from the signal + background momentum distribution. After background subtraction the signal distribution is corrected to take into account the momentum dependent selection efficiency. The fit is performed on the background-subtracted momentum spectrum. Fig. 12 shows the muon momentum distribution for signal and background events before (a) and after (b) background subtraction. Events are selected with a probability cut of 0.8 and the background is scaled assuming a 80 % electron beam polarisation. Fig. 13 shows the muon momentum distribution for background-subtracted events assuming (a) no polarisation and (b) both electron and positron polarisation. The polarisation of the electron beam only (option ii)) allows us to improve the measurement of the smuon and neutralino masses by 44 % and 59 % to a relative statistical accuracy of 0.8%. Adding positron beam polarisation (option iii)) further reduces these uncertainties to 0.6% and 0.5%, respectively (see Table 2). Background rejection by the use of polarised beams is far superior compared to what can be achieved using tighter cuts in absence of polarisation, as shown by a comparison of the results obtained with a 0.8 probability cut and electron polarisation to those for a tighter cut at 0.9 for unpolarised beams in Table 2. A dedicated energy scan of the smuon pair production threshold can further improve the measurements of these masses, also reducing their correlation.
3.3.6 Background
In collisions a high rate of collisions arises from photons radiated in the electro-magnetic interactions. On average there are about 3.3 hadrons per bunch crossing (BX). The products of the interactions overlap with those from the interactions under study. At CLIC, the 312 bunches of a train, separated by 0.5 ns, generate a significant number of extra particles which are superimposed to the products of the main events and degrade the quality of the measurement of its properties [18]. To estimate the contribution of this background to the uncertainty on the smuon and neutralino masses, particles from hadrons background are overlayed on signal and SM events, assuming a detector time stamping capability corresponding to the integration of 5 BX and 20 BX. In this analysis the main effect is the change in the efficiency of the signal selection. The normalised signal-to-background ratio, S/B, probabilities of the discriminating variables, as well as the combined probability Prob are computed for a detector resolution: = 2 10-5 GeV-1. We find that for the integration of 5 BX, the selection efficiency remains virtually unchanged at 0.93, while for 20 BX it becomes 0.91.
3.3.7 Full Simulation and Reconstruction
Finally, we repeat the analysis using fully simulated and reconstructed signal events. The beamstrahlung effects on the the luminosity spectrum are included. The simulation is performed using the Geant-4-based [19] Mokka program [20] with the CLIC01-ILD detector geometry, which is based on the ILD detector concept being developed for the ILC.
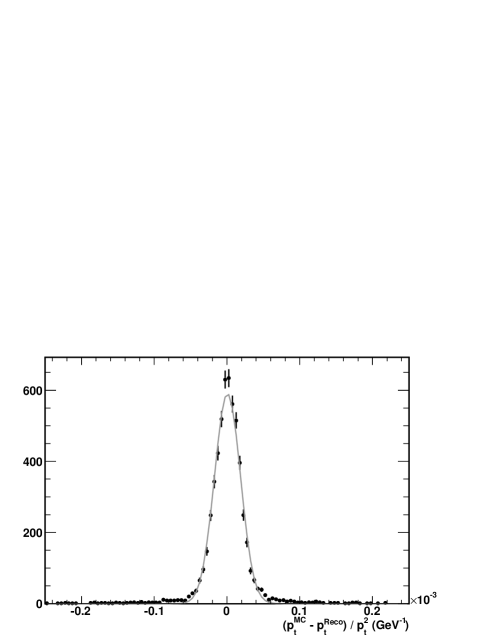
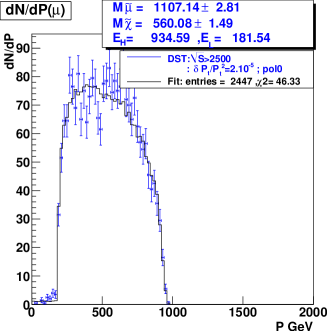
Events are subsequently reconstructed using the Marlin reconstruction program [21]. Figure 14 shows the measured momentum resolution obtained for muons in signal events. The masses and accuracies from the fit to the fully simulated and reconstructed events, (1118.4 3.0) GeV and (569.1 1.5) GeV, agree with those obtained at generation level with 210-5 GeV-1 momentum smearing (see Table 2).
| Data | Pol | BX | (M) (GeV) | |||
| ( GeV-1) | (GeV) | Set | (e-/e+) | |||
| 0. | 2950 | S | 0/ 0 | 0 | 1106.3 2.9 | 558.8 1.3 |
| 0. | 2500 | S | 0/ 0 | 0 | 1098.8 2.6 | 555.4 1.2 |
| 0. | 2500 (ISR only) | S | 0/ 0 | 0 | 1109.2 3.2 | 555.4 1.2 |
| 0. | 2500 | S (No FSR Cor) | 0/ 0 | 0 | 1095.3 3.2 | 557.7 1.3 |
| 2. | 2500 | S | 0/ 0 | 0 | 1104.6 2.9 | 560.0 1.7 |
| 2. | 2500 | S (G4+Reco) | 0/ 0 | 0 | 1107.1 2.8 | 560.1 1.5 |
| 4. | 2500 | S | 0/ 0 | 0 | 1102.8 2.9 | 557.2 2.8 |
| 6. | 2500 | S | 0/ 0 | 0 | 1098.8 3.1 | 559.1 3.6 |
| 8. | 2500 | S | 0/ 0 | 0 | 1101.0 3.4 | 564.2 4.0 |
| 20. | 2500 | S | 0/ 0 | 0 | 1107.5 4.2 | 575.7 5.3 |
| 2. | 2500 | S+B (0.8) | 0/ 0 | 0 | 1107.515.5 | 542.5 11.3 |
| 2. | 2500 | S+B (0.9) | 0/ 0 | 0 | 1107.514.4 | 551.2 12.0 |
| 2. | 2500 | S+B (0.8) | 80/ 0 | 0 | 1107.7 8.7 | 542.6 4.6 |
| 2. | 2500 | S+B (0.8) | 80/60 | 0 | 1118.5 6.1 | 551.3 3.0 |
| 2. | 2500 | S+B (0.8) | 80/60 | 5 | 1105.7 6.3 | 549.4 3.9 |
| 2. | 2500 | S+B (0.8) | 80/60 | 20 | 1113.2 6.8 | 550.3 3.4 |
3.4 Summary
This study allows us to draw some conclusions on the potential of a 3 TeV CLIC collider in SUSY spectroscopic measurements and some of the requirements on the detector and the beams. Because of the tiny production cross section in the chosen high-mass scenario, background subtraction is the dominant source of statistical uncertainty. Electron beam polarisation at 80 % gives an equivalent luminosity gain of a factor of six and is essential to recover precision. Positron polarisation is desirable, since it gives an additional gain of a factor of two in equivalent luminosity and it also allows us to disentangle the contributions of and . Smuon and neutralino masses of 1108.8 GeV and 554.3 GeV, respectively can be extracted from the muon kinematics, in events with two oppositely charged muons and missing energy, with a relative statistical accuracy 0.5 % with 2 ab-1 of integrated luminosity and both beams polarised. In addition, the signal production cross section of 0.7 fb can be determined with a relative statistical uncertainty of 2.0 %.
Since a major source of smearing of the kinematic edges of the muon momentum spectrum is beamstrahlung and ISR, the track momentum resolution does not appear to be critical for the measurement of the smuon mass, as long as a resolution GeV-1 can be achieved, though it remains important for the neutralino mass. It is important to have a good control of the luminosity spectrum and desirable to limit the beamstrahlung not significantly beyond that corresponding to the 2008 CLIC parameters.
Finally, the effect of the overlay of events from machine-induced background does not lead to any significant degradation of the signal selection efficiency for a detector with time stamping capability of 10 ns.
4 Acknowledgements
We are grateful to Daniel Schulte for making the luminosity spectrum and generated events available and to Dieter Schlatter for his careful reading of this note.
References
- [1] M. Battaglia, A. De Roeck, J. R. Ellis, F. Gianotti, K. A. Olive and L. Pape, Eur. Phys. J. C 33 (2004) 273 [arXiv:hep-ph/0306219].
- [2] E. Komatsu et al. [WMAP Collaboration], Astrophys. J. Suppl. 180 (2009) 330 [arXiv:0803.0547 [astro-ph]].
- [3] E. Komatsu et al., arXiv:1001.4538 [astro-ph.CO].
- [4] F. E. Paige, S. D. Protopopescu, H. Baer and X. Tata, arXiv:hep-ph/0312045.
- [5] T. Sjostrand, S. Mrenna and P. Z. Skands, JHEP 0605 (2006) 026 [arXiv:hep-ph/0603175].
- [6] H. Braun et al. [CLIC Study Team], CLIC-NOTE-764 (2008).
- [7] E. Boos et al. [CompHEP Collaboration], Nucl. Instr. and Meth. A 534 (2004), 250.
- [8] G. A. Moortgat-Pick et al., Phys. Rept. 460 (2008) 131 [arXiv:hep-ph/0507011].
- [9] J. L. Feng and D. E. Finnell, Phys. Rev. D 49 (1994) 2369 [arXiv:hep-ph/9310211].
- [10] H. U. Martyn and G. A. Blair, arXiv:hep-ph/9910416.
- [11] F. James and M. Roos, Comput. Phys. Commun. 10 (1975) 343.
-
[12]
D. Schulte, TESLA Note 97-08.
The results of the beam simulation have been provided by Daniel Schulte. - [13] M. Skrzypek and S. Jadach, Z. Phys. C 49 (1991) 577.
- [14] T. Ohl, Comput. Phys. Commun. 101 (1997) 269 [arXiv:hep-ph/9607454].
- [15] M. Battaglia, S. Jadach and D. Bardin, in Proc. of the Snowmass 2001 Workshop, N. Graf (ed.), SLAC-R-599 (2002), p. E3015.
- [16] M. Battaglia, J. Phys. G 35 (2008) 095005 [arXiv:0807.1299 [hep-ex]].
- [17] H. Albrecht et al. [ARGUS Collaboration], Phys. Lett. B 241 (1990) 278.
- [18] M. Battaglia, J.J. Blaising, J. Quevillon, A. Sailer, CLIC Note in preparation.
- [19] S. Agostinelli et al. [GEANT4 Collaboration], Nucl. Instrum. Meth. A 506 (2003) 250.
- [20] P. Mora de Freitas, in Proc. of the Int. Conf. on Linear Colliders (LCWS 04) vol. 1 (2004) 441.
- [21] F. Gaede, Nucl. Instrum. Meth. A 559 (2006) 177.