A comment on “Amplification of endpoint structure for new particle mass measurement at the LHC”
Abstract
We present a comment on the kinematic variable recently proposed in Cho et al. (2009). The variable is designed to be applied to models such as -parity conserving Supersymmetry (SUSY) when there is pair production of new heavy particles each of which decays to a single massless visible and a massive invisible component. It was proposed in Cho et al. (2009) that a measurement of the peak of the distribution could be used to precisely constrain the masses of the SUSY particles. We show that when Standard Model backgrounds are included in simulations, the sensitivity of the variable to the SUSY particle masses is more seriously impacted for than for other previously proposed variables.
If new physics is discovered at the Large Hadron Collider (LHC) Evans and Bryant (2008) we will wish to measure the masses of any new particles discovered. Several methods of measuring the masses of such new particles have been suggested (for a recent review see Barr and Lester (2010)).
Here we comment on the mass measurement variable recently proposed by Cho et al. Cho et al. (2009). The variable introduced in that paper was employed to constrain the participating particles’ masses for events characterised by pair production of identical-mass heavy particles, , each of which decays to a massive invisible and a single massless visible daughter, where the symbols in brackets label the momenta.
The experimental signature for this process
| (1) |
is therefore two visible particles (in this paper we assume these to be jets and those jets to be massless) and large missing momentum.
Cho et al. suggest constraining the masses by measuring the distribution of the variable Cho et al. (2009)
| (2) | |||
This variable is a novel amalgam of two methods previously described in the literature. The procedure of minimising the larger of two quantities — over all partitions of the invisible particles’ transverse momenta consistent with the missing transverse momentum — has its origins in the ‘stransverse mass’ of Lester and Summers (1999); Barr et al. (2003). However, whereas Lester and Summers (1999); Barr et al. (2003) take the larger of the two transverse masses for each decay, in (2) the quantities being evaluated at each possible partition of are the contransverse mass functions . These are defined (for ) by111 was originally proposed in Tovey (2008) for the case where both momenta correspond to visible particles and was motivated by particular invariance properties under back-to-back boosts in the transverse plane. The use of for the case where one input corresponds to a visible particle, but the other represents the hypothesised momentum of an invisible particle was an innovation of Cho et al. (2009).
| (3) |
where the transverse energy of a particle with transverse momentum and mass is given by , and is a trial value for the (a priori unknown) mass of the invisible particle. The sign in front of the inner product of the momenta in (3) distinguishes from the usual transverse mass.
The already bloated dictionary of transverse mass variable names is stretched nearer to (or perhaps beyond) breaking point by the addition of the term constransverse mass for the quantity defined in (2).
It was suggested in Cho et al. (2009) that by measuring the kinematic end-point of the distribution it should be possible to determine the mass of the parent particle accurately. This assertion is based on the observation Cho et al. (2009) that under the condition222Colloquially known as the condition of no ‘upstream transverse momentum’.
| (4) |
the distribution of is highly peaked at its maximal value (under that same condition),
| (5) |
where is the absolute momentum of the daughter particle in the rest frame of the parent333For a two body decay where and are the true masses of the parent and daughter SUSY particles respectively..
The central observation of Cho et al. (2009) is that the distribution has a sharply defined Jacobian peak at its kinematic endpoint (5), so a good measurement of that endpoint position could provide a precise constraint on the parent particle mass. This statement is founded on the reasonable expectation that the systematic uncertainty in fitting a sharp peak ought to be smaller than in fitting other distributions which tend to have smaller numbers of events near their kinematic endpoints.
We perform simulations similar to those in Cho et al. (2009) but including the most important Standard Model backgrounds. We find that those backgrounds are peaked in the same region as the signal, so play a much more significant role for the process of interest (1) than might be inferred from Cho et al. (2009). The end-point value (5) is relatively insensitive to the physical parameter , so a rather precise measurement of the peak position would be required to constrain the parent particle masses. We suggest that fitting the endpoint position with the required precision is likely to be difficult when the systematic effect from uncertain residual Standard Model backgrounds is taken into account.
As is highlighted in Cho et al. (2009), a judicious choice of is needed if the distribution of is to be sensitive to the particle masses. Cho et al. show that if one selects a value one loses the sharp peak in the distribution.
The variation of the endpoint position (5) with respect to is
| (6) |
so if one chooses the other extreme with , then
| (7) |
which has very limited sensitivity to the physical parameter . Therefore the value of that ought to be chosen should be close to (rather than for example the true invisible particle mass). For , respectively. As was recognised in Cho et al. (2009), even with a well-tuned the peak position does not vary much with so an accurate and precise measurement of is required to constrain (and from it the particle masses).
To study the effect that Standard Model backgrounds might have on the method proposed, we use a simulation similar to that described in Barr and Gwenlan (2009) including a parameterised detector response typical of a general-purpose LHC detector. Herwig++ 2.4.2 Bahr et al. (2008b, a) is used to produce samples of the following Standard Model backgrounds; QCD, , +jets, +jets and +jets for proton-proton collisions at centre of mass energy TeV. For a signal we use inclusive production of the SPS1a supersymmetry benchmark point Allanach et al. (2002) with the spectrum and decay table calculated by SPheno 2.2.3 Porod (2003). Jets are formed and smeared following the same procedure as described in Barr and Gwenlan (2009).
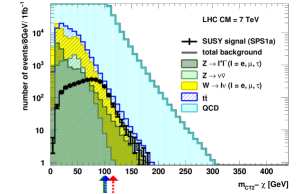
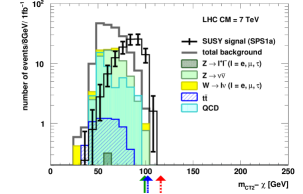
The expected peaking of the variable can seen in Fig. 1(a) after applying only minimal selection cuts requiring at least two jets with GeV and with pseudorapidity, . We have chosen , close to (which ranges from depending on which squark mass is used). In the region of the SUSY signal, it can be seen that the Standard Model backgrounds are large.
It can also be seen from Fig. 1(a) that the dependence of the position of the peak in the distribution on the physical parameter that one is trying to measure is very small. This is shown by the different coloured arrows on that plot indicating expected signal peak positions corresponding to different parent particle masses. Even with large variations in the parent particle mass (up to 100%) little variation in the peak position is seen. This means that a very precise determination of the peak position would be required in order to get sensitivity to the parent particle mass.444This is also true for other values of .
In Fig. 1(b) we show the distribution after the application of more selective SUSY cuts Collaboration (2009) proposed by ATLAS. The backgrounds appear reduced but are still significant in the signal region, and they have a peaked structure similar to the signal. These backgrounds will therefore have to be well-understood for the successful extraction of the signal shape.
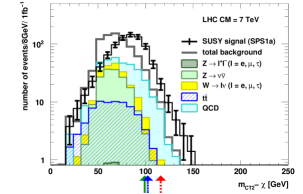
As was pointed out in Cho et al. (2009) it is possible to sharpen the end-point structure of the distribution by selecting a subset of events for which the ‘upstream momentum’ is small; i.e. those for which (4) is approximately satisfied. In Fig. 1(c) we show the distribution after an additional selection requiring where the upstream momentum . The endpoint position becomes better defined when this additional requirement is applied, but at the cost of a factor of in number of events, and even then the residual backgrounds are still not negligible (given the precision in the endpoint position that is required).
To investigate the effect of the Standard Model background on the precision with which can be determined we parameterised separately the signal s and the background b distributions from Fig. 1(c) by two-part piecewise Gaussian functions,
Even with a high cross section SUSY model (such as the SPS1a point shown) and assuming perfect knowledge of the shape of the backgrounds555Only the signal peak position and the normalisations of the signal and background are allowed to vary in the fit., a significant increase in the statistical uncertainty is found when the backgrounds are introduced. We also investigated the case when the SUSY cross-section is a fraction of that shown. For the statistical precision on was {(,), (,), } GeV for the cases of: original cross-section without and with backgrounds included, half of the original cross-section without and with backgrounds included, and a quarter of the original cross-section without and with backgrounds included respectively. Uncertainties in the shape of the background contribution will further increase the detrimental effect of the backgrounds.
These difficulties with the constransverse mass variable are not shared by other variables which have previously been proposed for mass measurement. For illustration we compare to distributions of two previously proposed variables. The first comparison is against the stransverse mass Lester and Summers (1999); Barr et al. (2003), which is defined by666 For the transverse mass is (8) Note the negative sign before the inner two-vector product which distinguishes from the contransverse mass defined in (3).
| (9) |
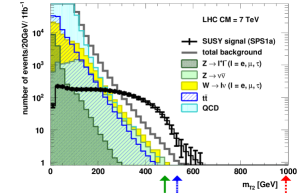
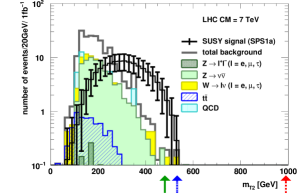
In Fig. 1(d) we show a distribution the distribution after applying the same basic dijet cuts used for Fig. 1(a). The end-point of distribution is also dependent on the physical quantity , and under the condition (4),
| (10) |
so the comparison is suitable. From the illustrative arrows it is clear that the end-point of the distribution is much more sensitive to the parent particle mass and that this end-point is in a region where Standard Model backgrounds are suppressed.
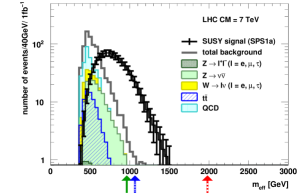
In Fig. 1(e) we show the distribution of another well-established SUSY mass-scale variable: the effective mass Hinchliffe et al. (1997),
| (11) |
where in this paper the sum is over the two jets with the largest transverse momenta. Since heavy particles are produced near threshold, the effective mass Tovey (2001) is expected to have an endpoint around
| (12) |
It can be seen from Fig. 1(e) that in contrast to , the endpoint is at a value for which the Standard Model background is small and that its characteristic value changes rapidly as a function of .
Even after the cut designed to improve the peaked nature of the endpoint the distribution shows more promise for the signal point investigated (Fig. 1(f)).
In conclusion, while it is true that the sharply peaked nature of the signal in the distribution may lead to lower systematic errors in the fitting procedure, there are large backgrounds from Standard Model processes which also peak near this region. These backgrounds together with the weak dependence of the peak position on the physical parameter suggest that mass measurement using this variable will be difficult. We suggest that for the decay process studied here, other existing mass measurement variables show more promising characteristics for SUSY mass measurement.
References
- Cho et al. [2009] Won Sang Cho, Jihn E. Kim, and Ji-Hun Kim. Amplification of endpoint structure for new particle mass measurement at the LHC. 2009.
- Evans and Bryant [2008] Lyndon Evans, (ed. ) and Philip Bryant, (ed. ). LHC Machine. JINST, 3:S08001, 2008. doi: 10.1088/1748-0221/3/08/S08001.
- Barr and Lester [2010] Alan J Barr and Christopher G Lester. A Review of the Mass Measurement Techniques proposed for the Large Hadron Collider. 2010.
- Lester and Summers [1999] C. G. Lester and D. J. Summers. Measuring masses of semiinvisibly decaying particles pair produced at hadron colliders. Phys. Lett., B463:99–103, 1999. doi: 10.1016/S0370-2693(99)00945-4.
- Barr et al. [2003] Alan Barr, Christopher Lester, and P. Stephens. : The truth behind the glamour. J. Phys., G29:2343–2363, 2003. doi: 10.1088/0954-3899/29/10/304.
- Tovey [2008] Daniel R. Tovey. On measuring the masses of pair-produced semi-invisibly decaying particles at hadron colliders. JHEP, 04:034, 2008. doi: 10.1088/1126-6708/2008/04/034.
- Barr and Gwenlan [2009] Alan J. Barr and Claire Gwenlan. The race for supersymmetry: using for discovery. Phys. Rev., D80:074007, 2009. doi: 10.1103/PhysRevD.80.074007.
- Bahr et al. [2008b] M. Bahr et al. Herwig++ 2.3 Release Note. 2008b.
- Bahr et al. [2008a] M. Bahr et al. Herwig++ Physics and Manual. Eur. Phys. J., C58:639–707, 2008a. doi: 10.1140/epjc/s10052-008-0798-9.
- Allanach et al. [2002] B. C. Allanach et al. The Snowmass points and slopes: Benchmarks for SUSY searches. Eur. Phys. J., C25:113–123, 2002. doi: 10.1007/s10052-002-0949-3.
- Porod [2003] Werner Porod. SPheno, a program for calculating supersymmetric spectra, SUSY particle decays and SUSY particle production at colliders. Comput. Phys. Commun., 153:275–315, 2003. doi: 10.1016/S0010-4655(03)00222-4.
- Collaboration [2009] The ATLAS Collaboration. Prospects for supersymmetry and univeral extra dimensions discovery based on inclusive searches at a 10 TeV centre-of-mass energy with the ATLAS detector. Technical Report ATL-PHYS-PUB-2009-084. ATL-COM-PHYS-2009-342, CERN, Geneva, Jul 2009.
- Hinchliffe et al. [1997] I. Hinchliffe, F. E. Paige, M. D. Shapiro, J. Soderqvist, and W. Yao. Precision SUSY measurements at CERN LHC. Phys. Rev., D55:5520–5540, 1997. doi: 10.1103/PhysRevD.55.5520.
- Tovey [2001] D. R. Tovey. Measuring the SUSY mass scale at the LHC. Phys. Lett., B498:1–10, 2001. doi: 10.1016/S0370-2693(00)01363-0.