Microwave lens for polar molecules
Abstract
We here report on the implementation of a microwave lens for neutral polar molecules suitable to focus molecules both in low-field-seeking and in high-field-seeking states. By using the TE11m modes of a 12 cm long cylindrically symmetric microwave resonator, Stark-decelerated ammonia molecules are transversally confined. We investigate the focusing properties of this microwave lens as a function of the molecules’ velocity, the detuning of the microwave frequency from the molecular resonance frequency, and the microwave power. Such a microwave lens can be seen as a first important step towards further microwave devices, such as decelerators and traps.
pacs:
37.20.+j, 37.10.Mn, 33.20.BxSince the early 1920s, external electric and magnetic fields have been used in ever more sophisticated setups to gain increasing control over the molecules’ degrees of freedom. As a first step, both an electric and a magnetic deflector have been realized Wrede (1927); Stern (1922), which allowed to select single quantum states to perform ground-breaking new experiments. In the mid fifties, the implementation of an electrostatic quadrupole lens allowed Townes and coworkers to demonstrate the MASER by exploiting the different focusing properties of the inversion doublet levels of the vibronic ground state of ammonia Gordon et al. (1954, 1955). By now, it has become possible to decelerate and trap neutral molecules in the gas phase using switched electric or magnetic fields, enabling novel experiments in the field of cold molecules van de Meerakker et al. (2008); Bell and Softley (2009); Schnell and Meijer (2009).
Besides external electric and magnetic fields, also electromagnetic radiation, such as microwave and optical fields, can be used to manipulate the motion of molecules. For example, an optical decelerator has been implemented Barker and Shneider (2002); Fulton et al. (2006). Optical dipole traps are widespread in the field of cold atoms Grimm et al. (1999).
In 1975, Hill and Gallagher implemented a deflector based on a rectangular microwave resonator Hill and Gallagher (1975), the simplest molecule-manipulation device using microwave radiation. They detected the deflection of a beam of CsF molecules, but their experimental results could not be fully understood and they did not pursue these experiments.
In this Letter, we demonstrate and characterize a microwave lens for polar molecules, which allows us to focus polar molecules using microwave radiation. A packet of supersonically expanded ammonia molecules (14NH3) is decelerated to low velocities of around 20 m/s using a Stark decelerator. Upon leaving the decelerator, they enter a cylindrically symmetric microwave resonator. The applied microwave field prevents the molecules from spreading out in transverse directions, i.e., it acts like a positive lens on polar molecules. For this, we exploit the same inversion transition as Townes and coworkers used in their original MASER experiments.
The force exerted on a molecule in microwave fields depends on its dipole moment, the sign and the magnitude of the detuning of the microwave frequency from the molecular resonance frequency, and the microwave field strength. High input powers and high-Q cavities are available, so that, in principle, large field strengths can be achieved. Furthermore, in contrast to optical fields, very small detunings can be exploited due to the long lifetime of the states coupled in the microwave transition. Such small detunings in turn lead to strong interaction forces. In addition, for microwave manipulation the direction of the interaction force (AC Stark effect Autler and Townes (1955)) depends on the sign of the detuning. By choosing the corresponding detuning, both molecules in low-field-seeking and in high-field-seeking states can be affected. This is particularly advantageous for large molecules and molecules in their internal ground state, which are always high-field seeking in DC electric fields. To focus, decelerate and trap them using electric fields, dynamic focusing has to be applied Bethlem et al. (2002a); van Veldhoven et al. (2005), which leads to stringent experimental demands. Here, microwave fields could be a promising alternative. The microwave lens demonstrated in this work can be seen as an important step towards the realization of microwave deceleration and trapping devices, which have been suggested recently DeMille et al. (2004); Enomoto and Momose (2005).
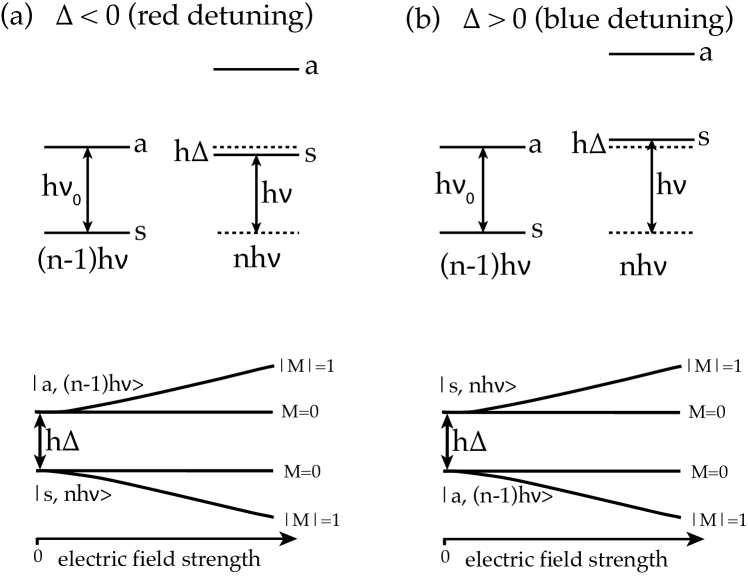
The interaction energy of polar molecules with microwave radiation is based on the AC Stark effect. For ammonia, the energy of the inversion doublet levels as a function of the microwave field strength (Figure 1) can be written to a good approximation as:
| (1) |
with the molecular dipole moment , the total angular momentum quantum number and the projections of the total angular momentum onto the molecular symmetry axis, , and the electric field axis, , respectively. is the so-called detuning defined as the difference of the applied microwave frequency from the molecular resonance frequency MHz (inversion transition of the level of the vibronic ground state of 14NH3) and is Planck’s constant. is the electric field strength of the microwave field, as defined below. Its maximum value is given by Grabow et al. (2005). Here, is the quality factor of the resonator, and is a geometrical factor which can be approximated by for TE11m modes (vide infra) in a cylindrically symmetric resonator, with being the resonator volume. is the microwave power coupled into the resonator and the permittivity of free space. Consequently, the focusing force in a microwave lens depends on the molecular dipole moment , the resonator properties and , the microwave power , and the sign and the magnitude of the detuning .
While the magnitude of determines the strength, its sign defines the direction of the focusing force, i.e., it determines whether a particular molecular state is attracted by a field maximum or a field minimum (eq. 1). This is schematically displayed in Fig. 1 for the antisymmetric (a) upper (low-field seeking in DC electric fields) and the symmetric (s) lower energy levels (high-field seeking in DC electric fields) of the inversion doublet of 14NH3 molecules (see, for example, ref. Bethlem et al. (2002b)). In the dressed-state picture, the molecular energy levels are ”dressed” with the number of photons . This way, the s state dressed with photons can come close to the a state with photons, resulting in a strong interaction. For small detunings, this leads to a linearization of the AC Stark energy. While for red detuning () the a state is low-field seeking, it becomes high-field seeking for blue detuning (). Consequently, by simply changing the sign of the detuning a particular state can be either high-field or low-field seeking in microwave fields. This property can be exploited for various applications, such as the manipulation of larger and more complex molecules. Here, we Stark decelerate 14NH3 molecules in the a state, which is low-field seeking in DC electric fields. Subsequently, we can conveniently focus these molecules using blue detuned microwave radiation without having to transfer the molecules to a different state. Although such transfer can be performed in principle, it is accompanied by significant losses, as the population is distributed over a large number of hyperfine levels van Veldhoven et al. (2005).
The experimental setup is schematically shown in Fig. 2(a). A detailed description of the molecular beam machine and in particular of the deceleration of a beam of ammonia molecules is given elsewhere Bethlem et al. (2002b). The 120 mm long microwave resonator is made of copper and its entrance is located about 2.5 mm behind the end of the decelerator. It has an inner radius of 3.705 mm. The resonator is closed by two endcaps with 3 mm holes to allow the molecules to fly through. The microwave radiation is coupled into the resonator using a dipole antenna of 5 mm length and 0.4 mm diameter, which is oriented along the y direction. The electric field component of the microwave field propagates parallel to the antenna, i.e., the electric field is linearly polarized perpendicular to the resonator axis (TE mode). In the experiment, we use TE11m modes for focusing ammonia molecules. Here, 1,1, denote the number of maxima in radial (), azimuthal (), and longitudinal (z) direction, respectively. Since the antenna is located at half the length of the resonator, TE11m modes with odd , which have an electric field maximum at this position, are strongly perturbed. Here, we use the TE112 mode (=+71 MHz) and the TE114 mode (=+459 MHz) to confine the transverse motion of ammonia molecules. For these modes, is about 5000 Lamont (1950).
The distribution of the electric field strength (mode pattern) for TE11m modes in cylindrical coordinates can be calculated using
| (2) |
with giving the field distribution Jackson (1998):
| (3) |
Here, is the Bessel function of first order, mm is the length of the resonator. is defined as , with =1.841 being the first root of the derivative of (for TE11m modes) and =3.705 mm being the radius of the resonator.
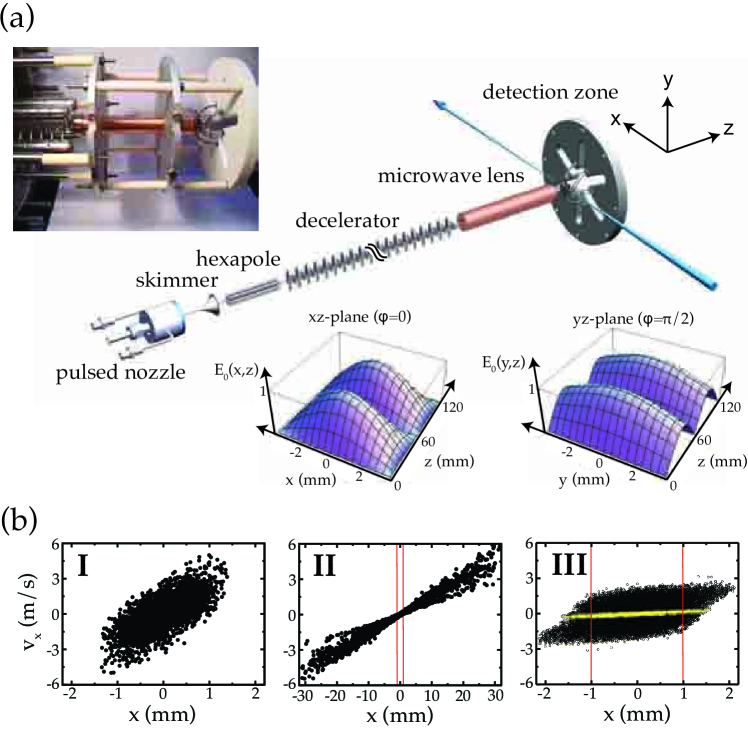
In the inset of Fig. 2(a), the calculated electric field strength is shown for the TE112 mode for two perpendicular planes; for and for . The electric field distribution of the TE112 mode exhibits an electric field maximum on the resonator axis z, which decreases towards the resonator walls in transverse directions. Consequently, molecules in AC high-field-seeking states are transversally focused towards the resonator axis . Note that the electric field distribution is not cylindrically symmetric, which leads to different gradients and thus different focusing strengths for the two transverse directions and .
In the experiment, decelerated packets of NH3 molecules leave the decelerator in the a state of the inversion doublet with a mean longitudinal velocity of, typically, 20 m/s, and with a full width at half maximum (FWHM) velocity spread of about 10 m/s. The transverse velocity distribution (FWHM) is about 5 m/s. The decelerated packet leaving the decelerator contains approximately 106 molecules and has a full spatial extent of about 2 mm along all directions.
While proceeding to the entrance of the microwave resonator in free flight, the decelerated packet spreads out in all directions (Fig. 2(b), I). If no microwave resonator would be integrated into the setup, the molecules would have to proceed another 128.5 mm of free flight to the detection region, where they are state-selectively detected using a laser-based ionization detection scheme. The laser beam with a waist of about 100 m is oriented parallel to the x axis. In the x direction, the ion extraction setup limits the detection region to about 2 mm. During this free flight, the packet of molecules spreads out dramatically (Fig. 2(b), II), so that only a small fraction of molecules would still be detected. However, for the setup with microwave resonator, the molecular cloud is ’skimmed’ by the entrance and exit holes of the resonator (yellow circles in Fig. 2(b), III): only the molecules with very low transverse velocities are able to pass. If the microwave field is turned on with W coupled into the resonator, the packet of slow ammonia molecules is kept together in transverse directions (Fig. 2(b), III, black circles). The maximum accepted transverse velocity of our microwave lens for 3.5 W is about m/s in direction and about m/s in direction. The microwave field is turned on as long as the decelerated packet is in the resonator, i.e., for focusing molecules with =20 m/s, the microwave field is on for 6 ms. Note that in the deceleration process of ammonia as applied here, three decelerated packets which are trailing each other by 11 mm are emitted from the Stark decelerator Heiner et al. (2006). While flying through the microwave resonator, these three packets will merge.
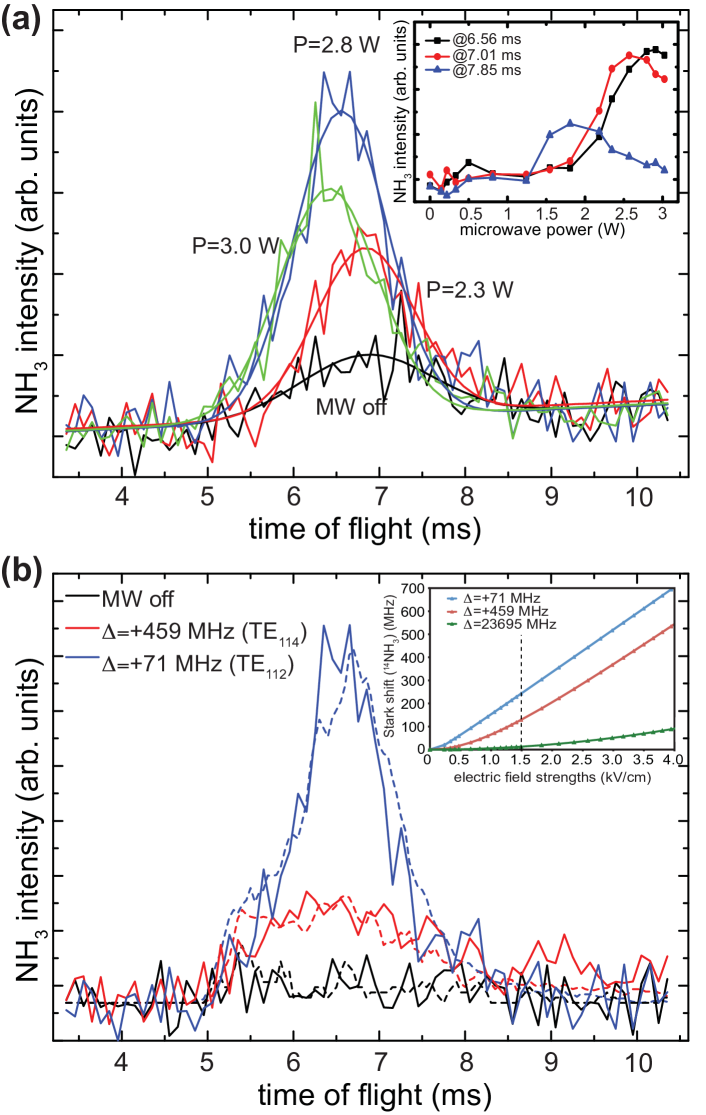
Figure 3 shows the experimental results for focusing ammonia molecules in their state. Fig. 3(a) displays time-of-flight measurements for 14NH3 molecules decelerated to =20 m/s for different microwave powers , along with Gaussian fits to the observed signal curves. At , the decelerated packet leaves the decelerator, i.e., the high voltages at the decelerator are turned off. The signal intensity is increased by about a factor of 8 due to microwave focusing. Furthermore, for increasing power, higher velocities are focused best: compared to the measurements for 2.3 W (=1.33 kV/cm), the maxima of the time-of-flight measurements are shifted to earlier arrival times, and thus higher values, by 0.28 ms for 2.8 W (=1.47 kV/cm) and by 0.43 ms for 3.0 W (=1.52 kV/cm). The highest power of 3.0 W causes overfocusing for the most abundant velocity in the initial velocity distribution, resulting in a reduced signal intensity compared to 2.8 W.
Both the shape of the curves as well as the position of the maxima are reproduced well by Monte Carlo trajectory simulations (see also Figure 3(b), dashed curves). However, the intensity increase due to microwave focusing is predicted to be about one order of magnitude larger than experimentally observed. This is a strong indication for significant losses in the experiment. One major loss channel might be nonadiabatic transitions Kirste et al. (2009) to states in the low-field regions close to the electric field nodes at the beginning, center and end of the resonator. One possible way to reduce these losses would be to use the TE111 mode with only one maximum along the longitudinal axis.
The inset of Fig. 3(a) shows the dependence of the observed signal on the microwave power . The three measurements shown have been performed for different detection times (6.56 ms, 7.01 ms, and 7.85 ms). For all curves, a steep increase in signal intensity is found with increasing microwave power. For the measurements taken at 7.01 ms, a clear maximum is obtained at around 2.5 W. For higher microwave power, overfocusing is observed. For a later detection time (7.85 ms) corresponding to slower molecules, the maximum is clearly shifted to lower power (1.8 W), while for an earlier detection time (6.56 ms) and thus faster molecules, it is shifted to higher values (around 3 W).
In Fig. 3(b), time-of-flight measurements for =20 m/s slow 14NH3 molecules using a constant microwave power of 2.8 W (=1.47 kV/cm), but two different detunings are shown. The solid curves are measurements, while the dashed curves correspond to trajectory simulations, which agree well with the experimental results. In the experiment, the signal increase due to focusing amounts to only about a factor of 2 for the TE114 mode compared to a factor of 8 for the TE112 mode. This can be explained with a higher probability of nonadiabatic transitions for the TE114 mode due to the larger number of low-field regions, and the smaller focusing force for =+459 MHz compared to =+71 MHz due to the smaller slope of the Stark shift; 141 MHz/(kV/cm) and 182 MHz/(kV/cm) at 1.5 kV/cm, respectively (inset of Fig. 3(b)). Note that for the corresponding DC Stark effect the slope of the Stark energy at 1.5 kV/cm is one order of magnitude smaller (17 MHz/(kV/cm)).
In summary, we have focused ammonia molecules using a novel microwave lens. The focusing force depends on the particular state, the molecular dipole moment, the sign and magnitude of the detuning of the applied microwave frequency from the molecular resonance frequency, and the microwave field strength. Such a microwave lens can be seen as a first important step towards further manipulation devices based on microwave radiation, such as a microwave decelerator and trap. Microwave manipulation is a promising route to gain complete control over larger and more complex molecules.
Acknowledgements.
The authors thank Jens-Uwe Grabow, John M. Doyle, Jochen Küpper and Boris G. Sartakov for valuable scientific discussions and Henrik Haak for technical support. H.O. thanks Meiji University for granting him a sabbatical leave at FHI. M.S. acknowledges a Liebig grant from the Fonds der Chemischen Industrie.∗corresponding author: schnell@fhi-berlin.mpg.de
References
- Wrede (1927) E. Wrede, Z. Phys. 44, 261 (1927).
- Stern (1922) O. Stern, Physikalische Zeitschrift 23, 476 (1922).
- Gordon et al. (1954) J. P. Gordon, H. J. Zeiger, and C. H. Townes, Phys. Rev. 95, 282 (1954).
- Gordon et al. (1955) J. P. Gordon, H. J. Zeiger, and C. H. Townes, Phys. Rev. 99, 1264 (1955).
- van de Meerakker et al. (2008) S. Y. T. van de Meerakker, H. L. Bethlem, and G. Meijer, Nature Phys. 4, 595 (2008).
- Bell and Softley (2009) M. Bell and T. Softley, Mol. Phys. 107, 99 (2009).
- Schnell and Meijer (2009) M. Schnell and G. Meijer, Angew. Chem. Int. Ed. 48, 6010 (2009).
- Barker and Shneider (2002) P. F. Barker and M. N. Shneider, Phys. Rev. A 66, 065402 (2002).
- Fulton et al. (2006) R. Fulton, et al., Nature Phys. 2, 465 (2006).
- Grimm et al. (1999) R. Grimm, M. Weidemüller, and Y. Ovchinnikov, Adv. Atom. Mol. Opt. Phys. 42, 95 (1999).
- Hill and Gallagher (1975) R. Hill and T. Gallagher, Phys. Rev. A 12, 451 (1975).
- Autler and Townes (1955) S. Autler and C. Townes, Phys. Rev. 100, 703 (1955).
- Bethlem et al. (2002a) H. L. Bethlem, et al., Phys. Rev. Lett. 88, 133003 (2002a).
- van Veldhoven et al. (2005) J. van Veldhoven, H. L. Bethlem, and G. Meijer, Phys. Rev. Lett. 94, 083001 (2005).
- DeMille et al. (2004) D. DeMille, D. R. Glenn, and J. Petricka, Eur. Phys. J. D 31, 375 (2004).
- Enomoto and Momose (2005) K. Enomoto and T. Momose, Phys. Rev. A 72, 061403 (2005).
- Grabow et al. (2005) J. U. Grabow, et al., Rev. Sci. Instrum. 76, 093106 (2005).
- Bethlem et al. (2002b) H. L. Bethlem, et al., Phys. Rev. A 65, 053416 (2002b).
- Lamont (1950) H. Lamont, Methuen’s Monographs on Physical Subjects: Wave guides (Methuen Co. Ltd., 1950), 3rd ed.
- Jackson (1998) J. D. Jackson, Classical electrodynamics (John Wiley & Sons, New York, 1998), 3rd ed.
- Heiner et al. (2006) C. E. Heiner, H. L. Bethlem, and G. Meijer, Phys. Chem. Chem. Phys. 8, 2666 (2006).
- Kirste et al. (2009) M. Kirste, et al., Phys. Rev. A 79, 051401(R) (2009).