Brorfelde Schmidt CCD Catalog (BSCC)
Abstract
The Brorfelde Schmidt CCD Catalog (BSCC) contains about 13.7 million stars, north of Declination with precise positions and V, R photometry. The catalog has been constructed from the reductions of 18,667 CCD frames observed with the Brorfelde Schmidt Telescope between 2000 and 2007. The Tycho-2 catalog was used for astrometric and photometric reference stars. Errors of individual positions are about 20 to 200 mas for stars in the R = 10 to 18 mag range. External comparisons with 2MASS and SDSS reveal possible small systematic errors in the BSCC of up to about 30 mas. The catalog is supplemented with J, H, and Ks magnitudes from the 2MASS catalog.
1 INTRODUCTION
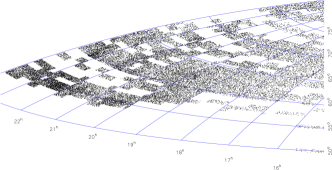
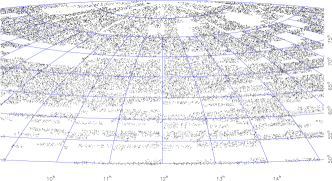
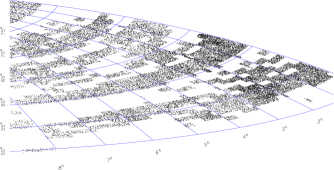
The Brorfelde Schmidt telescope (Andersen & Clausen, 1974) was used with a 2k by 2k charge-coupled device (CCD) camera (Florentin-Nielsen & Jørgensen, 1995) to observe the sky from to declination, with additional observations taken in selected fields north of . The main idea of the project was to supplement the Carlsberg Meridian Circle Catalog (CMC14) (Copenhagen Univ., IoA & RIOA, 2006), which covers the to declination area. However, the resulting Brorfelde Schmidt CCD Catalog (BSCC) does not have a complete sky coverage north of , with about 30% of that area not observed. The sky coverage of the BSCC is shown in Figure 1. This catalog will be very valuable for determination of highly accurate proper motions of faint stars when combining with future data, as for example the upcoming USNO Robotic Telescope (URAT) survey (Zacharias, 2008) and for assisting in systematic error analysis of existing catalogs like the UCAC3 (Zacharias et al., 2010) and PPMXL Roeser et al. (2010).
The CCD data were obtained during the period of 2000 to 2007 and all applicable 18,667 object CCD frames together with additional calibration frames were sent to the U.S. Naval Observatory (USNO) in 2009 for processing. The USNO CCD Astrograph Catalog (UCAC) project Zacharias et al. (2010) reduction pipeline (Zacharias, 2010) was modified and used for this project. A catalog of 13.7 million stars for the magnitude range R = 10 to 18 has been constructed with precise positions on the International Celestial Reference System (ICRS) by use of the Tycho-2 (Høg et al., 2000) reference star catalog.
Photometry in V and R has been obtained for most of these stars from the CCD data, with Two-micron All Sky Survey (2MASS) near-infrared photometry added to the catalog (Skrutskie, Cutri, Stiening et al., 2006). The filters used at the Brorfelde Schmidt for this project are approximating the standard Johnson V and Cousin R filters.
Details about the data acquisition and astrometric and photometric reductions are presented here, followed by a description of the resulting catalog. External comparisons were performed with the Sloan Digital Sky Survey (SDSS) release 7 data (www.sdss.org/DR7/) and the 2MASS point source catalog (www.ipac.caltech.edu/2mass). The BSCC is available from the Strasbourg Data Center (CDS).
2 OBSERVATIONS
The observations were performed during 328 nights between 2000 February 13 and 2007 September 6 at the (now closed) 50/77 cm Brorfelde Schmidt Telescope belonging to Copenhagen University. It is located at 55∘ 37’ 31” N, 11∘ 39’ 59” E. Its focal length, 150 cm, and thereby its focal plane scale of 137 arcsec/mm was chosen to match the typical atmospheric seeing in Brorfelde of 2 arcsec and match the resolution of available photographic emulsions.
Since 1999, the telescope has been equipped with a 2048x2048 thick, front side illuminated Kodak KAF-4201 CCD, which is cooled by a three-stage Peltier element, which again is water cooled (Florentin-Nielsen & Jørgensen, 1995). The pixel size of 9 microns yields a scale of 1.24 arcsec/pixel and a field size of 42x42 arcmin.
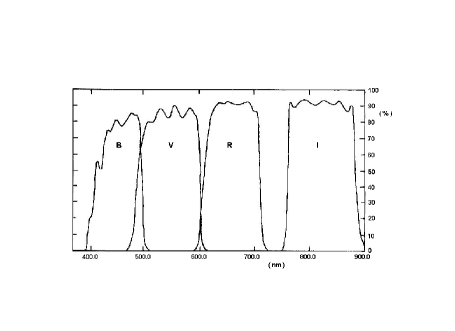
For the present project, exposures were obtained through B, V, R, and I filters, respectively, with transmission curves shown in Figure 2. Exposure times were 60 to 600 sec (B), 10 to 600 sec (V,R), and 90 to 600 sec (I), with the majority of data being 90 sec V and R images. All exposures were taken close to the meridian with maximum deviations of and , respectively. Bias and dark exposures were taken each night, and dome flat exposures were secured at regular intervals during daytime.
3 DATA REDUCTION
All data reduction was performed in the Cataloging Division of the U.S. Naval Observatory, using DS9 and IRAF for manual investigation of FITS CCD frames and custom Fortran software for all pipeline processing, based on the code used for the UCAC project.
3.1 Pixel Data Processing
Without assuming metadata to be correct, all available CCD data FITS files were read with custom utility code to derive statistics about pixel value histograms and to retrieve header information. Visual inspection of the resulting output tables showed that in most cases the first bias frame taken at the beginning of each night displays a large number of bright pixels. All first images of any given night were thus excluded from the following processing. Depending on the statistical properties of the CCD frames they were identified and grouped into bias, darks, flat, and science object files. A total of 25,190 CCD frames were provided by Copenhagen University, of which 2,884 were identified as bias, 2,245 as dark, 271 as flat, and 18,926 as science frames. A total of 60 frames failed the automated classification and manual inspection revealed overexposed flats, which were disregarded. The 804 binned data frames were also not processed.
Dark frames were utilized to identify “bad” pixels which were flagged and excluded from further processing. For each standard exposure time combined darks were derived. For exposure times which were not used often a single master dark was calculated from all available dark frames of that exposure time. For the 20, 25, and 60 second exposures, master darks by observing year were generated, while for the most often used 90 second exposures a combined dark per month of observing was established. A single bias-offset value per individual dark frame (added to all pixels of a frame; a different value for different frames) was applied to bring all frames to the same bias level value before combining. However, individual frames were not corrected for bias frame subtraction because the bias level structure was found to be well corrected with applying combined darks.
A combined, master flat file was created for each filter and each year of observing from the available dome flat data, excluding overexposed frames. The appropriate master dark frames were subtracted from the flats before combining. Individual flat frames were normalized, low/high pixel values excluded, and the mean taken over the remaining values for each pixel to arrive at a combined flat.
All combined flats were analyzed to identify outlier pixel values and largely variable pixels. Those were added to the “bad pixel” map and not used in the astrometric and photometric reductions of stellar images.
3.2 Astrometric Reductions
Science frames were grouped by filter and reduced separately. Tycho-2 reference stars were identified in the data and weighted, least-squares, conventional “plate” adjustments (CPA) run on all applicable frames. A total of 127 I, 9350 R, 9115 V, and 75 B filter frames provided successful solutions (18,667 CCD frames all together). Of these, a total of 1,888 CCD frames are outside the to area which constitutes the published catalog data, thus 16,779 CCD frames were used for the BSCC. The number of reference stars used per CCD frame is shown in the histogram of Fig. 3. There are 427 frames with 9 or less reference stars in the area north of , while the typical number of Tycho-2 reference stars used per frame is about 12 to 35, with a few frames up to about 100.
A linear plate model (6 parameters) was adopted without correcting for differential refraction or aberration. Also no third order geometric distortion was pre-applied, which is inherent in Schmidt telescope imaging (curved focal plane and tangential projected ). These procedures are adequate due to the small field of view and the presence of other distortions for example from the filters. However, the combined effect of all geometric distortions is determined empirically as follows, and has been corrected.
A total of 312,522 and 292,957 residuals (with 2 coordinates each) were available from the astrometric reductions of all R and V filter observations, respectively. The residuals were stacked up in bins as function of focal plane coordinates and slightly smoothed by weighted average with neighboring bins. The resulting field distortion patterns (FDP) are shown in Fig. 4. Linear interpolation between the bins were performed to arrive at the FDP correction values which were applied to the data prior to the following iteration of the CPA reduction.
Residuals of the final CPA reductions were plotted as a function of coordinate, radial distance from the frame center, magnitude, color, and coma term (product of magnitude and coordinate). The largest systematic errors, up to about 20 mas, were found as a function of magnitude (Figs. 5, 6), with root-mean-square (RMS) scatter shown in Fig. 7. For most of these 90 sec exposures in the survey saturation is around R=10 preventing from reaching even smaller positional errors at the bright end. Errors for stars fainter than 10th magnitude are dominated by the reference star contribution. A complex, non-linear dependence for the coordinate (declination) as a function of coma-x and coma-y is found (not shown) with amplitudes up to 20 mas. These systematic errors are at the limit of the reference star catalog at the epoch of the CCD observations. No further investigation was performed and no attempt to correct the derived star positions for any such magnitude dependent systematic errors was made.
The final catalog positions are obtained from a weighted mean of all individual observations for each star. Objects matching within 2.0 arcsec are assumed to be the same star. Thus the positions provided in this observational catalog are based on the mean of the V and R band observations, given at mean epoch of observation, on the ICRS, as represented by the Tycho-2 catalog.
3.3 Photometric Reductions
Differential photometric reductions were performed with respect to Tycho-2 standards on individual CCD frames. Instrumental magnitudes were derived from the integral (volume) of the fitted stellar image profiles above the local background using the modified UCAC reduction pipeline while performing the astrometric pixel reduction step. In the following, only Tycho-2 stars with “good” photometry flag, brighter than V = 12.5, and not saturated on CCD frames were used. Furthermore, stars with (BV) 0.2 and (BV) 1.5 were excluded and stars in the (BV) range of 1.1 to 1.5 were used with reduced weight.
A magnitude zero-point () per V-band CCD frame was fitted to transform the instrumental magnitudes () into standard V magnitudes (), using Tycho-2 references for in a weighted least-squares adjustment according to
.
Similarly,
was determined using B and V magnitudes from Tycho-2 as standards with the approximation
The color slope term, , was derived from linear fits to sample CCD data with many reference stars and solving for both the slope and constant term. The average resulting slope term was adopted and used to solve only for the photometric zero-point constant in all R-band CCD frames.
Fig. 8 shows the distribution of the standard error of this photometric constant. For most frames this error is 20 to 40 millimag. The absolute photometric error of stars in the BSCC has to be larger than this photometric constant error, while the internal, photometric precision is better for well exposed stars.
4 RESULTS AND EXTERNAL COMPARISONS
4.1 The Catalog
The BSCC contains 13,771,775 stars north of declination and is sorted by declination. Of these, 13,157,292 do have a match with a 2MASS star within 2 arcsec, and J, H, Ks photometry with errors were copied from the 2MASS into BSCC. Stars based on a single CCD observation and not matched with 2MASS did not enter the released catalog. Fig. 9 shows the distribution of stars in the BSCC by R and V magnitude. Completeness is expected up to about R = 17.5 with a limiting magnitude of about R = 19. There are 583,043 stars in the catalog without R magnitude, and 4,311,081 do not have a V magnitude.
The BSCC data file is 1.7 GB, formatted, ASCII. Some sample lines are listed in Table 1, with the data format explained in Table 2. This is an observational catalog of mean positions at a mean epoch, which is slightly different for each star. The positions are on the International Celestial Reference System (ICRS) by means of the Tycho-2 reference star catalog. There are no proper motions provided. Stars are identified by the IAU registered acronym ”BSCC”, followed by a fixed-length, 8-digit running record number without a space.
Fig. 10 shows the mean astrometric errors (per coordinate) of the BSCC as a function of R magnitude. The filled circles show the errors as derived from the model (including fit precision and expected contribution from the “plate” adjustment solution), while the open squares show the error from the observed scatter of individual positions. These are small number statistics for individual stars (with typically 2 to 4 images) but become meaningful when averaged over many stars (for the R 9 range). Many stars in the 10 to 15 mag range have internal errors of about 20 mas in Dec and about 25 mas in RA. A near saturation effect seems to be present for stars brighter than R = 11 mag showing a slightly larger, observed, scatter error than at R = 11 mag.
Fig. 11 shows the formal, photometric errors in the BSCC R and V magnitudes derived from the scatter of individual magnitudes. Data shown for stars brighter than about 9th mag are affected by small number statistics. Systematic errors are not included here. The precision of the photometry is on the 3 to 5 % level for the 10 to 15 mag range, then increasing according to the lower signal-to-noise ratio to about 0.15 mag at R = 18.
4.2 Astrometric Comparisons
Unweighted position differences of BSCC minus Tycho-2, averaged over 100 stars per dot are shown in Fig. 12 as a function of magnitude. Tycho-2 proper motions have been applied to bring the positions to the epoch of individual BSCC stars. The small overall offset in declination is caused by the weighted adjustment in the CCD reductions of individual frames combined with the magnitude dependent pattern shown in Fig. 6. The differences in RA average to about zero, as expected.
Position differences of BSCC with respect to 2MASS are shown in Fig. 13. No proper motions have been applied because neither the 2MASS nor the BSCC do have proper motions. The epoch difference between individual BSCC and 2MASS observations of a star is within 3 years. Over 11 million stars were matched. There is a small systematic difference along RA increasing toward faint stars reaching about 30 mas at R=18, while for Dec there is a remarkable consistency between the BSCC and 2MASS data with only about 10 mas differences at the very faint end at R=18 and systematic differences less than about 5 mas for the entire magnitude range of R = 10 to 17.
Fig. 14 shows the position differences BSCC2MASS as a function of declination. CCD frame size patterns are clearly seen with systematic position differences of up to about 50 mas. Some of this is caused by not having proper motions applied. The break at is explained by the mean epoch of BSCC observations (Fig. 15). Data for were observed, on average, at a much later epoch than the other data, resulting in a larger epoch difference to 2MASS data. This in turn gives larger position differences because no proper motions are applied. The data for were observed at a mid-range epoch, leading also to an increased scatter in the position differences as compared to data between and . Fig. 16 shows the BSCC2MASS position differences as a function of right ascension. The average offset for the RA component is a result from the magnitude equation seen earlier (Fig. 13). In addition, a sine wave pattern of about 20 mas amplitude is present in either coordinate. This could be caused by galactic dynamics due to the lack of proper motions in this comparison.
A representative subset of the Sloan Digital Sky Survey (SDSS) release 7 data (Abazajian et al., 2009), (Munn et al., 2004) was selected (, ). A match with BSCC resulted in 49,692 common stars and SDSS proper motions were applied. The position differences BSCCSDSS are shown in Figs. 17 and 18 as functions of magnitude and color, respectively. The RA coordinate shows a small magnitude equation, about 5 mas/mag, similar to the BSCC2MASS differences (Fig. 13), for the 14 to 18 mag range. The Dec coordinate displays a constant offset of about 10 mas over that magnitude range. There is no dependence of the BSCCSDSS position differences as a function of color, except for the average offset mentioned before.
Fig. 19 shows the position differences BSCCCMC14 as a function of R magnitude. No proper motions were applied and the epoch difference is only a few years. Note that the overlap between these 2 catalogs is very small, involving only 194 CCD frames taken at declination in the RA = 8 to 16 hour range with 20,596 stars in common. Fig. 20 shows the BSCC2MASS position differences for the same area in the sky as used for the CMC14 comparison, which is significantly different than the average BSCC2MASS differences of Fig. 12. Stars with position differences over 300 mas in either coordinate were excluded for this comparison. For the RA component, CMC14 agrees with 2MASS but both are offset with respect to BSCC by about mas. For the Dec component, BSCC agrees with 2MASS but CMC14 is offset by about +30 mas with respect to the other 2 catalogs.
4.3 Photometric Comparisons
Fig. 21 shows the difference in BSCC R minus CMC14 r magnitude as a function of CMC14 r magnitude. A narrow distribution is seen with systematic differences in the range of about 0.1 mag. Fig. 22 shows the color-color diagram between the BSCC V, R and SDSS g and r bandpasses. The BSCC R band magnitudes match the SDSS r magnitudes very well for (gr) colors between 0.2 and 1.0, with significant systematic differences for redder stars. The BSCC V and SDSS g magnitudes are significantly different (up to 0.4 mag) for all colors, as expected.
5 DISCUSSION
Considering the low resolution (1.24 arcsec/pixel) of the Brorfelde Schmidt survey data the catalog is amazingly accurate, with repeatability of observations (from overlapping fields) of about 20 mas per coordinate for well exposed stars. Systematic errors in observed star positions are also small, on the 30 mas level or below, with particularly well controlled systematic errors as a function of magnitude (see for example the comparison with 2MASS data).
However, these survey data could benefit from a denser reference star catalog than the Tycho-2. Most of the highly accurate Tycho stars are just overexposed in the Schmidt CCD data, while the accessible Tycho stars around magnitude 11 to 12 are affected by relatively large errors. Typical CPA solutions have a standard error of 60 to 80 mas (combined error of the data and the reference star positional errors, per star and coordinate). Thus the “plate” parameters are not very well defined, which leads to significant scatter in samples of a few CCD frames, as seen for example in the comparison of BSCC data with the CMC14 catalog which barely overlap at declination . A block-adjustment type solution for overlapping frames is difficult with the BSCC data due to the large gaps in the survey area coverage and not enough overlap between adjacent CCD images (no 2 or 4-fold overlap pattern).
Similarly the photometric results suffer from a weak determination of the zero-point per CCD frame due to the small number of available, highly accurate standard stars. Once a denser photometric catalog than the Tycho-2 becomes available, the BSCC data would benefit from a re-reduction.
The most important aspect of the BSCC astrometric data is the high signal-to-noise data for stars at the faint UCAC end, i.e. stars around R = 15 to 16. The precision of the BSCC positions is about 40 mas per coordinate, while the UCAC data are on the 70 mas level at those magnitudes. However, only a small area of the sky could be covered with this 7-year effort. Full-sky coverage with high accuracy down to about R = 17.5 will hopefully be achieved soon with the URAT project (Zacharias, 2008). Combining URAT data with the BSCC will provide excellent proper motions for those faint stars on the 3 mas/yr level, completely based on CCD observations for early and current epoch data.
References
- Abazajian et al. (2009) Abazajian, K. N. et al. 2009, ApJS 182, 543
- Andersen & Clausen (1974) Andersen, J. Clausen, J. V. 1974, A&A, 34, 423
- Copenhagen Univ., IoA & RIOA (2006) Carlsberg Meridian Catalogue 14 (CMC14), Copenhagen University, Institute of Astronomy Cambridge, & Real Instituto y Observatorio de la Armada San Fernando, 2006, www.ast.cam.ac.uk/ dwe/SRF/cmc14.html, VizieR on-line Catalog I/304
- Florentin-Nielsen & Jørgensen (1995) Florentin-Nielsen, R. & Jørgensen, H. E. 1995, ASP Conf. Ser. 84, 450
- Høg et al. (2000) Høg, E. Fabricius, C., Makarov, V., Urban, S., Corbin, T., Wycoff, G., Bastian, U., Schwedendiek, P., Wicenec, A. 2000, A&A, 355, L27
- Munn et al. (2004) Munn, J. A., Monet, D. G., Levine, S. E. et al. 2004, AJ 127, 3034
- Roeser et al. (2010) Roeser, S. et al. 2010, in press with AJ
- Skrutskie, Cutri, Stiening et al. (2006) Skrutskie, M. F, Cutri, R. M., Stiening, R. et al. 2006, AJ, 131, 1163
- Zacharias (2008) Zacharias, N. 2008, in proceed. IAU Symp. 248, Eds. W. Jin, I. Platais, &M. Perryman, p. 310, Cambridge Univ.Press
- Zacharias et al. (2010) Zacharias, N. et al. 2010, AJ 139, 2184
- Zacharias (2010) Zacharias, N. 2010, AJ 139, 2208


column    1         2   3   4   5   6 7 8 9   10 11 12    13 14 15    16  17 18         19    20  21    22  23    24 25
-----------------------------------------------------------------------------------------------------------------------
  688580578 178689890 205  81 205  81 1 1 0 4276  0  0 15424 -1  1 20000  -1  0  586589348 13675  25 13319  23 13305 34
  447877328 178690199 215 235  79  81 2 2 0 4251  0  0 16728 -1  1 17872  -1  1  789094466 15231  49 15146  82 14945 11
  455055784 178691095  80 280  63  62 2 2 0 4251  0  0 15082 -1  1 16426  -1  1  795487085 13414  26 13029  32 12972  3
  734522546 178691442 313  59 122 121 2 2 0 4172  0  0 14531 -1  1 15560  -1  1  663675738 13694  27 13343  32 13357  4
  455012579 178693216  12 107  56  56 2 2 0 4251  0  0 16377 -1  1 16782  -1  1  795487088 15153  43 14744  59 14719 10
  561019952 178694873  35  31  79  81 2 2 0 4172  0  0 15981 -1  1 16741  -1  1  479162850 15029  34 14515  54 14470  8
  727523129 178695017 229 229 229 229 1 1 0 4172  0  0 18172 -1  1 20000  -1  0 1028367395 15287  34 14778  52 14460  6
  433962337 178695446  30  88  61  61 2 2 0 4251  0  0 16496 -1  1 16866  -1  1  480839919 15330  55 14788  72 14807 10
  455332559 178695609  61  66  51  52 2 2 0 4251  0  0 15335 -1  1 16029  -1  1  795487090 14271  30 13871  46 13938  5
  440856487 178696770  14  24  53  52 2 2 0 4251  0  0 14425 -1  1 14782  -1  1  480944299 13567  26 13285  37 13218  3
| BSCC | min | max | number | unit | description |
|---|---|---|---|---|---|
| column | data | data | zeros | of data item | |
| 1 | 1491551 | 1294725510 | 0 | mas | RA (ICRS at mean |
| 2 | 178689890 | 319898157 | 0 | mas | DEC epoch of obs.) |
| 3 | 0 | 999 | 54401 | mas | scatter sigma RA*cosDec |
| 4 | 0 | 999 | 89491 | mas | scatter sigma Dec |
| 5 | 1 | 400 | 0 | mas | model sigma RA*cosDec |
| 6 | 2 | 400 | 0 | mas | model sigma Dec |
| 7 | 1 | 288 | 0 | total numb. images this star | |
| 8 | 1 | 283 | 0 | numb. images used for mean pos | |
| 9 | 0 | 10 | 13711030 | numb. images rejected outliers | |
| 10 | 132 | 7321 | 0 | 1/1000 yr | mean epoch [year-2000] |
| 11 | 0 | 4 | 12828714 | largest double star flag | |
| 12 | 0 | 1 | 13023146 | bad pixel flag (1=bad, else 0) | |
| 13 | 7470 | 20000 | 0 | mmag | mean R model fit magnitude |
| 14 | 1 | 900 | 22693 | mmag | sigma R mag |
| 15 | 0 | 145 | 583043 | numb. images used for R mag | |
| 16 | 6846 | 20000 | 0 | mmag | mean V model fit magnitude |
| 17 | 1 | 900 | 17299 | mmag | sigma V mag |
| 18 | 0 | 144 | 4311081 | numb. images used for V mag | |
| 19 | 0 | 1321535437 | 614483 | 2MASS ID number | |
| 20 | 2069 | 30000 | 0 | mmag | 2MASS J magnitude |
| 21 | 1 | 999 | 0 | mmag | 2MASS sigma J magnitude |
| 22 | 818 | 30000 | 0 | mmag | 2MASS H magnitude |
| 23 | 1 | 999 | 0 | mmag | 2MASS sigma H magnitude |
| 24 | 13 | 30000 | 0 | mmag | 2MASS K magnitude |
| 25 | 1 | 999 | 0 | mmag | 2MASS sigma K magnitude |
Note. — Undefined photometric errors are set to , and a value of 30000 for a magnitude indicates “no data”.