The Initial Conditions of Clustered Star Formation III. The Deuterium Fractionation of the Ophiuchus B2 Core
Abstract
We present N2D+ 3-2 (IRAM) and H2D+ and N2H+ 4-3 (JCMT) maps of the small cluster-forming Ophiuchus B2 Core in the nearby Ophiuchus molecular cloud. In conjunction with previously published N2H+ 1-0 observations, the N2D+ data reveal the deuterium fractionation in the high density gas across Oph B2. The average deuterium fractionation over Oph B2, with several small scale peaks and a maximum . The mean is consistent with previous results in isolated starless and protostellar cores. The column density distributions of both H2D+ and N2D+ show no correlation with total H2 column density. We find, however, an anticorrelation in deuterium fractionation with proximity to the embedded protostars in Oph B2 to distances pc. Destruction mechanisms for deuterated molecules require gas temperatures greater than those previously determined through NH3 observations of Oph B2 to proceed. We present temperatures calculated for the dense core gas through the equating of non-thermal line widths for molecules (i.e., N2D+ and H2D+) expected to trace the same core regions, but the observed complex line structures in B2 preclude finding a reasonable result in many locations. This method may, however, work well in isolated cores with less complicated velocity structures. Finally, we use and the H2D+ column density across Oph B2 to set a lower limit on the ionization fraction across the core, finding a mean . Our results show that care must be taken when using deuterated species as a probe of the physical conditions of dense gas in star-forming regions.
1 Introduction
The Ophiuchus molecular cloud is a source of ongoing low-mass clustered star formation relatively close to the Sun ( pc; Lombardi et al. 2008). Through low resolution DCO+ observations, Loren et al. (1990) discovered a number of dense Cores (labelled A through F) in the central Ophiuchus region with masses of a few to several tens of solar masses, which represented a range in evolutionary status given the presence or absence of embedded protostars111In this paper, we describe Oph A, B, C, etc., as ‘Cores’ since this is how these features were named in DCO+ observations of the L1688 region by Loren et al. (1990). Since then, higher-resolution data such as those described in this paper have revealed substructure in these features that could be themselves precursors to stars, i.e., cores. To avoid confusion, we refer the larger features in Oph as ‘Cores’ and Core substructure identified by clumpfind as ‘clumps’.. Large-scale submillimetre and millimetre observations of Ophiuchus identified several new Cores, and revealed the Cores were further fragmented into multiple dense clumps, each with masses M⊙ (Motte et al. 1998; Johnstone et al. 2000, 2004; Young et al. 2006; Sadavoy et al. 2010). Analysis of the clump kinematics suggests most are in virial equilibrium and hence not transient objects (André et al. 2007). Recent Spitzer Space Telescope studies of infrared emission towards the Cores have characterized in detail the starless and protostellar clump population (Jørgensen et al. 2008; Enoch et al. 2009). These objects are thus ideal locations to study the physical characteristics of dense cores in the process of forming small stellar clusters.
To characterize the physical properties of the dense, cluster forming Ophiuchus Cores, we have previously studied Oph B, C and F through high resolution NH3 (1,1) and (2,2) observations (Friesen et al. 2009, hereafter Paper I), and Oph B in both single-dish and interferometer N2H+ 1-0 emission (Friesen et al. 2010, hereafter Paper II). The NH3 and N2H+ observations probe gas at densities cm-3 and cm-3, respectively.
In Paper I, we identified (through the 3D clumpfind structure-finding algorithm; Williams et al. 1994) a number of individual clumps in NH3 emission in the Cores, which did not correlate well with those identified in continuum emission. We determined that Oph B and F were warmer on average than typically found for isolated cores (mean K), and we found no trend with temperatures and H2 column density calculated from submillimetre continuum emission. In contrast, Oph C is colder, with temperatures decreasing to a minimum of 9 K at the dust continuum emission peak. Line widths in both the Oph B1 and B2 sub-Cores were found to be wide and transonic, despite the presence of three embedded protostars in B2 and none in B1. Oph F, with four embedded protostars, has regions of small and large line widths and complicated line structures. Again similar to isolated objects, NH3 line widths in Oph C are extremely narrow and consistent with being due to purely thermal motions. In an interesting result, the fractional abundance of NH3 with respect to H2, , appeared to decrease with increasing H2 column density, , suggesting NH3 may be depleted towards locations of high column density and thus may not be tracing the densest core gas. Finally, Paper I revealed that cores with characteristics of both isolated and clustered environments can coexist in a clustered star forming environment.
In Paper II, we again used clumpfind to identify small-scale structure in N2H+ emission from Oph B and found that the N2H+ clumps matched well NH3 clumps from Paper I, and were consequently again offset from continuum objects. In both studies, little difference was found in the gas properties towards embedded protostars compared with the general core gas. Line widths in Oph B2 remain large at the densities traced by N2H+. In B1, however, N2H+ line widths are significantly narrower than found in NH3 emission. Applying the gas temperatures determined in Paper I, we found that motions in Oph B1 were subsonic with a mean ratio of non-thermal line width to sound speed across the core, while in B2 . A clear trend of decreasing with increasing was found towards Oph B2, with emission suggestive of a N2H+ hole towards the continuum emission peak found in high resolution N2H+ 1-0 emission observed with the Australia Telescope Compact Array.
The results of NH3 and N2H+ observations towards Oph B2 in Paper I and Paper II indicate that the highest density gas may best be probed by molecular emission lines excited at higher critical densities, or by deuterated molecules which are expected to be abundant in cold cores where significant depletion has occurred. In cold molecular cloud cores, the deuteration process is initiated by the reaction
| (1) |
which is exothermic in the forward direction with K (Millar et al. 1989). At very low temperatures ( K), the forward reaction dominates, making H2D+ a key molecular ion in the enhancement of deuterated species in a molecular core. CO, which can destroy both H2D+ and H via proton-transfer reactions, is additionally expected to deplete from the gas phase through freeze-out onto dust grains. The deuterium fractionation can thus be elevated orders of magnitude above the cosmic [D]/[H] ratio of for H, as well as for other species which react with its deuterated forms.
The ortho-H2D+ transition at 372 GHz was first detected towards the low mass young stellar object (YSO) NGC 1333 IRAS 4A by Stark et al. (1999). Multiple detections of H2D+ and doubly-deuterated H, D2H+, have followed in both starless and protostellar cores (Caselli et al. 2003; Stark et al. 2004; Vastel et al. 2004), including a recent survey of H2D+ emission towards sixteen objects by Caselli et al. (2008). Walmsley et al. (2004) show the H2D+ abundance determined for the dark core L1544 by Caselli et al. 2003 is consistent with a ‘complete depletion’ model, where heavy elements such as C, N and O (and, consequently, molecules containing these elements) are missing from the gas phase at the highest core densities. In this scenario where no heavy elements are left in the gas phase, H2D+ and multiply-deuterated forms of H are the only gas tracers of the physical conditions of the dense core.
Based on our previous work in Paper I and Paper II, Oph B2 is a good target to investigate the distribution of deuterated species in a more complex star-forming core. To this end, we present in this paper N2D+ 3-2, N2H+ 4-3 and H2D+ emission maps of Oph B2. In the following sections, we present the observations in §2, and discuss the observed distributions of N2D+ 3-2, H2D+ and N2H+ 4-3 in §3. We fit the observed spectra with a single Gaussian (for H2D+) or a multiple-component Gaussian (for N2D+ and N2H+ due to their hyperfine line structure) and discuss the line velocity centroids and widths in §4, and also present column density and fractional abundance calculations. In §5 we look at the non-thermal line widths in Oph B2 as a function of critical density of the observed emission lines, and discuss trends in the deuterium fractionation. Finally, we present a lower limit to the electron abundance in B2, and summarize our results in §6.
2 Observations
In the following section we discuss the observations presented in this paper. We list the species, transitions, and rest frequencies observed in Table 1.
2.1 N2D+ at IRAM
An On-The-Fly (OTF) map of the N2D+ 3-2 line at 231.321 GHz in Oph B2 was made at the Institut de Radio Astronomie Millimétrique (IRAM) 30 m Telescope during the 2007 and 2008 winter semesters using the HEterodyne Receiver Array (HERA, Schuster et al. 2004). HERA is a multi-beam spectral line receiver with nine dual polarization pixels arranged in a array, with pixels separated by 24″ [approximately twice the 231 GHz 11″ beam full width half power (FWHP)]. The maps were performed with the array tracking the sky rotation, and rotated by 9.5° with respect to the equatorial system, such that the spacing between OTF lines was 4″. Observations were frequency-switched in-band with a throw of MHz. The Versatile Spectrometer Assembly (VESPA) autocorrelator was used as the backend, with a 20 MHz bandwidth and 40 kHz channel spacing, corresponding to 0.05 km s-1 per channel at 231 GHz.
The data were calibrated to units at the telescope using the Multichannel Imaging and Calibration Software for Receiver Arrays (MIRA). Further calibration, including baselining and folding of the frequency-switched spectra, was performed using the CLASS software package222see http://www.iram.fr/IRAMFR/GILDAS.. The data were smoothed by two spectral channels along the frequency axis to improve sensitivity, for a final spectral resolution of 80 kHz, or 0.1 km s-1. A second-order polynomial baseline was fitted to the non-line channels and subtracted from the individual spectra before folding the data. The forward () and beam () efficiencies of the telescope were interpolated from determined values at 210 GHz and 260 GHz, giving and at 231 GHz. The data were then calibrated to main beam temperature via the relation . For comparison with the N2H+ 1-0 results in Paper II, we further converted the data to units of Jy / beam-1 and convolved the map to a final angular resolution of 18″ to match the N2H+ data.
As the observations were performed in a pooled mode, the 4′ 3′ map was observed in three 4′ 1′ strips to ensure good sensitivity in potentially limited time. Two-thirds of the map was completed in this manner in winter 2007, while the remaining strip was observed in winter 2008. The sensitivity of the map is consequently not entirely uniform, with the rms noise in the most southern 4′ 1′ strip greater [0.15 K ()] than in the rest of the map [0.08 K ()]. Most emission was found in the central and northern map sections, however, so this noise increase does not affect our results significantly.
2.2 H2D+ and N2H+ at the JCMT
Simultaneous observations of the H2D+ 1 and N2H+ 4-3 emission lines at 372.421 GHz and 372.673 GHz, respectively, were performed at the James Clerk Maxwell Telescope (JCMT) over the 07A - 08B semesters using the 16-receptor Heterodyne Array Receiver Program B-band receiver (HARP-B, Smith et al. 2008). HARP-B is a pixel array, with array spacing of 30″ and a 2′ 2′ footprint. The JCMT beam at 372 GHz is ″ FWHM. We used the ACSIS correlator as the backend, configured to have a 400 MHz effective bandwidth (e.g., wide enough to encompass both lines), tuned halfway in frequency between the two lines, and a frequency resolution of 61 kHz, or 0.05 km s-1 at 372.4 GHz. Observations of five separate HARP footprints were performed in position-switching mode to create an undersampled map of H2D+ and N2H+ over Oph B2. The footprints were placed such that the final beam spacing on the sky is 21″ with a coverage of ′ 2′. The fifth footprint provided additional coverage towards the location of peak continuum emission in B2, but has lower sensitivity compared with the other footprints. The observations were performed in band 1 weather only () and generally while Ophiuchus was above 30° in elevation. The mean rms across the H2D+ map is 0.04 K () and 0.05 K () across the N2H+ map. The main beam efficiency factors, , of the HARP receptors at 372 GHz are not currently well-known. At 345 GHz, the mean , with an rms variation of % between detectors (Buckle et al. 2009). We therefore estimate with an uncertainty of %.
Data reduction was performed using the Starlink software package. Each night’s data were first checked for noisy or malfunctioning pixels, and these pixels were flagged individually for each integration. A linear baseline was then removed from each integration, and the data were combined into a final cube with 15″ pixels. To increase sensitivity, the data were averaged along the velocity axis by 2 channels, giving a final velocity resolution of 0.1 km s-1.
3 Results
We first discuss the integrated intensity of N2D+ 3-2, H2D+ and N2H+ 4-3 over Oph B2 and compare the species distributions with submillimetre continuum emission and the locations of embedded protostars.
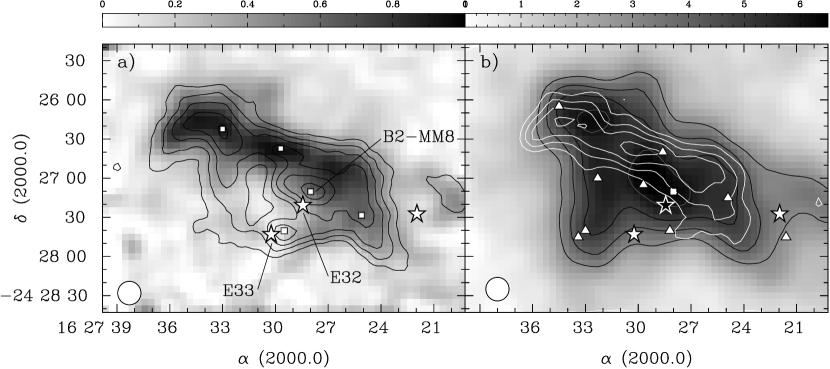
In Figure 1a, we show the integrated N2D+ 3-2 intensity (convolved to 18″ resolution as described in §2.1) in Oph B2 against contours of 850 µm continuum emission observed at the JCMT at 15″ FWHM resolution (original map by Johnstone et al. 2000, combined with all other SCUBA archive data by Jørgensen et al. 2008, following the description in Kirk et al. 2006). Also identified are the locations of 850 µm continuum clumps (Jørgensen et al. 2008) and Class I protostars [classifications and locations taken from Enoch et al. 2009, two of which were previously identified as Elias 32 and 33 (E32 and E33) by Elias 1978; also VSSG 17 and 18 by Vrba et al. 1975]. The N2D+ emission is confined to the northern edge of B2, and generally follows the continuum contours in this region, but a very close correspondence is only seen towards the north-east tip of B2. Three maxima of integrated intensity are present, of which two are co-located with continuum clumps, while the third is seen to the north-west of the continuum peak. The N2D+ emission is weak towards the continuum emission peak, and avoids entirely areas near the protostars.
In Figure 1b, we plot the N2D+ 3-2 integrated intensity contours over a map of N2H+ 1-0 integrated intensity, observed with the Nobeyama 45 m Telescope at 18″ resolution. The N2H+ observations and analysis were presented in Paper II. We also show the locations of N2H+ clumps, identified through clumpfind in Paper II. Overall, N2D+ emission is found within the extent of N2H+ 1-0 emission. In a similar fashion to the continuum emission, however, we find offsets between the locations of peak N2D+ and N2H+ integrated intensity. In particular, the N2D+ integrated intensity maximum is offset from the integrated N2H+ 1-0 maximum in B2 by ″ to the northeast, beam width. The N2H+ 1-0 integrated intensity maximum is itself offset to the east from the continuum peak by ″ (Paper II). The northeastern N2D+ integrated intensity peak, which corresponds well with continuum contours, is also offset from the integrated N2H+ intensity peak by ″ to the east.
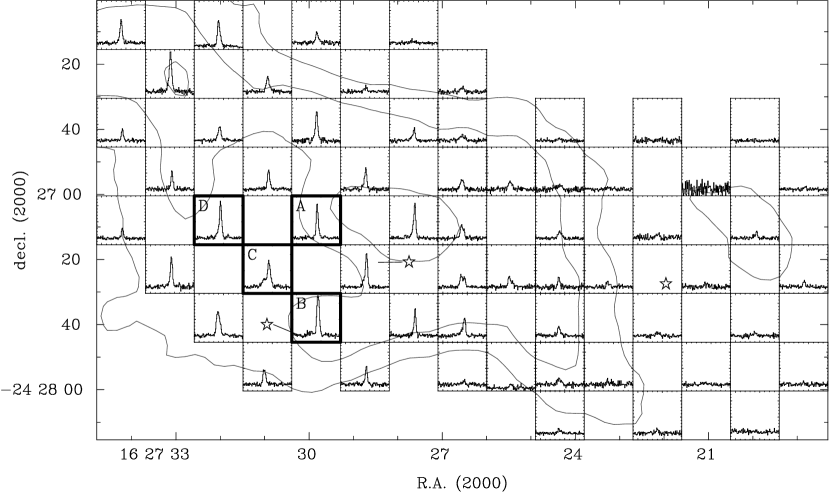
We show in Figure 2 H2D+ spectra across Oph B2 with overlaid 850 µm continuum contours. We find that significant H2D+ emission is present over much of Oph B2, with a larger extent than found in H2D+ observations towards any other cores so far observed (Caselli et al. 2003; Vastel et al. 2006; Pagani et al. 2009). The H2D+ emission again follows generally the continuum emission but avoids the embedded protostars in B2, similar to N2D+. While relatively strong emission is seen towards the continuum peak, the H2D+ integrated intensity maximum (not shown) is also offset the continuum peak by an estimated ″ (due to the map’s undersampling we are unable to determine exactly the location of maximum integrated intensity). In contrast to the N2D+ emission, the H2D+ integrated intensity maximum is found to the northwest rather than the northeast (although N2D+ emission is also found towards the H2D+ peak). The pixel-to-pixel variations seen in Oph B2 may not be significant, however, due to the % variation determined for the main beam efficiency factors between different HARP receptors (Buckle et al. 2009). We detect some H2D+ emission in north-east B2 where was found strong N2D+ emission, but do not see a significant integrated intensity maximum. (Note, however, that the HARP footprints do not extend past an R.A. of 16:27:35, and are therefore not sensitive to any emission at the tip of the continuum contours in this region.) Overall, where N2D+ emission appears strongest in the north and east of Oph B2, H2D+ emission is strongest towards B2’s western edge.
In Figure 3, we show N2H+ 4-3 spectra across Oph B2 with overlaid 850 µm continuum emission contours. We find bright N2H+ 4-3 emission over most of B2. The greatest integrated N2H+ 4-3 intensity (not shown) is found towards E33, while additional strong N2H+ 4-3 emission is found towards E32 and the 850 µm continuum emission peak. A separate integrated intensity peak is found in northeast B2 (where we also find strong N2D+ 3-2 emission). Overall, while the N2H+ 4-3 emission is generally confined to areas where there is also continuum emission, the strongest N2H+ 4-3 emission is found away from the brightest continuum contours. A comparison between Figure 3 and the N2H+ 1-0 integrated intensity in Figure 1b (greyscale) reveals a significant discrepancy between the locations of strong N2H+ 1-0 and 4-3 emission in Oph B. We probe the possible causes of the offset, including the excitation and opacity of the lines, further below.
4 Analysis
4.1 Line fitting
The rotational transitions of the linear molecular ions N2H+ and N2D+ contain hyperfine structure, which is dominated by the interactions between the molecular electric field gradient and the electric quadrupole moments of the two nitrogen nuclei (Dore et al. 2004). Rotational transitions at higher contain greater numbers of hyperfine components at smaller frequency intervals, i.e., the satellite components are found more closely spaced and can overlap significantly. In particular, the N2H+ 4-3 and the N2D+ 3-2 transitions contain 21 and 25 hyperfine components, respectively, with relative line strengths (Pagani et al. 2009; Gerin et al. 2001).
For N2H+ 4-3, we calculate the relative line strengths from the Einstein A coefficients and frequencies given by Pagani et al. (2009), using
| (2) |
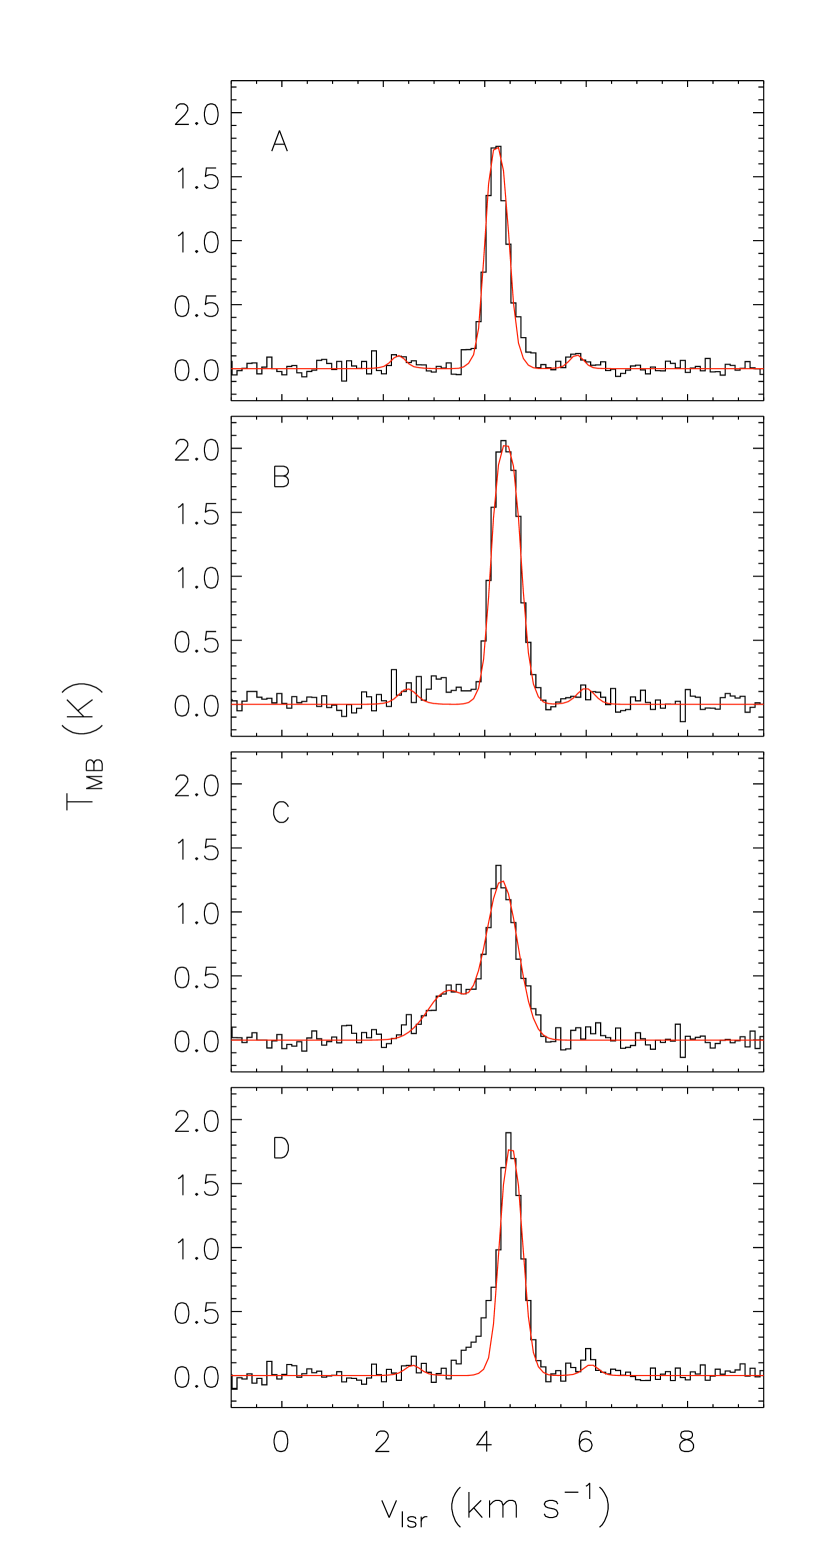
where D is the permanent electric dipole moment, is the upper rotational quantum number and accounts for the degeneracy of the hyperfine states. For the N2H+ 4-3 transition, fourteen components at 8 distinct frequencies make up the main centroid emission, and lie within 0.4 km s-1 of each other. At low optical depths the line profile does not differ substantially from a Gaussian profile, while the relative intensities of the satellite lines to the main line component remain small even at large opacities ( % at ). Nevertheless, the satellite components of the line are visible towards several pixels in Oph B (identified as locations A through C on Figure 3), largely near the embedded protostar E33. In some locations the line structure is confused with a significant blue emission shoulder, which is not due to any hyperfine structure, but which may be associated with an outflow stemming from either E33 or E32 (Kamazaki et al. 2003, White et al. 2010, in preparation). We were thus able to fit well the hyperfine structure towards only one location in the map, and constrain the excitation temperature, , and opacity, , towards two others.
We fit the hyperfine structure with a custom Gaussian hyperfine structure fitting routine written in IDL, described in detail in Paper I, assuming equal excitation temperatures for each hyperfine component. The line fitting routine does not take into account the significant overlap between hyperfine components in both the N2H+ and N2D+ transitions, but we find the total N2H+ line opacities are still small where the satellite structure is seen () and we therefore do not expect line overlap to introduce substantial errors.
At low opacities, we cannot solve for and independently. Given a reasonable estimate for , however, we may attempt to fit the line without visible satellite structure. In Paper II, we determined for N2H+ 1-0 emission across Oph B, and to first order can expect the same to describe the excitation of all rotational levels of N2H+. This assumption was found to be accurate in a recent study of N2H+ and N2D+ emission in L1544, where Caselli et al. (2002b) were able to determine separately the excitation temperatures for N2H+ 1-0, 3-2 and N2D+ 2-1 and 3-2, and found they were consistent within uncertainties. We find, however, that while most of the data can be fit reasonably well using the N2H+ 1-0 values, visual inspection showed that a simple Gaussian fit the data equally well, or significantly better, in many cases, and the line opacities were not well-constrained.
Because multiple components of similar line strength overlap to form the main N2H+ 4-3 component, a Gaussian fit will overestimate the line width, while the returned will be shifted relative to a full HFS fit. The shift in can be corrected ( km s-1), and at low opacities, the increase in is small ( % for , up to % for ). In the following sections, we thus discuss only the results of the Gaussian fitting of the N2H+ 4-3 emission unless otherwise stated.
No hyperfine structure was seen above the rms noise in N2D+ 3-2 emission across Oph B. We are therefore unable to fit well the N2D+ 3-2 hyperfine structure solving for both and . Here, however, equating the N2D+ with that found for N2H+ 1-0 emission resulted in better constraints on the opacity. The hyperfine fit, using the relative component strengths and velocities from Gerin et al. (2001), is thus more informative than a simple Gaussian fit, and we discuss the results from the full HFS fit in the following sections.
To properly calculate the line width, , we subtracted in quadrature the resolution width, (0.1 km s-1 for all species), from the observed line width, , such that . The uncertainties reported in the returned parameters are those determined by the fitting routine, and do not take the calibration uncertainty into account. The calibration uncertainty does not affect the uncertainties returned for or . The excitation temperature, column densities and fractional abundances discussed further below, however, are dependent on the amplitude of the line emission, and are thus affected by the absolute calibration uncertainty.
The H2D+ emission line has no hyperfine structure. We consequently fit the emission at each pixel with a single Gaussian (again in idl) to determine the line amplitude, and across Oph B2.
4.2 Centroid velocity and line widths
Table 2 lists the mean, rms, minimum and maximum values of and for N2H+ 4-3, N2D+ 3-2, and H2D+ , along with the same results from NH3 (1,1) and N2H+ 1-0 presented in Paper I and Paper II for comparison.
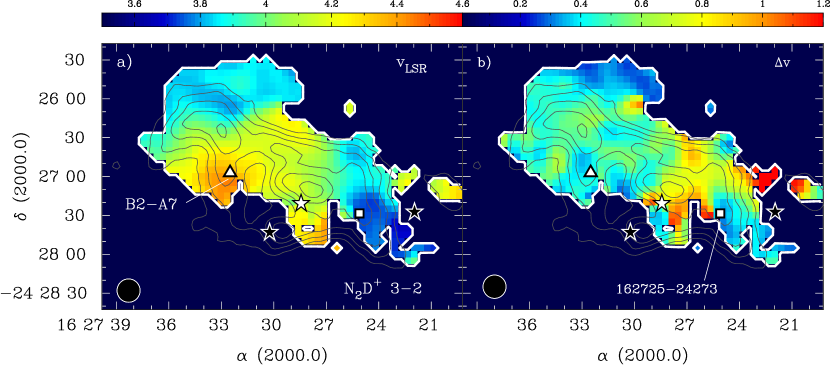
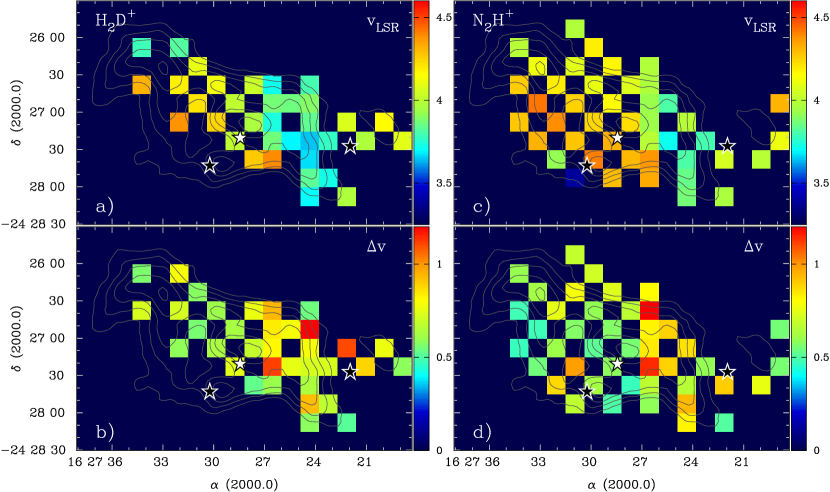
We show in Figure 5 the N2D+ and over Oph B2. We only plot values where the S/N ratio of the peak line intensity was . The mean across B2 is 4.02 km s-1 with an rms variation of 0.19 km s-1. Lower values are found towards the western and northeastern regions of the Core, with the maximum km s-1 in the east towards the NH3 (1,1) clump B2-A7 (identified in Paper I and labelled on Figure 5; coincident with the N2H+ 1-0 clump B2-N6 from Paper II). The variation in does not suggest global rotation of B2. The N2D+ line velocities shift between 3.7 km s-1 and 4.4 km s-1 over ″, or AU, to the west of E32. Nearby, the line shifts from 3.7 km s-1 to 4.2 km s-1 on either side of the western embedded protostar.
The mean N2D+ 3-2 line width km s-1 with an rms variation of 0.20 km s-1. In general, the widest line widths are found near E32 and the western protostar (Oph-emb5, Enoch et al. 2009), to a maximum km s-1 in western B2 (but note the largest values are found only ″ to the northwest of some of the narrowest values). The locations of large line widths correspond well with the locations of dramatic shifts, described above. Away from the protostars, only small variations in the relatively narrow line widths are seen, notably towards the northeast and southwest, with km s-1. Two objects are associated with localized narrow . An 850 µm continuum clump (162725-24273, Jørgensen et al. 2008), shown on the image, was identified where the southwestern narrow line widths are found. In the east, B2-A7 NH3 is also associated with a minimum of 0.36 km s-1. This is similar to the clump line width in N2H+ 1-0 emission at 18″ resolution, but nearly a factor of two larger than found in N2H+ 1-0 interferometer observations of the clump presented in Paper II.
In Figure 6a and Figure 6c we show the determined through Gaussian fitting of the H2D+ and N2H+ 4-3 lines, respectively. Visual inspection of the values shows that the H2D+ emission is similar kinematically to the N2D+ 3-2 values in Figure 5a, while a small shift in of km s-1 is seen in N2H+ 4-3 emission towards Elias 32 and the 850 µm continuum emission peak and co-located 850 µm continuum emission peak (co-located with the continuum clump B2-MM8). The shift is small but significant given the otherwise excellent agreement in between the different tracers over B2 (see Table 2).
We show in Figure 6b and Figure 6d the of the H2D+ and N2H+ lines. The H2D+ line widths are large, with a mean km s-1, and do not vary greatly over Oph B2 ( rms = 0.19 km s-1). Slightly greater line widths are found in the western half of B2. Gaussian fits to the N2H+ 4-3 data find the lines are slightly more narrow, with a mean km s-1. As noted in §4.1, Gaussian fits likely overestimate the true N2H+ line width by %. Wider N2H+ lines are also found towards western Oph B2, while narrower lines are seen towards the submillimetre continuum emission peak and in B2’s eastern half. N2H+ lines of average width are found towards the embedded protostars, but become wider at pixels directly offset from the infrared sources. In particular, directly to the east of E32 and E33, the N2H+ 4-3 line profiles show a significant blue shoulder with emission extending to km s-1. Figure 4c shows the result of a two-component Gaussian fit to the line and blue shoulder at location C in Figure 3.
4.3 N2H+ opacity and excitation temperature
Comparison of the N2H+ 1-0 and 4-3 line emission (see Figure 1b and Figure 3) shows that while in both cases emission is found over much of Oph B2, the integrated intensity distributions of the two transitions are quite different. It is thus unclear whether the excitation conditions for both transitions would be equal.
Towards several pixels, hyperfine structure is visible. These locations are labeled A through C on Figure 3, and these spectra are again shown in Figure 4. Using the full hyperfine component fit (overlaid on the spectrum), we were able to determine reasonably well the excitation temperature and opacity of the N2H+ 4-3 line, and towards location A, with the resulting best fit total line opacity , with K. Both and are approximately consistent with values found in Paper II for N2H+ 1-0 emission at the same location, where K and . The brightest N2H+ 4-3 line emission, however, and additionally the maximum integrated intensity, is located towards E33 (location B in Figure 3, directly south of A). The intensity ratio of the main N2H+ 4-3 component with an apparent red satellite (line strength only 2 the data rms noise level, but at the correct velocity and with a width that matches the main component, see Figure 4b) suggests that the N2H+ 4-3 opacity towards E33 remains moderately optically thick, , and the corresponding . The expected line profile given these values is overlaid on the spectrum in Figure 4. The integrated N2H+ 1-0 emission decreases significantly towards E33 (see Figure 1b and Paper II). Additionally, the emission is confused by multiple velocity components which preclude robust fits to the 1-0 spectra, so we do not have a good estimate of the N2H+ 1-0 at this location. At location D in Figure 3, satellite emission is again seen, but here the hyperfine fits are confused by significant blue shoulder emission. The best-fit results give K K, with . We overlay the expected line profile for K and on spectrum D in Figure 4. Elsewhere, no hyperfine structure is visible in the N2H+ 4-3 line.
For opacity ratios between the N2H+ 4-3 and N2H+ 1-0 lines, and similar line widths, the derived N2H+ column density, , calculated using either transition following Caselli et al. (2002c) (Equation A1), is equal if both and K. At lower opacity ratios, the required also decreases. On average, the N2H+ 1-0 and 4-3 line widths agree, however we note that since we cannot fit well the hyperfine structure, the N2H+ 4-3 widths are an overestimate of the true value by %. This uncertainty propagates linearly into the column density calculation. With this caveat, an excitation temperature K agrees well with the mean determined from HFS fitting of the N2H+ 1-0 line in Paper II. We have no column density estimate towards E33 from N2H+ 1-0 emission. Near E32 and E33, however, the greater relative N2H+ 4-3 opacity requires either a higher common K to obtain similar estimates, which does not agree with our N2H+ 1-0 measurement, or the excitation of the N2H+ 4-3 line must be greater than that of the 1-0 line by K. This moderate increase in excitation temperature of the higher excitation N2H+ line is not ruled out by our data. Detailed modeling of the N2H+ emission near the embedded protostars using radiative transfer codes would help disentangle the excitation and opacity effects.
4.4 Column density and fractional abundance
We next discuss the column densities of N2D+ and H2D+ derived from the observed line emission. The N2H+ column density was calculated in Paper II.
4.4.1 N2D+
We calculate the total N2D+ column density, , from the integrated intensity of the 3-2 transition following Caselli et al. (2002a) for optically thin emission:
| (3) |
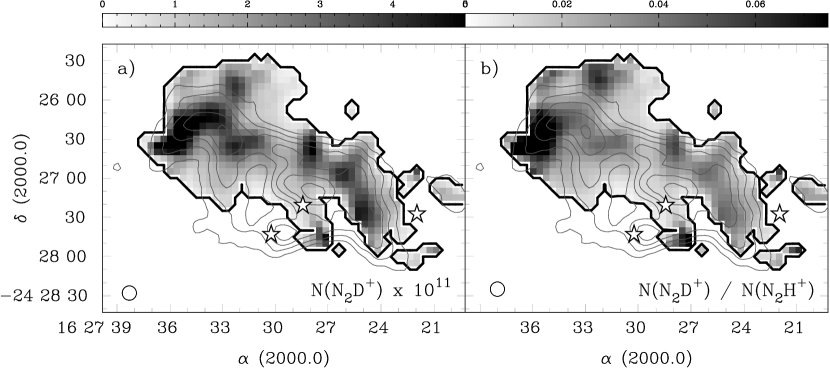
where is the line integrated intensity, is the Einstein spontaneous emission coefficient, and are the statistical weights of the upper and lower states, respectively, and the equivalent Rayleigh-Jeans excitation and background temperatures are given by and . The rotational energy for linear molecules, where the rotation quantum number for the lower energy state and MHz is the rotational constant (Sastry et al. 1981). The partition function , and we use the integrated value, . We assume that the excitation temperature is the same for all rotational levels, and use the fitted N2H+ 1-0 from Paper II as an estimate of the excitation temperature of the N2D+ line at each pixel (as discussed in §4.1). All other parameters remaining equal, at the average of the N2H+ 1-0 line, a decrease in by 2 K would increase the resulting N2D+ column density by a factor , while an increase in by 2 K would decrease the resulting N2D+ column density by . We show across Oph B2 in Figure 7a.
We then calculate the fractional N2D+ abundance per pixel,
| (4) |
where the H2 column density, , is calculated from 850 µm continuum emission. The 15″ data were convolved to a final 18″ FWHM resolution to match the convolved N2D+ data. The H2 column density is then given by , where is the 850 µm flux density, is the main-beam solid angle, is the mean molecular weight, is the mass of hydrogen, is the dust opacity per unit mass at 850 µm, where we take cm2 g-1, and is the Planck function at the dust temperature, . As in Paper I and Paper II, we expect the gas and dust to be well-coupled in Oph B2, and set , the gas kinetic temperature determined from NH3 (1,1) and (2,2) inversion line ratios. We refer the reader to the detailed discussion of the uncertainties in the values presented in Paper II, but note that the derived H2 column densities have uncertainties of factors of a few. Additionally, due to the negative artifacts introduced into the data from the observational chopping technique (again discussed in detail in Paper II), we limit the analysis to pixels where Jy beam-1, though the rms noise level of the continuum map is Jy beam-1. For a dust temperature K, this flux level corresponds to cm-2.
The column density distribution is not similar to the the integrated intensity map shown in Figure 1a. Figure 7a shows several small peaks of in B2 which largely correspond with local minima in the excitation temperature ( K compared with the mean K, where the uncertainty in is K). The peaks remain within the continuum contours but avoid maxima of continuum emission. We find a mean cm-2 in Oph B2 with an rms variation of cm-2. The maximum cm-2 is found towards the northeast. If we calculate assuming a constant K, the distribution follows the integrated intensity but the mean value and variation remain the same.
The fractional N2D+ abundance (not shown) follows a similar distribution to the N2D+ column density. We find a mean with an rms variation of . The maximum is again found towards northeast Oph B2. Within the continuum emission contours, the lowest measured N2D+ abundances () are found towards the continuum emission peak and B2-MM8 clump (emission towards the Elias 33 protostar was not above our S/N limit for analysis).
4.4.2 H2D+
To calculate the H2D+ column density, , we first estimate the line opacity from the H2D+ line emission using
| (5) |
where we must assume a priori an excitation temperature for the transition. An upper limit is given by the gas kinetic temperature . For the pixels where the H2D+ S/N ratio , we found in Paper I a mean K with an rms variation of 1.1 K (slightly less than the mean K found for the entire Oph B Core in Paper I), with a minimum K towards the highest values. We note, however, that the critical density at which NH3 is excited ( cm-3) is lower than that of the H2D+ transition by an order of magnitude, and the NH3 temperatures, or the variation in , may not accurately reflect the conditions where H2D+ is excited.
In their recent H2D+ study of several starless and protostellar cores, Caselli et al. (2008) found that the H2D+ was similar to or slightly less than the core values, which were estimated through a variety of methods (e.g., continuum observations, NH3 inversion observations as for B2, and multiple transition observations of molecules such as HCO+). Six of the seven protostellar cores in their sample had excitation temperatures which ranged from 9 K to 14 K and similar densities to those calculated for B2 in Paper II. Based on these values, and to better compare our results with Caselli et al., we use a constant excitation temperature K in Equation 5. Given K, we find a mean , with a minimum and maximum , which agree well with the Caselli et al. results in protostellar cores.
The total column density of ortho-H2D+ is then given by Vastel et al. (2006)
| (6) |
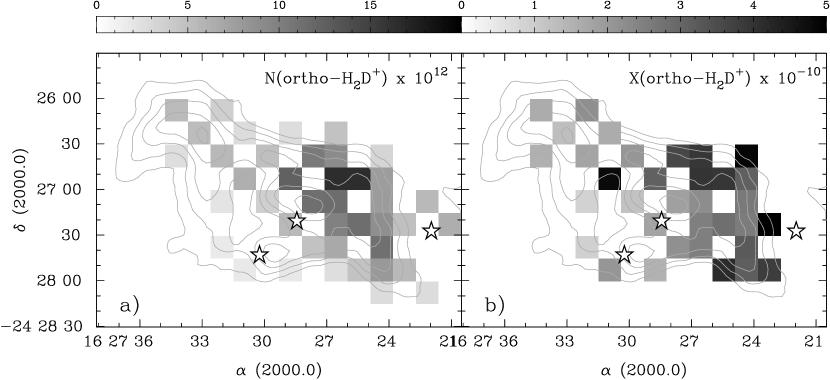
where , K, and s-1 for the transition (Ramanlal & Tennyson 2004). The integral . We calculate by reducing the H2D+ level structure to a 2-level system following Caselli et al. Since the energy of the first excited state above ground is K and that of the second excited state is K, we expect this approximation to be valid in Oph B2 given the low temperatures determined in Paper I. The partition function depends on , which we have estimated to be 12 K. In Figure 8, we plot the variation in , and with given a line K and km s-1 (typical values in B2), and have listed the returned values for between 7 K and 15 K in Table 3. While the variation in returned parameters is fairly large with small changes at low values (i.e., factors or more around K), at higher the values vary less. For example, an increased K rather than K would result in a decreased by %, while a decreased K would result in an increased by %. We thus assume an uncertainty of % in the values reported here.
To calculate the total H2D+ column density in B2, an estimate of the ortho- to para-H2D+ (o/p-H2D+) ratio is needed. The ground state para-H2D+ transition occurs at a frequency of 1.37 THz; this line is difficult to observe from the ground and may not be excited at the low temperatures found in star-forming cores. Without a direct measurement of the population of the para state, we look to chemical models to predict the o/p-H2D+ ratio, which show that the o/p-H2D+ ratio is directly dependent on o/p-H2. Walmsley et al. (2004) find that the o/p-H2 ratio increases to a steady-state value of at K and cm-3, similar to the density and temperature determined for Oph B2 in Paper I and Paper II. The same models predict o/p-H2D+ . Using Bonnor-Ebert sphere core models, Sipilä et al. (2010) also predict o/p-H2D+ ratios at K in steady-state. Their models show that the o/p-H2D+ ratio can dramatically increase to values at K, but these temperatures are unlikely based on our analysis of Oph B2.
It is not clear, however, whether steady-state models accurately represent conditions in star forming cores like B2. The dynamical timescale of a collapsing core can be much shorter than some of the chemical timescales, leading to large departures of free-fall model predictions from steady-state models (Flower et al. 2006). For example, Flower et al. show that the steady-state model underpredicts the o/p ratio by up to an order of magnitude compared with a free-fall collapse model at gas densities cm-3 (the models are more consistent at higher densities). Consequently, it may not be unreasonable to expect variations in the o/p-H2D+ ratio across B2 as it evolves. Given this uncertainty in the o/p-H2D+ ratio, we limit discussion to , but note that the total is likely greater than by a factor of a few.
We show in Figure 9 the resulting distribution across Oph B2. Including only pixels where the S/N , we find the mean cm-2 with an rms variation of cm-2 over Oph B2. To this sensitivity limit, we find a minimum cm-2. The maximum cm-2 is found ″ to the northwest of the 850 µm continuum peak. The largest ortho-H2D+ column densities are found in the western half of Oph B2, with moderate values extending to the northeast.
We next calculate as described for N2D+ above, and show in Figure 9b the distribution across B2. Similarly to the column density distribution, the largest H2D+ abundances, , are found in the west. A local minimum of is found towards the central continuum emission peak, with similar abundances towards the northeast.
4.5 Using H2D+, N2H+ and N2D+ to determine
The molecular weight of H2D+ ( mH) is much less than that of N2H+ or N2D+ (29.01 mH and 30.02 mH, respectively). If we assume that the H2D+ , N2H+ 4-3 or N2D+ 3-2 transitions are excited in the same environment within Oph B2, we would expect each to trace the same core motions, and be described by the same kinetic temperature . This co-location would imply that the non-thermal line widths for the two species should be equal, where . Given equal , the H2D+ thermal line width, , will be measurably larger than that of N2H+ due to its smaller molecular weight. At K, for example, km s-1 for N2D+ and 0.16 km s-1 for H2D+. We can use this difference in thermal line widths to determine the kinetic gas temperature by equating the non-thermal line widths and solving for (e.g., in the case of N2H+):
| (7) |
Mean temperatures of K, in good agreement with temperatures derived from NH3 alone, were derived in this manner towards a number of dense cores by Fuller & Myers (1993) using the molecular species HC3N and NH3. The largest source of error in the derived likely arises from the assumptions listed above rather than from the propagation of the small uncertainties on the observed line widths.
Overall, we expect the comparison of H2D+ and N2D+ to be most accurate, given the similar critical densities of the transitions, the fact that N2D+ must form from H2D+, and the similar distribution of integrated intensity (in contrast with the poor correlation between H2D+ and N2H+ 4-3 emission; see Figures 1a and 2). The different distributions of H2D+ and N2H+ 4-3 in Oph B2 suggest that these two species are not excited in the same environment in the core. Additionally, since our estimates of the N2H+ line widths are not accurate (given the unresolved hyperfine structure), we will focus only on N2D+ for this analysis.
We show in Figure 10 the temperatures calculated based on Equation 7 for H2D+ and N2D+ 3-2. Only pixels where the signal-to-noise ratio of both lines was are shown. The derived values span a large range, from unphysical negative values ( K) to unrealistically large values ( K). Using the mean values of H2D+ and N2D+ from Table 2, we calculate a mean K, similar to that determined through NH3 analysis. Multiple pixels with K are found surrounding the central continuum emission peak. Negative temperatures, however, are found associated with the continuum peak and associated clump B2-MM8.
From Equation 7, we calculate negative values when the observed H2D+ line widths are less than those of N2D+ 3-2. We show in Figure 11 (bottom) derived for H2D+ and N2D+ emission (data values in 15″ pixels plotted), along with the spectra and relative fits towards B2-MM8 (top). Over most of B2, N2D+ line widths are narrower than H2D+, and thus K. The negative temperatures derive from two adjacent pixels towards B2-MM8 where the N2D+ of H2D+. Figure 11 shows non-Gaussianity in the spectra of both species towards B2-MM8, which complicates the calculation of a single line width to describe the emission.
Why would we find greater N2D+ than H2D+ only towards the central continuum peak? One possibility is suggested by the spectra in Figure 11, where additional emission in the H2D+ spectrum is clearly seen blue-shifted relative to the main Gaussian peak. For the H2D+ line, the best-fit Gaussian does not include the blue line shoulder. Slight blue asymmetry is also visible in the N2D+ line, but the distinction between the main component and the shoulder is less obvious. It is possible that the shoulder emission of N2D+ 3-2 is spread over a larger range in due to the contribution of multiple hyperfine components to the observed emission (which would each contain emission at the central line velocity and at the shoulder velocity), broadening the line overall. The best fit to the N2D+ line thus cannot distinguish well between the main and shoulder emission, resulting in an artificially broad .
5 Discussion
5.1 Line widths and density
The mean line widths listed in Table 2 show that on average, the observed for a given molecular line decreases with increasing critical line density, suggesting that the gas in B2 becomes more quiescent at higher densities (omitting N2H+ 4-3, where is an overestimate). For an average gas temperature K, the resulting non-thermal line contribution decreases from km s-1 for NH3 (1,1) emission to km s-1 for N2D+ 3-2 emission (for cm-3 to cm-3, respectively). Comparing with the thermal sound speed at 15 K, where , we find an average for NH3 and for N2D+ 3-2 emission. This comparison shows that despite the decrease in non-thermal motions, the non-thermal motions are equal in magnitude with the sound speed, even at high density. A lower gas temperature would result in even larger magnitudes of , while significantly higher temperatures are unlikely.
This decrease in non-thermal motions at higher densities has been observed in starless cores (e.g., Pon et al. 2009; Tafalla et al. 2004; Lada et al. 2003). Frequently in starless cores, however, the narrowest observed line widths are consistent with being due to nearly pure thermal motions, in contrast to the results found here. As values decrease, the ability for turbulent pressure to support the core against collapse is reduced, which impacts the stability of the core against its self-gravity. The narrow widths found in starless cores are often explained as the result of the dissipation of turbulent motions in the core centre (Goodman et al. 1998). If the non-thermal line widths in B2 are due to turbulent motions, the corresponding turbulent pressure () is equal to or greater than the thermal pressure ().
In Paper I, we discussed the source of wide NH3 line widths in Oph B, and concluded that if the relatively large values are caused by turbulent motions, they could not be primordial (i.e., inherited from the parent cloud). This is because the damping timescale of such motions (with no external driving force) is approximately the dynamical time (Mac Low & Klessen 2004), and the existence of protostars associated with B2 implies that B2 has likely existed, with high density gas, for at least a dynamical time.
The wide lines in Oph B2 may, however, be due to more organized motions such as infall or outflow. None of the observed molecular lines are optically thick, and we therefore do not see the self-absorbed, asymmetric line profiles frequently used to infer the infall of gas within a core. Infall signatures were observed in CS, H2CO or HCO+ emission towards several locations in eastern B2 by André et al. (2007), but not in central or western B2. Gurney et al. (2008) observed complicated CO (and CO isotopologues) line structures towards the B2 continuum peak, but were unable to distinguish infall conclusively. The analysis of line profiles is complicated by a substantial outflow discovered in CO emission and emanating from one of the two embedded YSOs in B2 (Kamazaki et al. 2003) which extends over 10′ ( pc) in size333JCMT Spring 2009 Newsletter, http://jach.hawaii.edu/JCMT/publications/newsletter/. Upcoming results of CO, 13CO and C18O 3-2 observations in Ophiuchus (White et al. 2010, in preparation) from the JCMT Gould Belt Legacy Survey (GBLS, Ward-Thompson et al. 2007) will be better able to study the infall and outflow motions in Oph B. In conjunction with these data, the process of how the outflow motions affect the dense gas may be studied. There is clear evidence, however, for protostellar influence on the N2D+ line widths shown in Figure 5b, as discussed in §4.2. Additionally, the blue shoulder emission seen in N2H+ and N2D+ east of E32 and E33 coincides with the eastern CO lobe of the outflow, and is further evidence for the significant impact of the outflow on the dense gas.
We also noted in §4.2 that there is an offset in of km s-1 between N2H+ 4-3 and H2D+ emission towards B2-MM8 and the nearby embedded protostar Elias 32, with the N2H+ emission redshifted relative to the H2D+ emission. Over the rest of Oph B2, the correlation between the of the two lines is good, suggesting the offset is real and localized. Comparison with N2D+ emission at the same location shows that the of the H2D+ and N2D+ agree well, and it is consequently the N2H+ emission which is offset in velocity from the rest of the core gas. N2H+ 4-3 has a critical density approximately an order of magnitude greater than the H2D+ and N2D+ lines discussed here. The offset in may thus be probing a shift in the gas motions at extremely high densities in the core interior.
5.2 Trends in the deuterium fractionation
5.2.1 The N2D+/N2H+ ratio
The deuterium fractionation, , can be defined as the ratio between the column densities of a deuterated molecule and its hydrogen-bearing counterpart. Here, we define , and calculate in Oph B2 from calculated in §4.4.1 and calculated in Paper II. Figure 7b shows across B2. The distribution is similar to the N2D+ column density in Figure 7a. The largest values of , to a maximum , are found towards northeast B2, while towards the smaller scale maxima, we find or less. We estimate we are sensitive to based on the rms noise in the N2D+ integrated intensity map ( K km s-1 in the off-B2 pixels), and the mean N2H+ column density over Oph B2, cm-2, calculated in Paper II. We find a moderate mean with an rms variation of 0.01 towards B2, comparable to results in Ori B9 towards two N2H+ emission peaks and a protostellar source (, Miettinen et al. 2009). While Pagani et al. (2009) find substantially greater central values through modelling of the starless core L183 ( at the core centre) which decrease to at AU, it is not clear how to compare their model of as a function of core radius to our observed column density ratio. Fontani et al. (2006) found an average towards the high mass star forming region IRAS 05345+3157, which at high resolution resolved into two N2D+ condensations each with (Fontani et al. 2008). In a study of starless cores, Crapsi et al. (2005) find a range in between a lower limit of 0.02 to a maximum of 0.44 (which was found towards the Oph D Core). Crapsi et al. also note that values are generally only found for cores with cm-2, which is approximately the maximum in Oph B2. A similar range in was found towards protostellar, Class 0 sources (Emprechtinger et al. 2009). On average, then, our results agree with previous results. Given our map of Oph B2, however, we can also probe the variation of across the core.
In Figure 12, we show as a function of increasing (Figure 12a), and also as a function of increasing distance (in projection) from the nearest embedded protostar (Figure 12b). Each data point represents an 18″ pixel (to match the beam FWHM) and pixels with S/N in either N2H+ or N2D+ emission are omitted. No clear trend is present in the deuterium fractionation with . We find, however, that increases at greater projected distances from the embedded sources, as might be expected from the N2D+ integrated intensity distribution. We fit a linear trend to the data, where , but note that there is large scatter in the relation. An analysis of the individual N2H+ and N2D+ abundances shows that the increasing trend with projected protostellar distance is dominated by a similar increase in with projected protostellar distance, while is approximately constant over the range plotted, shown in Figure 12d.
5.2.2 H2D+
We next look at the distribution of the ortho-H2D+ abundance over Oph B2. In Figure 12, we show as a function of (Figure 12e), and also as a function of increasing projected protostellar distance (Figure 12f). We show data in 15″ pixels, and omit pixels with S/N . We find no trend in the fractional ortho-H2D+ abundance with H2 column density (an increasing trend is found, but not shown, in the ortho-H2D+ column density, , with ). The vs. relationship is not entirely a scatter plot, as the ortho-H2D+ abundance tends to increase with projected protostellar distance to a maximum at pc, with at larger distances. All data points at pc correspond to the emission found in northeast B2, while the rest show emission closer to the central continuum emission peak. If we fit a linear relationship to the data, omitting the northeast B2 points, we find .
There is also no clear trend in with where both H2D+ and N2D+ are strongly detected across Oph B2, although both species are found with relatively large column densities north and west of the continuum peak. Given the small-scale structure found in the distribution in B2, the spatial resolution and sampling of our H2D+ observations may not be high enough to discern a correlation. We note, however, that Caselli et al. (2008) also found no clear correlation between and in their sample of starless and protostellar cores (with the caveat that some values were derived using column density ratios of deuterated NH3 and deuterated H2CO with their undeuterated counterparts rather than ). In particular, high values of and relatively low were found towards two objects in Ophiuchus (Oph D and 16293E).
5.3 What is affecting the deuterium fractionation in Oph B2?
The largest deuterium fractionation values in Oph B2 are not found towards the continuum emission peak, but instead avoid the continuum peak and nearby protostars. The results of the previous section indicate that the distance to the nearest protostar is the dominant parameter impacting the deuterium fractionation in Oph B2. We next discuss several mechanisms by which the embedded sources are most likely to impact the deuterium fractionation distribution in B2, including temperature variation in the gas, liberation of CO from dust grains, the impact of protostellar outflows, and possible increase in the ionization fraction due to x-rays from the protostars.
5.3.1 Temperature and CO depletion
Temperature can have a substantial impact on the deuterium fractionation in a dense core. As stated in §4.4.1, we expect the gas and dust to be well-coupled at the densities of Oph B2 such that , but specify in the following which of the gas or dust temperature is important in the following mechanisms. First, at K, the H2D+ reaction in Equation 1 can proceed both forwards and backwards, resulting in no net increase in H2D+, and consequently other deuterated species formed via reactions with H2D+. Second, the CO which was deposited (adsorbed) as an icy mantle onto dust grains while at low temperatures will evaporate (desorb) back into the gas phase if the dust grains are heated, providing a destruction mechanism for H2D+ and again interrupting the deuteration chain.
The CO depletion factor, , is defined as the canonical CO abundance, , divided by the CO abundance, , in the observed region:
| (8) |
such that values are low where observed CO abundances are high. Low CO depletion factors can dramatically lower the H2D+ abundance at gas temperatures K (Caselli et al. 2008). Currently no estimates of exist in B2 due to a lack of data at spatial resolutions matching the available continuum data. The CO observations of the JCMT GBLS should enable the first calculations of at complementary spatial resolution, and allow further analysis of the relationship between CO and the deuterium distribution in B2. The extended distribution of H2D+ and N2D+ across Oph B2 implies, however, that extensive depletion of CO has occurred. At densities of cm-3, CO adsorption and desorption occur equally frequently when K (Visser et al. 2009). At K, CO will thus again become significantly more abundant in the gas phase, while at K, enhanced deuterium fractionation via Equation 1 will cease to operate.
An obvious potential source of heating is the presence of embedded protostars within Oph B2. In a 1D dynamic/chemical model of an isolated dense core which collapses to form a protostar, Aikawa et al. (2008, see their Figure 2) find temperatures greater than 18 K can be found at radii AU ( pc) from the protostar at yr after its formation. As a function of total luminosity of the core, , however, their model predicts a CO sublimation radius of AU (0.005 pc) for . In a more specific example, Stamatellos et al. (2007) model the heating effect of an embedded Class I protostar () on the surrounding gas in the Oph A Core, and find only a small temperature increase ( K), limited to the immediate vicinity of the protostar, in agreement with Aikawa et al. (2008).
Both YSOs in central B2 have been classified as embedded (Jørgensen et al. 2008), Class I sources (Enoch et al. 2007). The estimated bolometric luminosities, and for E32 and E33, respectively (Enoch et al. 2007; van Kempen et al. 2009), are much smaller than used in the heating model by Stamatellos et al. (2007). The bolometric temperatures, K and K, suggest both are in the later stages of the Class I phase, as do their negative infrared spectral indices ( and ). Sources with are sometimes classified as ‘flat-spectrum’ sources, and are thought to be an intermediate stage between Class I and Class II. Crapsi et al. (2008) suggest that most or all flat-spectrum sources could be Class II objects seen edge-on. Based on these results, E32 and E33 are not likely to be deeply embedded within Oph B, and have ages yr or greater based on lifetime estimates of the different protostellar stages (Evans et al. 2009).
The low luminosities of E32 and E33 suggest that they should not have a large impact on the temperature of B2, in agreement with our temperature results in Paper I which showed very little variation in the gas temperature over Oph B. Figure 12 shows that we find no trend in the kinetic temperature , determined using NH3 inversion transitions in Paper I, with protostellar distance above the K uncertainties in the data. The derived temperatures are near the required values, however, and the NH3 temperatures may not be indicative of the conditions of the denser gas where we expect most of the deuterated species to exist. Depletion of H2D+ and N2D+ via CO sublimation would thus require an increasing temperature gradient towards higher densities near the protostars, which is not unreasonable.
Since CO also destroys N2H+, significant evaporation of CO from dust grains should also be observable in the N2H+ distribution. Accordingly, in Figure 1b we see a decrease in the integrated N2H+ 1-0 intensity towards E33. No good fit to the N2H+ spectra was found at this location, however, due to complicated line structures, such that we are not able to determine the N2H+ column density or abundance. Figure 12d shows no trend on larger scales of with protostellar proximity. The N2H+ 4-3 distribution shows N2H+ remains in the gas towards E33, but an analysis of the excitation of the line would be needed to determine the N2H+ column density from these data.
In summary, heating by an embedded protostar can produce slightly greater gas temperatures and evaporate CO from the surface of dust grains, which would decrease the deuterium fractionation in the gas. Since we do not see evidence of a decrease in towards the protostars, the evaporation of CO from dust grains is likely not the major mechanism for the decrease in abundance of deuterated species. While we also don’t see evidence of increased gas temperatures near the protostars in the NH3 data, these temperatures reflect average values along the line-of-sight, and do not rule out increased temperatures at higher densities near the protostars. Given the strong dependence of increased deuterium fractionation on temperature, we expect this mechanism is likely very important in B2.
5.3.2 The Oph B2 outflow
The deuterium fractionation may be impacted by the known, extensive CO outflow in B2 described in §5.1. It appears that the dense gas in eastern Oph B2 is affected by the outflow, given the larger line widths seen towards the protostars in high density tracers, changes in , and the blue shoulder emission which is coincident with the eastern lobe of the outflow (Kamazaki et al. 2003) (although large line widths could also indicate the presence of infall motions). We do not find evidence of outflow interaction with the dense gas in northwest Oph B2, suggesting that the outflow may be in front of or behind the bulk of the core gas. Very localized heating of the surrounding gas by the protostar could evaporate CO from the dust grains. The outflow, then containing entrained CO, could mix the CO with the dense core gas, destroying the deuterated species without an increase in the gas temperature on larger scales. Alternatively, shocks associated with the outflow could raise gas temperatures and reintroduce enough CO to the gas phase to affect the deuterium fractionation. Further analysis of the outflow, including observations of shock tracers, is needed to determine whether this scenario is reasonable, and can examine the impact of low-mass protostellar outflows on dense gas chemistry. As discussed above, however, we do not find evidence for variation in the N2H+ abundance as would be expected if destruction due to gas-phase CO is the dominant mechanism for decreasing the abundance of deuterated species relative to their non-deuterated counterparts.
5.3.3 Ionization fraction and electron abundance
Variations in the ionization fraction in the dense gas can also affect the deuterium fractionation, in particular in regions of high CO depletion. The electron abundance, , is the ratio of the electron number density () with the number density of molecular hydrogen, , and is equivalent to the ionization fraction. The deuterium fraction can be reduced by an increase in , which in turn increases the rate of dissociative recombination (Caselli et al. 2008). The abundances of deuterated molecules can thus be used as a probe of in dense cores. At high extinction towards starless cores, the creation of ions is expected to be dominated by the cosmic ray flux, with (McKee 1989).
Studies investigating in dense cores using the DCO+/HCO+ ratio have found average line-of-sight (Bergin & Tafalla 2007, and references therein). In regions of high depletion, the column density ratio of N2D+ with N2H+ is expected to be a better probe of than the ratio of DCO+ with HCO+. Since H is expected to be the major molecular ion in cores strongly depleted in heavy elements, we can use observations of H2D+, in conjunction with , to set limits on assuming the numbers of positive and negative charges are approximately equal (i.e., the core gas is neutral). Given the abundances of N2H+, N2D+and H2D+ in B2, we can thus derive a lower limit on following Miettinen et al. (2009):
| (9) |
where we neglect multiply deuterated forms of H. As discussed in §4.4.2, predictions of the o/p-H2D+ ratio vary from to , and we use a moderate o/p-H2D+ = 0.5 to estimate from . In a simple, steady state analytical model, Crapsi et al. (2004) relate (where ) to the relative H2D+-H abundance, , and also neglect multiply deuterated forms of H such that . In an updated result, Miettinen et al. (2009) find . Using the Miettinen et al. relation we then find a mean across Oph B2, and a lower limit through Equation 9. We find small variations in the lower limit across B2, with a larger limit towards Elias 32 and higher values in general near the 850 µm continuum peak. Detailed modeling, in conjunction with a measurement of the CO depletion factor in B2, is needed to improve this analysis of beyond a lower limit only.
Low mass protostars emit x-rays, which could potentially increase the local ionization fraction and consequently decrease locally the deuterium fractionation of gas in Oph B2. In their study of the x-ray emission from young protostars in the central Ophiuchus region with ROSAT, Casanova et al. (1995) detected both Oph B2 protostars in the keV range, finding luminosities (adjusted for extinction) erg s-1 and erg s-1 for E32 and E33, respectively. We can then estimate the x-ray ionization rate due to the protostars, , at a distance following Silk & Norman (1983, Equation 2). From Figure 12, we find trends in and to projected protostellar distances of order a few pc. Assuming a constant, uniform density cm-3, at pc we find s-1, and at pc we find s-1. The fractional ionization based on these rates, again following Silk & Norman, is and at pc and pc, consistent with our lower limits calculated above. Clumpy, rather than uniform gas could allow x-rays to penetrate further into the core, potentially increasing the fractional ionization to greater distances. The standard ionization rate due to cosmic rays alone s-1 (Herbst & Klemperer 1973), leading to a fractional ionization for cm-3 (McKee 1989). Our simple calculation shows that at distances comparable to where we find variation in the deuterium fractionation in Oph B2, the protostellar x-ray ionization rate and resulting fractional ionization may be comparable to or greater than expected due to cosmic rays alone. This result suggests that x-ray ionization is a viable mechanism to depress the deuterium fractionation close to embedded protostars. Further work is needed to directly measure the fractional ionization of dense gas near protostars, and to quantify the effect of a greater ionization rate on the chemical network of deuterated species in high density gas.
5.3.4 Other possibilities
While Figure 12 suggests that the distribution of enhanced deuterium fractionation of H and N2H+ in Oph B2 is tied to the presence of the Class I protostars associated with the core, other factors may influence the deuteration chemistry in this complex environment. For completeness, we briefly mention two other possibilities. First, line-of-sight inhomogeneities in Oph B2 would impact our estimate of the deuterium fractionation, as our analysis assumes constant excitation and abundance conditions along the line of sight. Detailed physical and chemical modeling may be useful in probing the effects of possible inhomogeneities, but is beyond the scope of this paper due to the complexity of Oph B2. Second, differences in the evolutionary timescale may be important in Oph B2, and in other multiple-star-forming objects. While several protostars have already formed out of the core gas (particularly in the south), there remain multiple dense, starless clumps within B2 which may yet form stars. The timescale on which different parts of the core condense and collapse may impact the dense gas chemistry and produce variations in the deuterium fractionation across Oph B2.
In summary, there a number of different mechanisms by which the deuterium fractionation of N2H+ and H may be decreased near young protostars. We feel that a local increase in the gas temperature is the most likely explanation of this trend, but our simple calculation of the expected increase in the ionization fraction above the standard cosmic ray value is intriguing and worth further study.
6 Summary
In this paper we have presented the results of N2D+ 3-2, N2H+ 4-3 and ortho-H2D+ mapping of the cluster-forming Ophiuchus B Core. In general, our results show that care must be taken when using deuterated species as a probe of the physical conditions of dense gas conditions in star-forming regions. We summarize in detail our results below.
1. Significant emission from the deuterated species N2D+ and H2D+ extends over several square arcminutes in B2. In particular, the extent of the H2D+ emission is the largest yet mapped. Both species’ integrated intensity distributions are offset from the continuum emission, and avoid entirely parts of B2 near embedded protostars and the peak of continuum emission from cold dust.
2. Through fitting of the spectral lines, we find greater N2D+ line widths near protostars embedded in B2, suggestive of protostellar influence on the dense gas. Complicated line structures are found, including blue line shoulders, in all three tracers. We estimate the non-thermal line widths for the species observed here and compare with NH3 and N2H+ results from Paper I and Paper II. In B2, non-thermal line widths decrease with increasing critical density of the molecular tracer, but remain transonic or only slightly subsonic even at high densities. This result is in contrast with the nearly thermal line widths found in many isolated cores.
3. We test a method to estimate the gas temperature by equating the non-thermal line widths of N2D+ and H2D+ and solving for . We find both realistic ( K) and unrealistic ( K and K) values in B2. Complicated line structure in B2 likely affects this analysis, but we expect good results can be found in regions with simple velocity structure.
4. The deuterium fraction of N2H+ on average where N2D+ is detected. Small-scale features of enhanced are seen in B2, but most do not correlate with previously identified continuum clumps or N2H+ clumps. This is consistent with previous results in protostellar cores, and is also within the lower range of values found for starless cores.
5. The average ortho-H2D+ abundance, , given an assumed excitation temperature of 12 K. An accurate measure of the ortho- to para-H2D+ ratio is needed to convert to total H2D+ abundance, and has been found in previous studies to vary between 0.1 and . Future observations of para-H2D+ transitions, if possible, are needed to constrain this value in dense cores.
6. An anti-correlation is found with and and projected distance to the nearest embedded protostar in B2. This relation indicates that the embedded protostars in B2 are affecting the internal chemistry. Possible mechanisms are through gas heating, evaporation of CO off dust grains, CO mixing caused by the B2 outflow, or by increasing the local ionization fraction. Gas temperatures determined through NH3 analysis in Paper I are K required to evaporate CO and reduce deuterium fractionation, but NH3 may not be a good tracer of conditions in the high density gas in Oph B2. We calculate that the x-ray flux of the embedded protostars in B2 could increase the fractional ionization of the core gas beyond that expected solely due to cosmic ray ionization to distances pc, similar to the distances over which we find variation in the deuterium fractionation. We suggest that a temperature increase is the dominant parameter in this trend, but further research on the effect of young stars and their outflows on both the local ionization fraction and the chemistry of deuterated species in protostellar cores is needed.
7. We use the observed and to estimate a lower limit on the ionization fraction in B2, and find given an assumed ortho- to para-H2D+ ratio of 0.5.
References
- Aikawa et al. (2008) Aikawa, Y., Wakelam, V., Garrod, R. T., & Herbst, E. 2008, ApJ, 674, 984
- Amano & Hirao (2005) Amano, T. & Hirao, T. 2005, Journal of Molecular Spectroscopy, 233, 7
- André et al. (2007) André, P., Belloche, A., Motte, F., & Peretto, N. 2007, A&A, 472, 519
- Bergin & Tafalla (2007) Bergin, E. A. & Tafalla, M. 2007, ARA&A, 45, 339
- Buckle et al. (2009) Buckle, J. V., Hills, R. E., Smith, H., Dent, W. R. F., Bell, G., Curtis, E. I., Dace, R., Gibson, H., Graves, S. F., Leech, J., Richer, J. S., Williamson, R., Withington, S., Yassin, G., Bennett, R., Hastings, P., Laidlaw, I., Lightfoot, J. F., Burgess, T., Dewdney, P. E., Hovey, G., Willis, A. G., Redman, R., Wooff, B., Berry, D. S., Cavanagh, B., Davis, G. R., Dempsey, J., Friberg, P., Jenness, T., Kackley, R., Rees, N. P., Tilanus, R., Walther, C., Zwart, W., Klapwijk, T. M., Kroug, M., & Zijlstra, T. 2009, MNRAS, 399, 1026
- Casanova et al. (1995) Casanova, S., Montmerle, T., Feigelson, E. D., & Andre, P. 1995, ApJ, 439, 752
- Caselli et al. (2002a) Caselli, P., Benson, P. J., Myers, P. C., & Tafalla, M. 2002a, ApJ, 572, 238
- Caselli et al. (2003) Caselli, P., van der Tak, F. F. S., Ceccarelli, C., & Bacmann, A. 2003, A&A, 403, L37
- Caselli et al. (2008) Caselli, P., Vastel, C., Ceccarelli, C., van der Tak, F. F. S., Crapsi, A., & Bacmann, A. 2008, A&A, 492, 703
- Caselli et al. (2002b) Caselli, P., Walmsley, C. M., Zucconi, A., Tafalla, M., Dore, L., & Myers, P. C. 2002b, ApJ, 565, 331
- Caselli et al. (2002c) —. 2002c, ApJ, 565, 344
- Crapsi et al. (2005) Crapsi, A., Caselli, P., Walmsley, C. M., Myers, P. C., Tafalla, M., Lee, C. W., & Bourke, T. L. 2005, ApJ, 619, 379
- Crapsi et al. (2004) Crapsi, A., Caselli, P., Walmsley, C. M., Tafalla, M., Lee, C. W., Bourke, T. L., & Myers, P. C. 2004, A&A, 420, 957
- Crapsi et al. (2008) Crapsi, A., van Dishoeck, E. F., Hogerheijde, M. R., Pontoppidan, K. M., & Dullemond, C. P. 2008, A&A, 486, 245
- Daniel et al. (2007) Daniel, F., Cernicharo, J., Roueff, E., Gerin, M., & Dubernet, M. L. 2007, ApJ, 667, 980
- Dore et al. (2004) Dore, L., Caselli, P., Beninati, S., Bourke, T., Myers, P. C., & Cazzoli, G. 2004, A&A, 413, 1177
- Elias (1978) Elias, J. H. 1978, ApJ, 224, 453
- Emprechtinger et al. (2009) Emprechtinger, M., Caselli, P., Volgenau, N. H., Stutzki, J., & Wiedner, M. C. 2009, A&A, 493, 89
- Enoch et al. (2009) Enoch, M. L., Evans, N. J., Sargent, A. I., & Glenn, J. 2009, ApJ, 692, 973
- Enoch et al. (2007) Enoch, M. L., Glenn, J., Evans, II, N. J., Sargent, A. I., Young, K. E., & Huard, T. L. 2007, ApJ, 666, 982
- Evans et al. (2009) Evans, N. J., Dunham, M. M., Jørgensen, J. K., Enoch, M. L., Merín, B., van Dishoeck, E. F., Alcalá, J. M., Myers, P. C., Stapelfeldt, K. R., Huard, T. L., Allen, L. E., Harvey, P. M., van Kempen, T., Blake, G. A., Koerner, D. W., Mundy, L. G., Padgett, D. L., & Sargent, A. I. 2009, ApJS, 181, 321
- Flower et al. (2006) Flower, D. R., Pineau Des Forêts, G., & Walmsley, C. M. 2006, A&A, 449, 621
- Fontani et al. (2008) Fontani, F., Caselli, P., Bourke, T. L., Cesaroni, R., & Brand, J. 2008, A&A, 477, L45
- Fontani et al. (2006) Fontani, F., Caselli, P., Crapsi, A., Cesaroni, R., Molinari, S., Testi, L., & Brand, J. 2006, A&A, 460, 709
- Friesen et al. (2010) Friesen, R. K., Di Francesco, J., Shimajiri, Y., & Takakuwa, S. 2010, ApJ, 708, 1002
- Friesen et al. (2009) Friesen, R. K., Di Francesco, J., Shirley, Y. L., & Myers, P. C. 2009, ApJ, 697, 1457
- Fuller & Myers (1993) Fuller, G. A. & Myers, P. C. 1993, ApJ, 418, 273
- Gerin et al. (2001) Gerin, M., Pearson, J. C., Roueff, E., Falgarone, E., & Phillips, T. G. 2001, ApJ, 551, L193
- Goodman et al. (1998) Goodman, A. A., Barranco, J. A., Wilner, D. J., & Heyer, M. H. 1998, ApJ, 504, 223
- Gurney et al. (2008) Gurney, M., Plume, R., & Johnstone, D. 2008, PASP, 120, 1193
- Herbst & Klemperer (1973) Herbst, E. & Klemperer, W. 1973, ApJ, 185, 505
- Johnstone et al. (2004) Johnstone, D., Di Francesco, J., & Kirk, H. 2004, ApJ, 611, L45
- Johnstone et al. (2000) Johnstone, D., Wilson, C. D., Moriarty-Schieven, G., Joncas, G., Smith, G., Gregersen, E., & Fich, M. 2000, ApJ, 545, 327
- Jørgensen et al. (2008) Jørgensen, J. K., Johnstone, D., Kirk, H., Myers, P. C., Allen, L. E., & Shirley, Y. L. 2008, ApJ, 683, 822
- Kamazaki et al. (2003) Kamazaki, T., Saito, M., Hirano, N., Umemoto, T., & Kawabe, R. 2003, ApJ, 584, 357
- Kirk et al. (2006) Kirk, H., Johnstone, D., & Di Francesco, J. 2006, ApJ, 646, 1009
- Lada et al. (2003) Lada, C. J., Bergin, E. A., Alves, J. F., & Huard, T. L. 2003, ApJ, 586, 286
- Lombardi et al. (2008) Lombardi, M., Lada, C. J., & Alves, J. 2008, A&A, 480, 785
- Loren et al. (1990) Loren, R. B., Wootten, A., & Wilking, B. A. 1990, Astrophys. J., 365, 269
- Mac Low & Klessen (2004) Mac Low, M.-M. & Klessen, R. S. 2004, Reviews of Modern Physics, 76, 125
- McKee (1989) McKee, C. F. 1989, ApJ, 345, 782
- Miettinen et al. (2009) Miettinen, O., Harju, J., Haikala, L. K., Kainulainen, J., & Johansson, L. E. B. 2009, ArXiv e-prints
- Millar et al. (1989) Millar, T. J., Bennett, A., & Herbst, E. 1989, ApJ, 340, 906
- Motte et al. (1998) Motte, F., Andre, P., & Neri, R. 1998, A&A, 336, 150
- Pagani et al. (2009) Pagani, L., Daniel, F., & Dubernet, M.-L. 2009, A&A, 494, 719
- Pon et al. (2009) Pon, A., Plume, R., Friesen, R. K., Di Francesco, J., Matthews, B., & Bergin, E. A. 2009, ApJ, 698, 1914
- Ramanlal & Tennyson (2004) Ramanlal, J. & Tennyson, J. 2004, MNRAS, 354, 161
- Sadavoy et al. (2010) Sadavoy, S. I., Di Francesco, J., Bontemps, S., Megeath, S. T., Rebull, L. M., Allgaier, E., Carey, S., Gutermuth, R., Hora, J., Huard, T., McCabe, C., Muzerolle, J., Noriega-Crespo, A., Padgett, D., & Terebey, S. 2010, ApJ, 710, 1247
- Sastry et al. (1981) Sastry, K. V. L. N., Helminger, P., Herbst, E., & De Lucia, F. C. 1981, Chem. Phys. Lett., 84, 286
- Schöier et al. (2005) Schöier, F. L., van der Tak, F. F. S., van Dishoeck, E. F., & Black, J. H. 2005, A&A, 432, 369
- Schuster et al. (2004) Schuster, K.-F., Boucher, C., Brunswig, W., Carter, M., Chenu, J.-Y., Foullieux, B., Greve, A., John, D., Lazareff, B., Navarro, S., Perrigouard, A., Pollet, J.-L., Sievers, A., Thum, C., & Wiesemeyer, H. 2004, A&A, 423, 1171
- Silk & Norman (1983) Silk, J. & Norman, C. 1983, ApJ, 272, L49
- Sipilä et al. (2010) Sipilä, O., Hugo, E., Harju, J., Asvany, O., Juvela, M., & Schlemmer, S. 2010, A&A, 509, A260000+
- Smith et al. (2008) Smith, H., Buckle, J., Hills, R., Bell, G., Richer, J., Curtis, E., Withington, S., Leech, J., Williamson, R., Dent, W., Hastings, P., Redman, R., Wooff, B., Yeung, K., Friberg, P., Walther, C., Kackley, R., Jenness, T., Tilanus, R., Dempsey, J., Kroug, M., Zijlstra, T., & Klapwijk, T. M. 2008, in Society of Photo-Optical Instrumentation Engineers (SPIE) Conference Series, Vol. 7020, Society of Photo-Optical Instrumentation Engineers (SPIE) Conference Series
- Stamatellos et al. (2007) Stamatellos, D., Whitworth, A. P., & Ward-Thompson, D. 2007, MNRAS, 379, 1390
- Stark et al. (2004) Stark, R., Sandell, G., Beck, S. C., Hogerheijde, M. R., van Dishoeck, E. F., van der Wal, P., van der Tak, F. F. S., Schäfer, F., Melnick, G. J., Ashby, M. L. N., & de Lange, G. 2004, ApJ, 608, 341
- Stark et al. (1999) Stark, R., van der Tak, F. F. S., & van Dishoeck, E. F. 1999, ApJ, 521, L67
- Tafalla et al. (2004) Tafalla, M., Myers, P. C., Caselli, P., & Walmsley, C. M. 2004, A&A, 416, 191
- van Kempen et al. (2009) van Kempen, T. A., van Dishoeck, E. F., Salter, D. M., Hogerheijde, M. R., Jørgensen, J. K., & Boogert, A. C. A. 2009, A&A, 498, 167
- Vastel et al. (2006) Vastel, C., Caselli, P., Ceccarelli, C., Phillips, T., Wiedner, M. C., Peng, R., Houde, M., & Dominik, C. 2006, ApJ, 645, 1198
- Vastel et al. (2004) Vastel, C., Phillips, T. G., & Yoshida, H. 2004, ApJ, 606, L127
- Visser et al. (2009) Visser, R., van Dishoeck, E. F., Doty, S. D., & Dullemond, C. P. 2009, A&A, 495, 881
- Vrba et al. (1975) Vrba, F. J., Strom, K. M., Strom, S. E., & Grasdalen, G. L. 1975, ApJ, 197, 77
- Walmsley et al. (2004) Walmsley, C. M., Flower, D. R., & Pineau des Forêts, G. 2004, A&A, 418, 1035
- Ward-Thompson et al. (2007) Ward-Thompson, D., Di Francesco, J., Hatchell, J., Hogerheijde, M. R., Nutter, D., Bastien, P., Basu, S., Bonnell, I., Bowey, J., Brunt, C., Buckle, J., Butner, H., Cavanagh, B., Chrysostomou, A., Curtis, E., Davis, C. J., Dent, W. R. F., van Dishoeck, E., Edmunds, M. G., Fich, M., Fiege, J., Fissel, L., Friberg, P., Friesen, R., Frieswijk, W., Fuller, G. A., Gosling, A., Graves, S., Greaves, J. S., Helmich, F., Hills, R. E., Holland, W. S., Houde, M., Jayawardhana, R., Johnstone, D., Joncas, G., Kirk, H., Kirk, J. M., Knee, L. B. G., Matthews, B., Matthews, H., Matzner, C., Moriarty-Schieven, G. H., Naylor, D., Padman, R., Plume, R., Rawlings, J. M. C., Redman, R. O., Reid, M., Richer, J. S., Shipman, R., Simpson, R. J., Spaans, M., Stamatellos, D., Tsamis, Y. G., Viti, S., Weferling, B., White, G. J., Whitworth, A. P., Wouterloot, J., Yates, J., & Zhu, M. 2007, PASP, 119, 855
- Williams et al. (1994) Williams, J. P., de Geus, E. J., & Blitz, L. 1994, ApJ, 428, 693
- Young et al. (2006) Young, K. E., Enoch, M. L., Evans, II, N. J., Glenn, J., Sargent, A., Huard, T. L., Aguirre, J., Golwala, S., Haig, D., Harvey, P., Laurent, G., Mauskopf, P., & Sayers, J. 2006, ApJ, 644, 326
| Species | Transition | Frequency | ||||
|---|---|---|---|---|---|---|
| GHz | ||||||
| N2D+ | 4 | 5 | 3 | 4 | 231.321906 aaGerin et al. (2001) | |
| N2H+ | 5 | 5 | 4 | 4 | 372.672494 bbPagani et al. (2009) | |
| H2D+ | 372.421385 ccAmano & Hirao (2005) |
| Species | Transition | |||||||||
|---|---|---|---|---|---|---|---|---|---|---|
| km s-1 | km s-1 | cm-3 | ||||||||
| Mean | RMS | Min | Max | Mean | RMS | Min | Max | |||
| NH3 | 4.14 | 0.19 | 3.85 | 4.58 | 0.87 | 0.16 | 0.42 | 1.11 | aaCaselli et al. (2002a) | |
| N2H+ | 4.04 | 0.20 | 3.61 | 4.43 | 0.71 | 0.22 | 0.38 | 1.42 | bbSchöier et al. ( calculated using Einstein A coefficients and collision rates at 10 K from the Leiden Atomic and Molecular Database; 2005) | |
| H2D+ | ||||||||||
| = | 4.01 | 0.24 | 3.65 | 4.50 | 0.74 | 0.19 | 0.51 | 1.36 | ccCaselli et al. (2008) | |
| N2D+ | 4.02 | 0.19 | 3.67 | 4.44 | 0.53 | 0.20 | 0.25 | 1.36 | ddCalculated using Einstein A coefficients and collision rates for N2H+ 3-2 at 10 K (Schöier et al. 2005). Daniel et al. (2007) (see their Figure 17) found that despite small differences in Einstein A coefficients and collision rates, critical densities of N2H+ and N2D+ are similar for transitions other than . | |
| N2H+ | eeValues calculated from a Gaussian fit due to a lack of visible hyperfine structure. The reported line widths may be greater by % than the true values; see §4.1. | 4.05 | 0.22 | 3.39 | 4.43 | 0.69 | 0.18 | 0.47 | 1.14 | bbSchöier et al. ( calculated using Einstein A coefficients and collision rates at 10 K from the Leiden Atomic and Molecular Database; 2005) |
Note. — The velocity resolution of the NH3 observations was 0.3 km s-1. All other species were observed with 0.1 km s-1 velocity resolution or better.
| K | cm-2 | ||
|---|---|---|---|
| 7 | 0.41 | 9.7 | 1.60 |
| 8 | 0.27 | 10.0 | 1.11 |
| 9 | 0.20 | 10.2 | 0.86 |
| 10 | 0.15 | 10.5 | 0.71 |
| 11 | 0.12 | 10.8 | 0.61 |
| 12 | 0.10 | 11.0 | 0.54 |
| 13 | 0.09 | 11.3 | 0.48 |
| 14 | 0.08 | 11.5 | 0.45 |
| 15 | 0.07 | 11.7 | 0.42 |
Note. — Values were calculated for a line strength K and width km s-1.