Stellar Populations of Elliptical Galaxies in the Local Universe
Abstract
We study the stellar populations of elliptical galaxies at selected from the Sloan Digital Sky Survey as a function of velocity dispersion, , and environment. Our sample constitutes among the largest high-fidelity samples of elliptical galaxies with uniform imaging and optical spectroscopy assembled to date. Confirming previous studies, we find that elliptical galaxies dominate at high luminosities (), and that the highest- ellipticals favor high-density environments. We construct average, high signal-to-noise spectra in bins of and environment and find the following: (1) lower- galaxies have a bluer optical continuum and stronger (but still weak) emission lines; (2) at fixed , field ellipticals have a slightly bluer stellar continuum, especially at wavelengths Å, and have stronger (but still weak) emission lines compared to their group counterparts, although this environmental dependence is strongest for low- ellipticals and the highest- ellipticals are much less affected. Based on Lick indices measured from both the individual and average spectra, we find that: (1) at a given , elliptical galaxies in groups have systematically weaker Balmer absorption than their field counterparts, although this environmental dependence is most pronounced at low ; (2) there is no clear environmental dependence of , while the -element absorption indices such as are only slightly stronger in galaxies belonging to rich groups. An analysis based on simple stellar populations (SSPs) reveals that more massive elliptical galaxies are older, more metal-rich and more strongly enhanced. We also find that: (1) the SSP-equivalent ages of galaxies in rich groups are, on average, Gyr older than in the field, although once again this effect is strongest at low ; (2) galaxies in rich groups have slightly lower [Fe/H] and are marginally more strongly enhanced; and (3) there is no significant environmental dependence of total metallicity, [Z/H]. Our results are generally consistent with stronger low-level recent star formation in field ellipticals at low , similar to recent results based on ultraviolet and infrared observations. We conclude with a brief discussion of our results in the context of recent theoretical models of elliptical galaxy formation.
Subject headings:
galaxies: fundamental parameters (classification, colors, luminosities, masses, radii, etc.) — galaxies: elliptical and lenticular, cD — galaxies: formation – galaxies: evolution – galaxies: stellar content1. Introduction
The formation and evolution of elliptical galaxies remains one of the most challenging open problems in the general theory of galaxy formation and evolution. In the current standard CDM cosmological model (Komatsu et al., 2010), structure grows hierarchically (White & Rees, 1978) and merging is an unavoidable process in galaxy formation. It has long been proposed that spiral galaxies may eventually merge and form elliptical galaxies (Toomre, 1977). Recent improvements in both observations and numerical simulations have yielded remarkable support for the merging picture. Deep photometry (Ferrarese et al., 1994; Kormendy et al., 1994; Lauer et al., 1995; Kormendy, 1999; Lauer et al., 2005; Ferrarese et al., 2006; Lauer et al., 2007; Côté et al., 2007; Kormendy et al., 2009) with the Hubble Space Telescope (HST) and integral-field spectroscopy (Bacon et al., 2001; Emsellem et al., 2007; Cappellari et al., 2007) have shown that lower-mass elliptical galaxies with in general have cuspy (extra-light) surface brightness profiles in their centers and are kinematically supported by relatively fast rotation, while more massive elliptical galaxies with have “core-like” central surface brightness profiles (i.e., missing light), and are usually slow rotators. Recent numerical studies (Mihos & Hernquist, 1994; Cox et al., 2006; Naab & Ostriker, 2009; Hopkins et al., 2009a) have shown that gas-rich mergers between disk galaxies (wet mergers) can produce a cuspy central surface brightness profile and the fast rotational kinematic signature of low-mass elliptical galaxies, while subsequent gas-poor mergers between less massive elliptical galaxies (dry mergers) then will form more massive elliptical galaxies (Naab et al., 2006; Hopkins et al., 2009b).
The mass and luminosity functions of massive red galaxies from deep high redshift surveys at also suggest that dry mergers could have played an important role in elliptical galaxy formation since redshift one (Bell et al., 2004b; Faber et al., 2007). However, whether or not dry mergers are important remains controversial. Other studies show that massive red galaxies may have not undergone many dry mergers since redshift unity (Cimatti et al., 2006; Brown et al., 2007; Cool et al., 2008). Merger rate studies also draw various conclusions about the significance of dry mergers (Bell et al., 2004a, 2006a, 2006b; Masjedi et al., 2006, 2008; Robaina et al., 2010). Meanwhile, studies of early-type galaxies111In this paper, we refer to elliptical and lenticular galaxies (E/S0) as early-type galaxies, but we only include elliptical galaxies (E) in our sample. at very high redshift show that a significant fraction of massive evolved spheroidal stellar systems are already in place at very high redshift (). Most of them appear to be very compact (Daddi et al., 2005; Longhetti et al., 2007; Toft et al., 2007; Trujillo et al., 2007; van Dokkum et al., 2008; Cimatti et al., 2008; Saracco et al., 2009) and it is possible that through minor mergers or gradual accretion they can evolve to elliptical galaxies at the present day (Naab et al., 2009; van Dokkum et al., 2010).
An alternative way to place strong constraints on elliptical galaxy formation theory is through the detailed study of the local universe. Such work has been extensively undertaken for decades. Besides the deep photometric surface brightness profile and integral-field spectroscopic kinematic studies cited above, a non-exhaustive list includes: various scaling relations (e.g., the Faber-Jackson relation, the fundamental plane, etc.) (Faber & Jackson, 1976; Dressler et al., 1987; Djorgovski & Davis, 1987); the color-magnitude diagram (Faber 1973; Bower et al. 1992; Blanton et al. 2003b; Hogg et al. 2004; Baldry et al. 2004; Balogh et al. 2004); and absorption-line indices (Peletier 1989; Worthey et al. 1992; Jørgensen 1999; Trager et al. 2000a; Thomas et al. 2005, hereafter T05; among many others). These studies show that elliptical galaxies have remarkably uniform properties and that their stellar mass content is dominated by old stellar populations.
The study of environmental effects can also shed light on the theory of elliptical galaxy formation and evolution. It has been known for some time that the most massive and luminous galaxies favor high-density regions (Dressler, 1980; Binggeli et al., 1988; Hogg et al., 2003, 2004; Kauffmann et al., 2004; Croton et al., 2005; Blanton et al., 2005a; Blanton & Moustakas, 2009), lending support to the hierarchical model (e.g., Mo & White, 1996; Lemson & Kauffmann, 1999; Berlind et al., 2005). Numerous studies have also investigated the environmental dependence of the scaling relations. For example, the fundamental plane for early-type galaxies seems to show a small dependence on environment (e.g., Bernardi et al., 2006; La Barbera et al., 2010). The color-magnitude relations in different environments also exhibit a weak, though statistically significant difference (e.g., Bernardi et al., 2003b; Hogg et al., 2004; Skibba et al., 2009; Blanton & Moustakas, 2009). A number of studies show that the index-velocity dispersion () relations such as Mg- and Fe- show no or a weak dependence on environment (e.g., Jørgensen 1997; Trager et al. 2000a; Sánchez-Blázquez et al. 2003, among others). However, interpretation of these weak dependencies is complicated. T05, using a sample of 124 E/S0 galaxies and recent simple stellar populations (SSP) models (Thomas et al., 2003b, hereafter TMB), find that massive early-type galaxies in low-density environments are on average Gyr younger and slightly more metal-rich than their counterparts in high-density environments. Sánchez-Blázquez et al. (2006b), using a sample of 94 E/S0 galaxies reported similar results.
One surprising recent finding is that many elliptical galaxies seem to have a non-negligible fraction of young stars. Absorption line studies and fundamental plane studies favor a “frosting” model in which early-type galaxies consist of an old base population with a small amount of younger stars (e.g., Trager et al. 2000b; Gebhardt et al. 2003; Schiavon 2007, S07 hereafter). Results from the Galaxy Evolution Explorer (GALEX; Martin et al. 2005), the Spitzer Space Telescope (Werner et al., 2004) and the HST have shown that a significant fraction of early-type galaxies exhibit strong ultraviolet (UV) excess, polycyclic aromatic hydrocarbon (PAH) emission and infrared (IR) excess, implying possible low-level recent star formation (Yi et al., 2005; Rich et al., 2005; Kaviraj et al., 2007; Schawinski et al., 2007; Temi et al., 2009; Young et al., 2009; Salim & Rich, 2010). Recent star formation is also consistent with observed cold gas in many ellipticals (e.g., Faber & Gallagher 1976; Knapp et al. 1985; van Gorkom & Schiminovich 1997). Schawinski et al. (2007) find that the fraction of near-UV (NUV) bright early-type galaxies is higher in low-density environments, possibly due to stronger low-level recent star formation. Kaviraj et al. (2009) suggest that minor mergers can account for the inferred amount of star formation. Using spatially resolved spectroscopy, Shapiro et al. (2010) (see also Kuntschner et al., 2010) find that star formation in early-type galaxies happens exclusively in fast-rotating systems and occurs in two distinct modes: the first with widespread young stellar populations associated with a high molecular gas content, and the second with disk or ring morphology (see also Young 2002, 2005; Young et al. 2008). They suggest the first may be due to minor mergers, and the second due to rejuvenation in previously quiescent stellar systems.
The Sloan Digital Sky Survey (SDSS, York et al., 2000) has provided the largest set of local galaxies with uniform imaging and spectroscopy and offers a great opportunity to study the nearby elliptical galaxies in a systematic and homogeneous way. Previous work using the SDSS relied on the pipeline outputs in the SDSS to select early-type galaxies (e.g., Bernardi et al., 2003a; Eisenstein et al., 2003). This method does not only select elliptical galaxies, but also lenticular galaxies and early-type spiral galaxies, which may have different properties and formation pathways. Because the SDSS provides high-quality imaging for nearby galaxies, we reanalyze these images, use their detailed surface brightness profiles to preselect bulge-dominated galaxies, and visually examine the bulge-dominate galaxies to select a high-fidelity clean sample of elliptical galaxies. Our sample constitutes among the largest high-fidelity samples of elliptical galaxies with uniform imaging and spectroscopy assembled to date. Comparable samples are the visually selected early-type galaxy samples from the Galaxy Zoo project (e.g., Schawinski et al., 2009) and the MOrphologically Selected Early-types in the SDSS project (MOSES, Schawinski et al. 2007; Thomas et al. 2010) — however, these samples are at larger distances than ours (), which at the spatial resolution of the SDSS images makes the classification problem more difficult. Using this elliptical sample, we study the dependence on and environment of the stellar populations in elliptical galaxies.
The rest of this paper proceeds as follows. In 2, we describe our parent sample and our method for selecting a high-fidelity sample of elliptical galaxies. In 3, we present the photometric properties of our sample and determine their local environments. In 4, we study the average optical spectra, Lick indices, metallicity and age, and their dependence on and environment. We discuss our results in the context of theoretical models in 5 and summarize our principal conclusions in 6.
2. Data and sample selection
2.1. Parent sample
The SDSS-I and SDSS-II imaged square degrees of the sky in and obtained optical spectra for million objects, million of which are galaxies with (e.g., Gunn et al., 1998; York et al., 2000; Strauss et al., 2002; Abazajian et al., 2003). Automated software performs all of the data processing: astrometry (Pier et al., 2003); source identification, deblending and photometry (Lupton et al., 2001); photometricity determination (Hogg et al., 2001); calibration (Fukugita et al., 1996; Smith et al., 2002); spectroscopic target selection (Eisenstein et al., 2001; Strauss et al., 2002; Richards et al., 2002); spectroscopic fiber placement (Blanton et al., 2003a); and spectroscopic data reduction. More detailed descriptions of these pipelines can be found in Stoughton et al. (2002). An automated pipeline called idlspec2d222http://spectro.princeton.edu/idlspec2d_install.html measures the redshifts and classifies the reduced spectra.
For the purposes of computing large scale structure and galaxy property statistics, Blanton et al. (2005b) have assembled a subsample of SDSS galaxies known as the NYU Value Added Galaxy Catalog (NYU-VAGC)333http://sdss.physics.nyu.edu/vagc/. We select our parent sample from the NYU-VAGC low-redshift catalog, consisting of all galaxies in the SDSS with . We use the version of this catalog corresponding to SDSS Data Release 6 (DR6, Adelman-McCarthy et al. 2006), which contains galaxies.
Due to the difficulty of automatic photometric processing of big galaxies, the SDSS catalog is missing many nearby, bright galaxies, even though they are contained within the SDSS imaging footprint; the incompleteness begins to become important at . Therefore, to ensure a complete parent sample, we include any low-redshift galaxies from the Third Reference Catalog of Bright Galaxies (RC3; de Vaucouleurs et al. 1991; Corwin et al. 1994) for which we have imaging from the SDSS, but which are not in the NYU-VAGC. Including galaxies from the RC3, our combined parent sample contains galaxies at (LowZ; see Table 1).
We expect all bona fide elliptical galaxies to occupy the red sequence of the color-magnitude diagram, since even a modest amount of ongoing star formation will result in a blue optical color. Therefore, we isolate galaxies on the red sequence using a luminosity-dependent color cut:
| (1) |
This cut is very generous in that it extends all the way to the edge of the blue cloud, and should therefore include most or all of the blue elliptical galaxies found by recent studies (e.g., Fukugita et al. 2004; Schawinski et al. 2009). There are galaxies that satisfy equation (1), which we define as our photometric red-sequence parent sample (PhotoRS). Within this sample, have spectroscopy from the SDSS, which we define as our spectroscopic red-sequence parent sample (SpecRS; see Table 1).
2.2. Elliptical sample selection
Traditionally, galaxies are classified into different morphological types by visual inspection (de Vaucouleurs, 1959; Sandage et al., 1975; Smail et al., 1997; Desai et al., 2007; Lintott et al., 2008). Unfortunately, visual classification is inherently subjective, and not feasible for samples consisting of tens of thousands of galaxies, which has led to a concerted effort by many different groups to classify galaxies using objective, quantitative criteria (e.g., Conselice et al., 2003; Lotz et al., 2004; Scarlata et al., 2007). However, although quantitative morphological classification schemes have become increasingly sophisticated, they arguably do not capture the detailed variation in morphological signatures apparent to the trained eye (see the recent discussion in Blanton & Moustakas 2009, and references therein). Moreover, in studies of elliptical galaxies, contamination from early-type disk galaxies (i.e., S0/Sa), can be significant. Indeed, objective classification methods have tremendous difficulty distinguishing bulge-dominated disk galaxies from true elliptical galaxies, although the two galaxy types may have experienced very different formation pathways.
Given these various issues, we opt for a hybrid approach, in which we conservatively preselect elliptical galaxies using well-defined quantitative criteria, and then use visual inspection to remove contaminants. Thus we retain the objectivity of quantitative methods and the ability to analyze a large parent sample, while still relying on the superb ability of the eye to identify subtle but important morphological signatures like faint spiral arms, dust lanes, bars, etc., to help remove contaminants. In the next three sections we describe our elliptical galaxy selection in more detail.
2.2.1 The Ellipse method
We first reduce the two-dimensional (2D) images to one-dimensional (1D) surface brightness profiles using the Ellipse algorithm (Jedrzejewski 1987, see also Young et al. 1979; Kent 1983). The Ellipse method is widely used in the imaging analysis of galaxies because the isophotes of galaxies are well approximated by ellipses.
The basic idea of the Ellipse method is to expand the intensity around an ellipse in a Fourier series (see Bender et al. 1989 for the expansion in polar coordinates):
| (2) |
where indicates the intensity, is the eccentric anomaly, and and are the higher-order Fourier coefficients. For a given major axis with length , we use and to find the ellipse that best matches the measured isophote. Specifically, we first provide an initial guess for the center of the ellipse (), the ellipticity (), the position angle (), and the intensity (). We then calculate and () and update the parameters by calculating the expected deviation from the true parameters (see Jedrzejewski 1987), and iterate until the maximum of and () is less than of the intensity (). Next, we measure the third- and fourth-order harmonics of the resulting intensity distribution using least-squares minimization. If an isophote is a perfect ellipse then all the coefficients, will be identically zero. Non-zero coefficients indicate the amount by which the isophote deviates from the shape of an ellipse. In particular, indicates a “disky” isophote, while corresponds to a “boxy” isophote (e.g., Bender et al., 1989).
We apply the Ellipse method to each galaxy image in all five bandpasses as a function of the major axis radius, using a one-pixel step size ( arcsec) along the major axis. At each step, we save all the parameters, including the position of the origin (), the major axis length (), the ellipticity (), the position angle (), the intensity (), the harmonic coefficients ( and with ), and the total flux within each ellipse.
2.2.2 Bulge-disk decomposition
Given the Ellipse fitting results, we model the surface brightness profile, , in each bandpass simultaneously as a function of radius using a two-component “bulge plus disk” model:
| (3) |
where the first term represents a Sérsic model of index (e.g., Sérsic, 1963; Ciotti, 1991; Graham & Driver, 2005) for the bulge component (), and the second term is an exponential model for the disk component (). The parameters and are length-scale factors for the bulge and disk component, respectively; they are constrained to be equal in all three bandpasses, while the amplitudes and are allowed to vary. Note that we have chosen not to include the - and -band surface brightness profiles in this analysis because the photometry in those bands is considerably noisier.
2.2.3 Preselection and visual inspection
Our goal in this section is to select a high-fidelity sample of elliptical galaxies. As discussed in §2.2, our strategy is to apply conservative parameter cuts to our ellipse-fitting results to preselect a sample of spheroidal galaxies, and then to visually inspect the resulting sample to remove contaminating disk-dominated galaxies.
First, we require the bulge-to-total ratio, , to be larger than in all of the three bandpasses. We then reject galaxies with ellipticities larger than , which only rejects a handful of real elliptical galaxies (see and Fig. 4). Next, we parametrize the “featurelessness” of the surface brightness profile by fitting a straight line to the ellipticity versus radius profile, and compute assuming uniform errors for the ellipticities. We define a featurelessness parameter by multiplying the by the largest ellipticity in the profile. By exploring training sets, we apply a generous cut in this parameter to reject non-elliptical contaminants while simultaneously minimizing the number of real elliptical galaxies that are excluded. Finally, because the instrumental dispersion of the SDSS spectrograph is , a velocity dispersion measurement smaller than is not reliable444http://www.sdss.org/dr7/algorithms/veldisp.html; therefore, we only include galaxies with . Among the galaxies in our SpecRS sample (see Table 1), objects have , of which survive our preselection cuts.
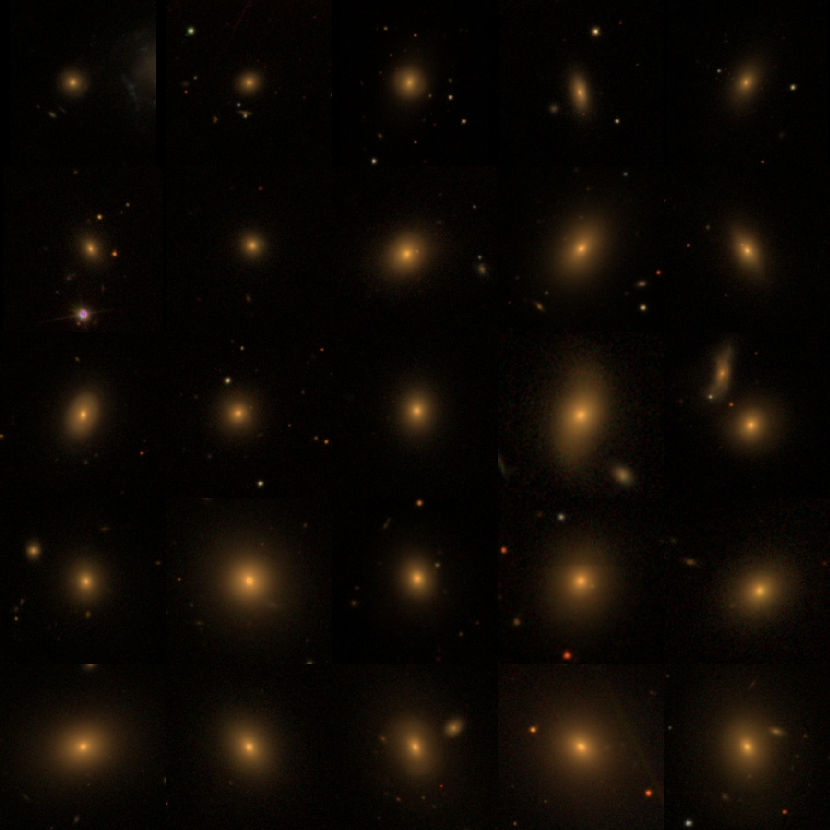
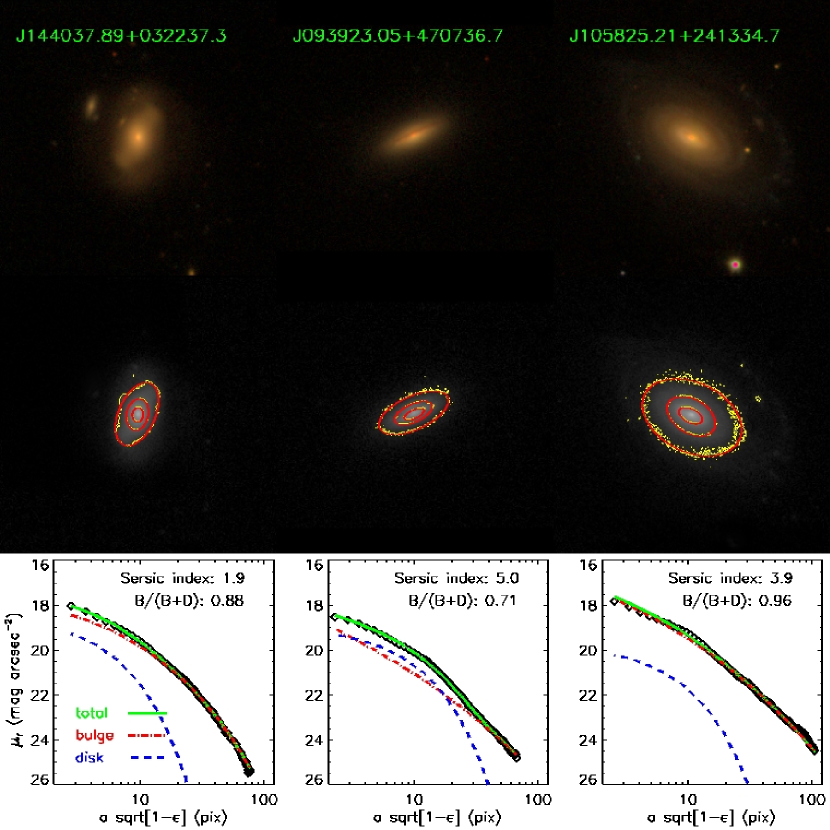
Figure 1 presents color images of a randomly selected subset of our elliptical galaxy sample, sorted by increasing velocity dispersion. Given our generous parameter cuts, however, our procedure does result in some non-elliptical contaminants, three examples of which are shown in Figure 2. Among the contaminants are bulge-dominated SB0 galaxies with very small bars (e.g., Fig. 2 left), galaxies with faint dust lanes (e.g., Fig. 2 middle), and S0 galaxies with faded spiral structures (e.g., Fig. 2 right). Therefore, we visually examined the preselected elliptical galaxy sample and excluded such galaxies. Note that in Figure 1 we have already excluded such galaxies.
Our final sample (Elliptical; see Table 1) contains elliptical galaxies with . For those without SDSS spectroscopy, we have performed the same analysis and selected elliptical galaxies. We refer to them as the bonus elliptical sample (Bonus). Though we do not include them in the analysis in the rest of this paper, we make them publicly available, along with the Elliptical sample with the SDSS spectroscopy.
Our selection certainly still suffers from some subjectivity and may not be “complete” depending on one’s definition of an elliptical. Because we aim for a clean sample, our visual inspection is strict, and we likely exclude some elliptical galaxies that appear ambiguous. In addition, the bulge and disk decomposition classification also possibly identifies real elliptical galaxies with low Sérsic index (low concentration) as disk-dominated galaxies.
For comparison, if we selected early-type galaxies in the same way as in Bernardi et al. (2003a) or Eisenstein et al. (2003), we would select galaxies, including of the galaxies in our Elliptical sample. Therefore, we could select most of galaxies in our sample with their selection method, but lenticulars and early-type spirals would comprise about two thirds of the sample.
3. The Elliptical sample
Our final sample contains elliptical galaxies with and . In this section, we present the general properties of the sample, compare them with the parent and red-sequence samples, and define the local environment of each galaxy.
3.1. Nature of the red sequence
Galaxies can be broadly divided into two groups, the red sequence and the blue cloud, according to their broad-band color and luminosity (e.g. Blanton et al., 2003b; Kauffmann et al., 2003; Baldry et al., 2004). In general terms, red galaxies are early-types with a spheroidal surface brightness profile, that are dominated by an old stellar population. However, disk galaxies that are dusty or have star formation quenched can also appear red in optical broad-band colors. Thus, the red sequence in general consists of both disk-dominated and bulge-dominated galaxies.
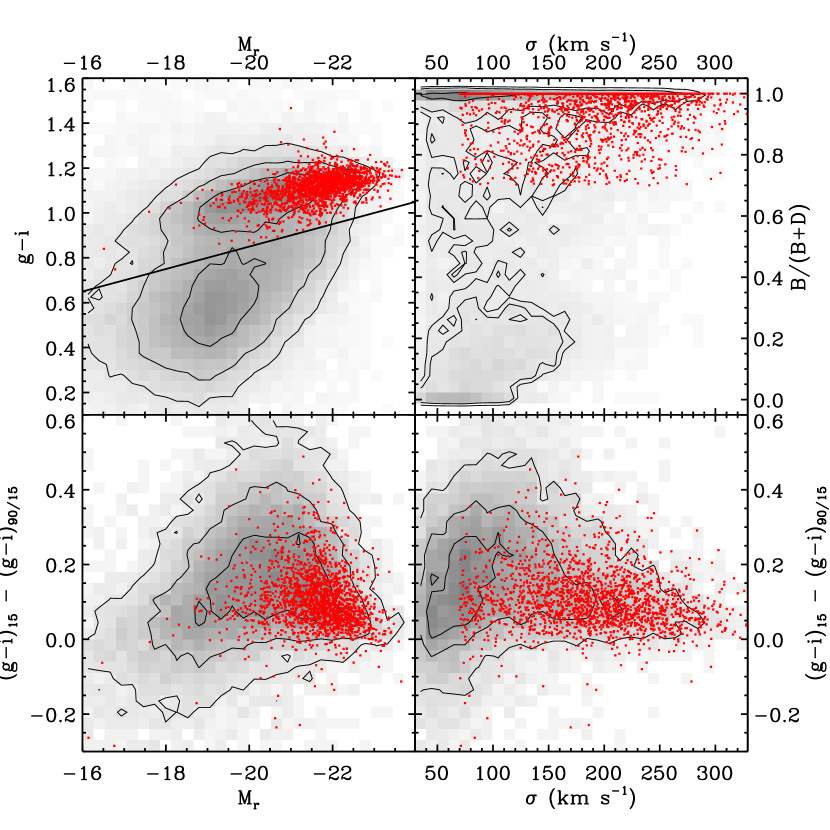
For example, Figure 3 shows the broad-band properties of the Elliptical sample (red dots) compared with the parent samples. The top left panel of Figure 3 shows the full LowZ sample, in which elliptical galaxies (red dots) clearly dominate the luminous end () of the red sequence (see also Marinoni et al., 1999; Bundy et al., 2009). The diagonal line corresponds to equation (1), the color cut used to define the red sequence in §2.1.
In Figure 3 (top-right) we examine the red-sequence galaxies (SpecRS) in more detail by plotting the bulge-to-total ratio () versus . Red-sequence galaxies naturally separate into disk- and bulge-dominated groups. Note that our cuts in and are visible in the distribution of the Elliptical sample. Also note that our cut on bulge-to-total ratio tends to exclude dwarf elliptical galaxies, which often exhibit exponential surface brightness profiles (Michard 1985; Schombert 1986; Prugniel & Simien 1997; Caon et al. 1993; Graham 2002; Kormendy et al. 2009).
Although we do not use it for classification, we also examine the color gradients of the galaxies in our sample. The lower panels of Figure 3 show the color gradients of the red-sequence galaxies as a function of (PhotoRS, left) and (SpecRS, right). We define the color gradient as the color difference between the color within the light radius and that between the and light radii. We find that galaxies form two distinctly different sequences. The central regions of most galaxies are redder than their outer regions. For the disk-dominated galaxies the color gradient increases with luminosity (Tully et al. 1996; Jansen et al. 2000). Meanwhile, for the elliptical galaxies, the color gradient decreases marginally with luminosity (Boroson et al. 1983; see Suh et al. 2010 for an extensive study in a sample similar to ours). These results suggest that the color gradient can be used as an indicator for morphological classification (e.g., Park & Choi, 2005). The physical cause of the color gradient is likely that the metallicity decreases with increasing radius. Kuntschner et al. (2010) (see also Spolaor et al., 2009) show that for low-mass, fast-rotating early-type galaxies the metallicity gradient increases with mass, while for more massive systems the metallicity gradient becomes shallower, leading to the most massive systems being slow rotators with relatively shallow metallicity gradients. This result is consistent with the /luminosity-color gradient relations we find here.
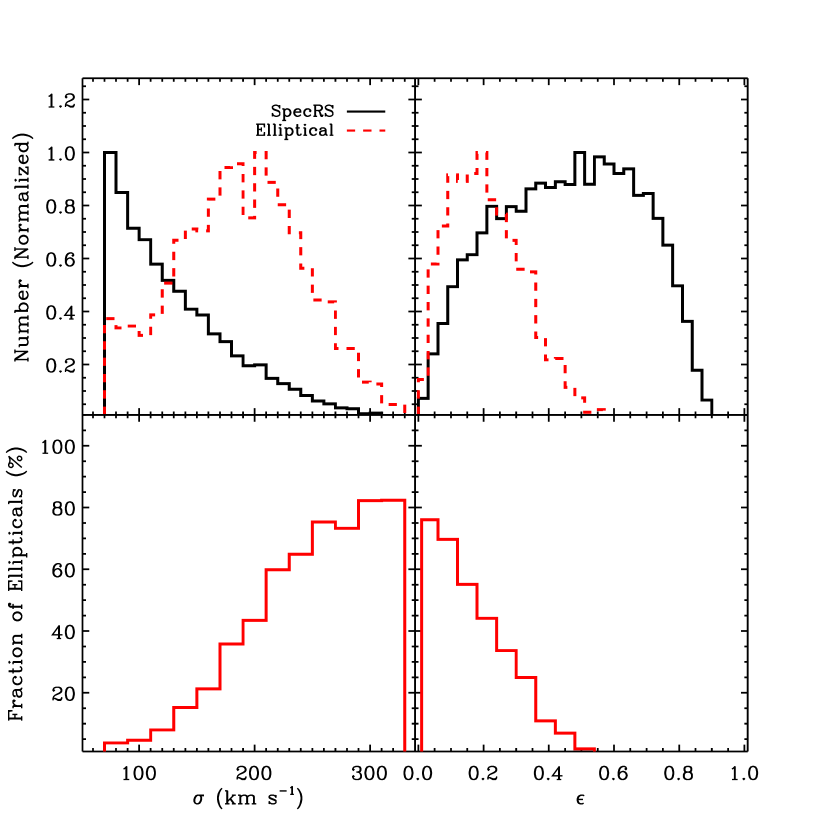
In the top panels of Figure 4 we compare the distributions of , and ellipticity () for the Elliptical and SpecRS samples. Because in general varies within a galaxy, we must choose a particular definition; here we use the mean value between the and light radii. We find the distributions of both quantities to be very different among the two samples. Specifically, elliptical galaxies contain many more massive galaxies, and have a median . We also note from Figure 4 (top-right) that the cut we applied in §2.2.3 rejects very few real elliptical galaxies.
The bottom panels of Figure 4 quantify the fraction of elliptical galaxies in the SpecRS sample as a function of and . We find that the fraction varies from for and , to for and . Note that our selection was intended to be strict; therefore these fractions should be treated as lower limits. Nevertheless, these results suggest that only if one restricts to the luminous end are red-sequence galaxies typically giant elliptical galaxies. At fainter luminosities (), disk-dominated galaxies constitute the bulk of the red sequence. As we pointed out above, part of this trend with luminosity is due to our bulge-to-total cut; lower luminosity ellipticals in general have smaller Sérsic indices (e.g., Graham, 2002; Kormendy et al., 2009) and our procedure may start excluding those when they become consistent with exponential profiles. Selecting a reliable sample of fainter elliptical galaxies would require more information than we use here.
3.2. Local environment
There are various ways to define the local environment of a galaxy (Bernardi et al., 2003a; Eisenstein et al., 2003; Balogh et al., 2004; Park et al., 2007; Schawinski et al., 2007). For instance, parametrizing the environment with local density separates the central and the outer regions of a cluster, while using group membership can separate galaxies associated with groups from those isolated in the field. Here, we will compare galaxies in groups to isolated field galaxies.
We use a Friends-of-Friends (FoF) grouping algorithm to define groups. We choose linking lengths to be Mpc and Mpc () in the angular and line-of-sight directions, respectively. We choose the linking lengths to be short enough to break filaments into knots, but not too short to only select the galaxies in the center of any groups. The line-of-sight linking length is small compared to other implementations in the literature (e.g., Goto, 2005; Berlind et al., 2006); for example, Berlind et al. (2006) use . We explain below why we make this choice.
We define the groups based on the LowZ sample, which includes the RC3 catalog galaxies necessary to ensure completeness at the bright end. However, consistently finding groups across redshift requires a volume-limited sample. At the faint end, the flux limit of the SDSS spectroscopic survey is , which corresponds to at . We therefore only include galaxies in LowZ brighter than in our FoF analysis. The resulting environmental sample (Environ) has galaxies in total. In our Elliptical sample, there are only galaxies fainter than ; the velocity dispersion cut thus has provided roughly a volume-limited sample. In the following sections, we do not consider these faint ellipticals when studying stellar populations.
We divide galaxies into three broad categories: rich group, poor group, and field. Rich-group galaxies are in groups with at least members, poor-group galaxies are in ones with members, and field galaxies are the sole members of their group. We note that the line-of-sight linking length () we adopt is relatively small compared to the typical velocity dispersion of clusters. This choice may result in identifying a galaxy associated with a group as an isolated galaxy. Therefore for each rich group we define an ellipsoid with radius Mpc in the angular direction and radius in the line-of-sight direction. For each poor group, we also define such an ellipsoid but adopting a slightly smaller radius in the line-of-sight direction. If an isolated galaxy lies within the ellipsoid of any group, we consider its group classification to be ambiguous. There are ambiguous galaxies in total, of them with possible association with rich groups and with poor groups. Including them either in the sample of field galaxies or group galaxies does not affect any of our results; therefore, we exclude them from further analysis.
In §4 we study the environmental dependence of the stellar populations of our sample. However, it is important to exclude low signal-to-noise ratio () spectra and strong AGN. We thus will not consider galaxies with spectra of median (per pixel) less than . To exclude strong AGN, we use a standard emission line diagnostic diagram (Baldwin et al. 1981, BPT). For galaxies with emission lines , [O III] , and [N II] of , we exclude them if they appear to the right of the demarcation line defined by Kauffmann et al. (2003) in the BPT diagram. We exclude strong AGN in this process, which we have verified does not affect the analysis presented below.
To summarize, after excluding galaxies with (16), spectra of low (4), strong AGN (39), and galaxies with ambiguous group association, out final Elliptical sample consists of field elliptical galaxies, poor-group galaxies, and rich-group galaxies.
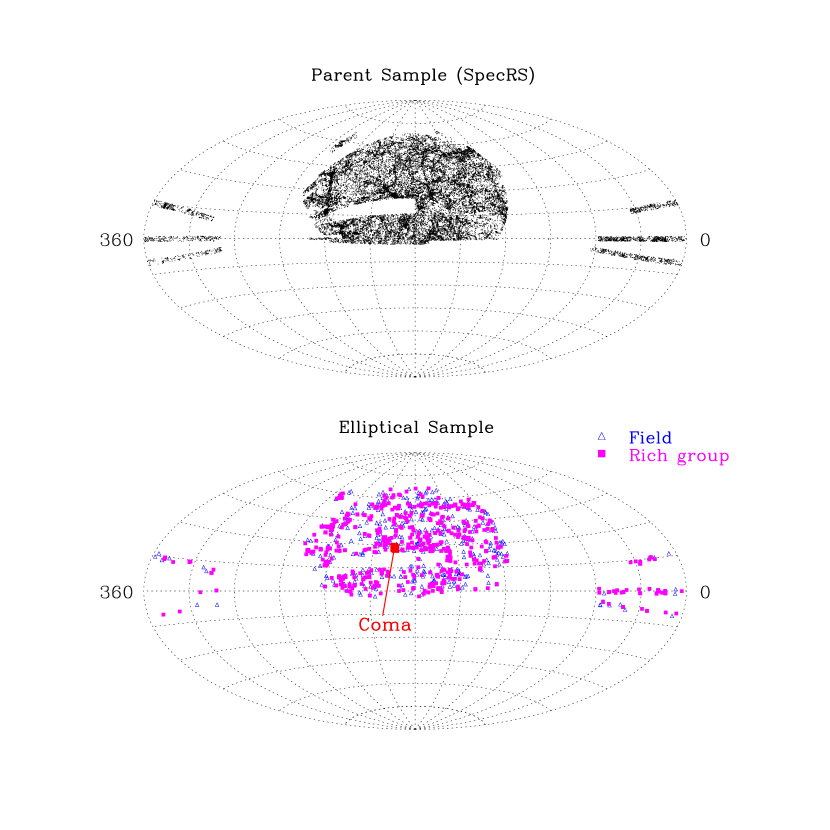
Figure 5 shows the angular distribution of the Elliptical sample. In the top panel, we show the distribution of the red-sequence galaxies in the parent SpecRS sample. In the bottom panel, we show the distribution of part of the Elliptical sample, where we represent field galaxies as blue open triangles, and rich-group galaxies as magenta small solid squares. We also show the position of the largest group, the Coma cluster as a large red solid square.
4. Stellar populations of elliptical galaxies
In this section, we study the stellar population of our Elliptical sample as a function of and environment with average optical spectra and Lick indices.
4.1. Average spectra
4.1.1 Stacking method
We stack the spectra in various samples of velocity dispersion and group classification, as described throughout. There are three versions of stacks we make here: unsmoothed, smoothed, and uniform stacks.
For each sample, we create at least the unsmoothed and smoothed average spectra. In the unsmoothed version, we do not smooth individual spectra before averaging them. In the smoothed version, we first smooth each spectrum to the largest in that sample. The unsmoothed version allows us to see more details that are washed out in the smoothed version, while the smoothed version allows us to compare samples across different environments consistently.
For samples in different bins, we also calculate a uniform version by smoothing each individual spectrum to , to match the largest in the whole sample. These stacked spectra allows us to compare different samples as a function of velocity dispersion consistently. We use this uniform version to measure the Lick indices for the average spectra in the following sections ( and ).
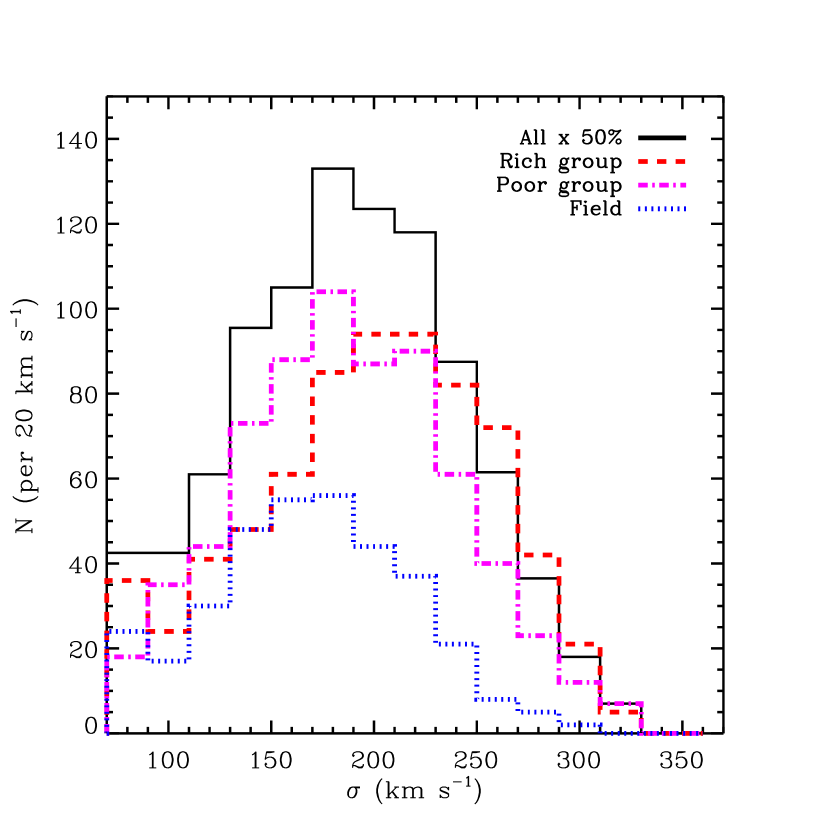
Figure 6 shows the velocity dispersion distribution as a function of group classification. The galaxies in rich groups tend to have higher than those in low-density environments. As we show explicitly below, and is already well known, the properties of elliptical galaxies depend strongly on and luminosity. For instance, the color of elliptical galaxies is redder at higher luminosity and larger (Figure 3; e.g., Baum 1959).
Thus, to make a direct comparison between samples in different environments, we need to ensure that we compare samples with the same distribution — otherwise we will simply be measuring the dependence on itself, which dwarfs all other effects. To do so, we weight the galaxies as a function of in order to achieve the same effective distribution for each subsample. Within each environmental subsample, for a galaxy with a certain , we determine the number of galaxies within in both the full sample and in the subsample. We then weight each spectrum in the stack by the number in the full sample divided by the number in the subsample. In this way, the different environmental samples have the same effective distribution. This procedure allows us to separate the environmental dependence from the dependence.
The SDSS spectra are observed between wavelengths of Å and Å. Because our redshift limit is , for consistency we calculate the average spectra in the rest-frame wavelength range available for all galaxies, from Å to Å. Before stacking the spectra, we also normalize each spectrum to its mean flux between Å and Å, where the spectra are relatively flat.
The spectrophotometry555http://www.sdss.org/dr6/algorithms/spectrophotometry.html in the SDSS is calibrated with F8 subdwarfs and is accurate at the few percent level. In any case, our differential results between different environments and velocity dispersion samples are largely unaffected by systematic errors, unless their strength correlates with those parameters, which is unlikely.
4.1.2 Velocity dispersion dependence
Figure 7 shows the average unsmoothed spectra as a function of . We overplot two horizontal lines at and in each panel to guide the eye. We define the bins to be roughly equal size in log space. The three bins (in ) are [, ], [, ] and [, ]. The median in each bin are , and , respectively. The average spectra at all are typical of an old stellar population, with strong absorption features such as the Å break (mainly caused by the CaII H and K lines), the G-band at Å, the Å MgI and H feature, the Å Na I and the Å TiO lines. Though we have excluded strong AGN when calculating the average spectra, weak emission features such as are still visible, though at a fairly weak level. They can either be caused by low-level star formation or weak AGN activity. Line ratio diagnostics show that some of the elliptical galaxies with emission are LINER-like (see also, e.g., Yan et al., 2006; Graves et al., 2007) while others show signs of ongoing star formation.
Not surprisingly, we see a clear dependence on velocity dispersion of the average spectra (which is why correcting for the distribution is so important when studying environmental effects). The average spectra in lower bins are relatively bluer than those in higher bins, which is consistent with the color-magnitude relation (e.g., Visvanathan & Sandage, 1977; Strateva et al., 2001; Hogg et al., 2004; Baldry et al., 2004; Balogh et al., 2004, among many others). We examine this result in more detail in Figure 8, where we show the ratio of the average spectra (uniform version) of all galaxies within different bins to that of the whole sample. We find that lower- galaxies exhibit a bluer continuum, weaker metal absorption features and slightly stronger emission lines (e.g., ).
However, the cause of the bluer continuum for elliptical galaxies at lower is less clear. The primary difficulty in interpretation is the well-known age-metallicity degeneracy in stellar population analysis (e.g., Faber, 1972, 1973; Oconnell, 1980; Rose, 1985; Renzini & Buzzoni, 1986; Worthey et al., 1994; Bruzual & Charlot, 2003). Both increasing age and increasing metallicity have extremely similar effects on the spectral energy distributions (SEDs). This similarity means that either a younger population or a lower metallicity population (or some combination) can be responsible for the bluer continua of elliptical galaxies at lower . Furthermore, the presence of metal-rich, old blue horizontal branch stars (e.g., Sweigart, 1987; Lee et al., 1990, 1994) can mimic a younger stellar population and introduce more flux at the blue end as well (e.g., Yi et al., 1997; Maraston & Thomas, 2000; Lee et al., 2000; Conroy et al., 2010). Blue stragglers (e.g., Bailyn, 1995; Brown et al., 2005) that extend blueward and brightward of the main-sequence turnoff point may also have a non-negligible effect on integrated spectra (e.g., Xin & Deng, 2005; Conroy et al., 2010). Stronger AGN activity or less dust extinction can also cause the same effect.
Because of these effects, we cannot be certain what is responsible for the velocity dispersion dependence in the average spectra. However, the stronger emission lines, part of which certainly is due to star formation activity, and the weaker metal absorption features suggest that both younger ages and lower metallicities are responsible for the bluer continuum at lower .
4.1.3 Environmental dependence
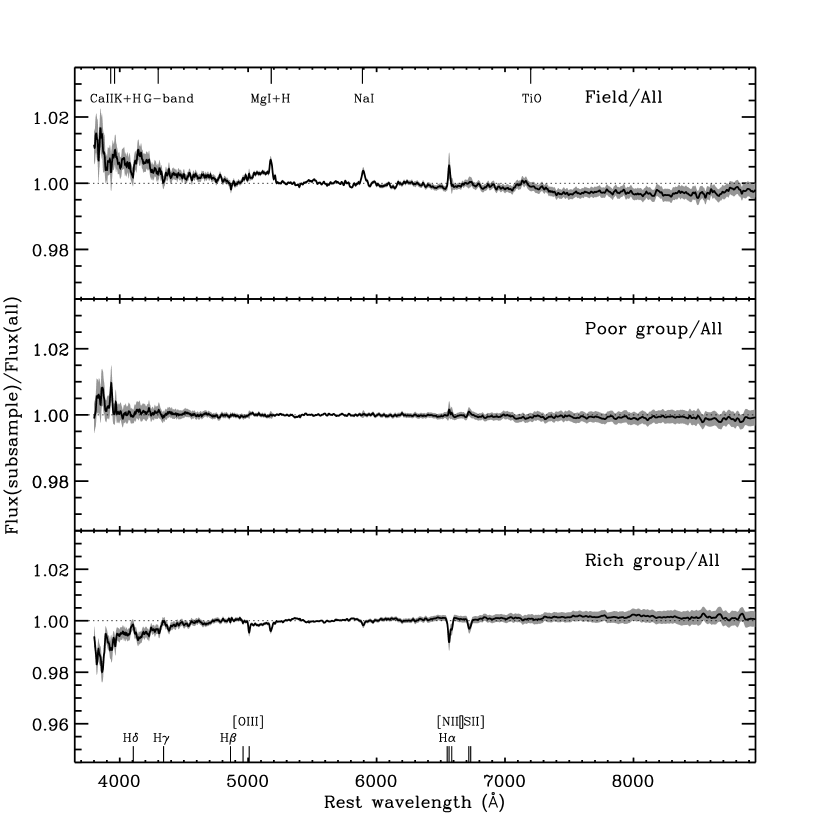
Figure 9 shows the average unsmoothed spectra as a function of environment. Recall, in these stacks we have weighted the spectra so that the effective distributions are the same; otherwise, stronger trends would be visible due to the correlation of with environment. The average spectra for all the environmental samples look strikingly similar to each other. These spectra reveal that old stellar populations dominate the stellar components in elliptical galaxies in all environments.
Although by eye the average spectra for all the samples look exactly the same, careful inspection shows subtle variations. In Figure 10, we present the ratio of the average spectra (smoothed version) of different samples in different environments to that of the whole sample. We find weak but significant differences between the average spectra in different environments. Compared to the average spectra of the whole sample, the field galaxies have a bluer continuum, especially at wavelength Å, by percent, and have stronger (but still weak) emission lines of , [O III] , , [N II] and [S II] etc. The rich-group galaxies, on the other hand, have a redder continuum and have less flux at the blue end by percent, and have weaker emission lines.
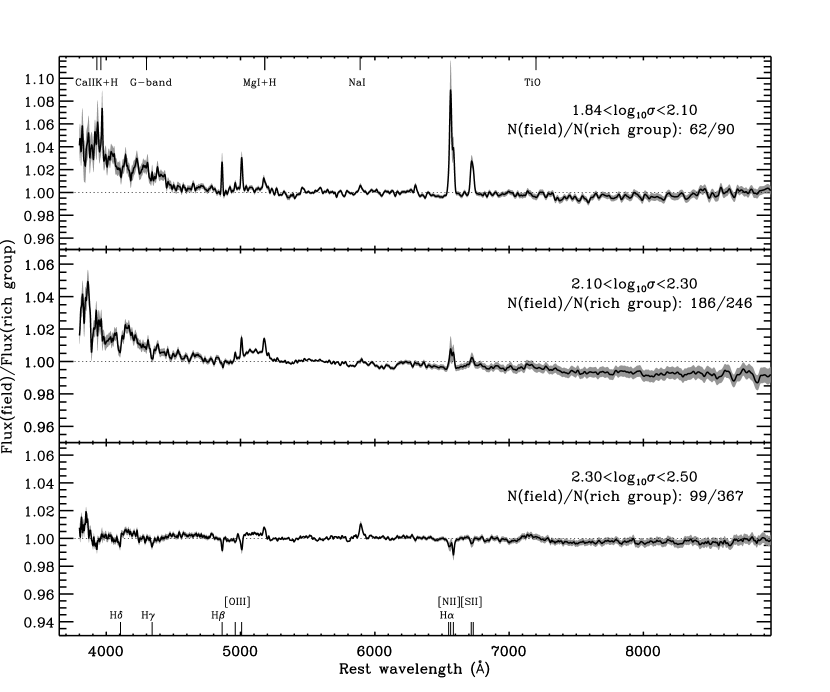
To further inspect the environmental dependence, we compare galaxies in different environments in each bin of velocity dispersion. In Figure 11, we show for each bin the ratio of the average spectrum (uniform version) of the field galaxies to that of the rich-group galaxies. Interestingly, we see that in all three bins, the average spectra of the field galaxies are bluer than their rich-group counterparts. However, the weak environmental dependence appears to be a strong function of . In the lowest bin, the field galaxies have about 5% more flux at the blue end than the rich-group galaxies. In the highest bin, the field galaxies have only about percent more flux at the blue end than the rich-group galaxies. The stronger emission lines in the low- field galaxies also appear to vanish for the high- field galaxies.
As was the case for the dependence on , the cause of the weak environmental dependence of the average spectra is not absolutely clear. However, the difference in emission lines suggests that stronger (but still low-level) recent star formation could be the cause of the bluer spectra in the field galaxies. In the next subsection, we examine this hypothesis more carefully.
4.1.4 Discussion: stronger low-level recent star formation activity at lower velocity dispersion and in the field?
Physical degeneracies make it difficult to derive accurate stellar population properties from the spectra of galaxies with certainty — such attempts suffer from the age-metallicity degeneracy, the possibility of poorly understood blue horizontal branch and/or blue straggler populations, and other effects. In this section we take a simplified view and evaluate what kind of young stellar population would be necessary to explain the observed trend of SED with environment.
First, we assume that elliptical galaxies consist of an old base stellar population and a small frosting of young stars from low-level recent star formation (e.g., Trager et al. 2000a; Gebhardt et al. 2003; S07). Furthermore, we assume that the strength of the recent star formation is the main factor that causes the dependence and the environmental dependence.
Under these assumptions, we fit each individual spectrum with a model consisting of a simple combination of old and young stellar populations. The old components consist of old stellar populations with ages and metallicities as follows: Gyr and solar abundance (); Gyr and ; and Gyr and . The young components consist of young templates with ages and metallicities as follows: Gyr and , Gyr and , and Gyr and respectively. All these templates are from Bruzual & Charlot (2003) SSP models with the Padova (1994) library of stellar evolution tracks (e.g., Alongi et al., 1993; Bressan et al., 1993; Fagotto et al., 1994a, b; Girardi et al., 1996) and the Chabrier (2003) initial mass function from to . For each individual galaxy spectrum, we mask out the emission line regions and fit the continuum to a nonnegative linear combination of these six templates.
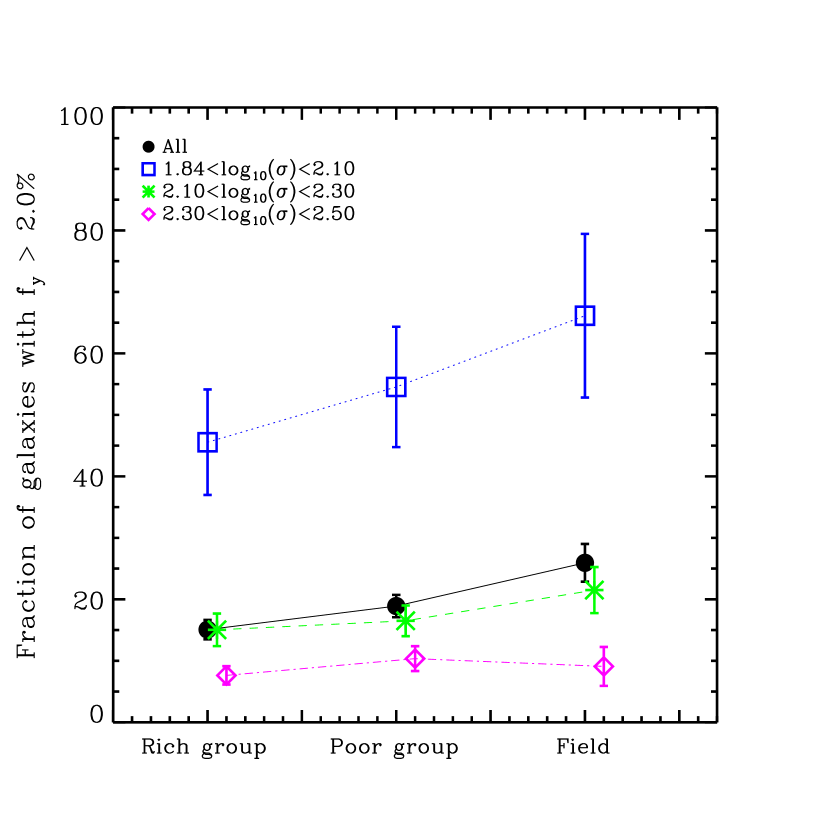
We evaluate how much recent star formation there is by comparing the resulting mass fraction contained in the young templates in the fits. We choose to be the minimum fraction of the young component at which we consider the recent star formation to be significant. This choice allows a convenient comparison with previous work using GALEX NUV photometry. For reference, gives the color NUV, which is the color cut adopted by Schawinski et al. (2007) to indicate recent star formation.
In Figure 12, we show that the fraction of galaxies with significant recent star formation () is a strong function of both environment and velocity dispersion. Overall, about of the elliptical galaxies have more than of the mass contributed from the young components. In the lowest bin, about half of the elliptical galaxies have more than young components. Meanwhile, in the highest bin, only have . The fraction of galaxies with recent star formation also appears to be larger for the field galaxies than the rich-group galaxies, by in the lowest bin. As suggested by the average spectra, the environmental difference vanishes in the highest bin (Figure 11).
Interestingly, our results agree reasonably well with previous work (e.g., Schawinski et al., 2007). Using GALEX NUV photometry of a sample of bright early-type galaxies with , most of which are elliptical galaxies, selected in the SDSS in the redshift range , Schawinski et al. (2007) find that of massive early-type galaxies have NUV color bluer than . They also show that the fraction is higher in the lowest-density environment, which is defined based on the number and distance of galaxies around each object (the density). Despite the differences in the definition of environment, as well as the different samples and data used, our results are in fair agreement with each other. However, they did not see the luminosity/mass dependence that we see here, probably because of their smaller sample size and luminosity range.
Using a sample of early-type galaxies at from MOSES, Thomas et al. (2010) find that the distribution of ages is bimodal with a strong peak at old ages and a secondary peak Gyr younger containing percent of the objects. Interestingly, they find that the fraction of young galaxies increases with decreasing galaxy mass and decreasing environmental density. They also find that the environmental dependence is most pronounced at low and disappears at high (see Fig. in their paper). Despite the considerable differences in sample selection and analysis, our results are remarkably consistent with one another. Thomas et al. (2010) further show that the young galaxies have lower ratios than average and most of them show signs of ongoing star formation through their emission line spectra, in line with our conclusion that recent star formation is likely the cause of the environmental dependence at low .
We emphasize that we have assumed that age is the dominant factor that determines the shape of the optical SED. The dependence on velocity dispersion and environment could also be caused by differences in metallicity, differences in the contribution from blue horizontal branch stars or blue stragglers, or perhaps something else. To accurately interpret the spectra is an extremely difficult task due to the lack of calibration data (see the recent reviews by Conroy et al. 2009, 2010; Conroy & Gunn 2010 and references therein).
Nevertheless, recent detailed studies show that star formation indeed occurs in many early-type galaxies (Yi et al., 2005; Rich et al., 2005; Kaviraj et al., 2007; Schawinski et al., 2007; Temi et al., 2009; Young et al., 2009; Salim & Rich, 2010). Salim & Rich (2010), using high resolution far-UV (FUV) imaging with the Solar Blind Channel of the Advanced Camera for Surveys onboard the HST, show that for most early-type galaxies with recent star formation, it takes the form of wide or concentric UV rings. The SAURON team (Shapiro et al. 2010, see also Kuntschner et al. 2010), find that star formation in early-type galaxies happens exclusively in fast-rotating systems and occurs in two distinct modes. In one mode, star formation is a diffuse process, corresponding to widespread young stellar populations and high molecular gas content, possibly due to (mostly minor) mergers (see also Kaviraj et al., 2009). In the other mode, star formation is concentrated into well-defined disc or ring morphologies, which may have been caused by rejuvenations within previously quiescent stellar systems. Indeed, Kuntschner et al. (2010) find that the most extreme cases of post-starburst early-type galaxies, with SSP-equivalent ages of Gyr, frequently show signs of residual star formation and are generally low-mass systems. Therefore, variations in recent star formation is a plausible cause for both strong velocity dispersion dependence and weak but significant environmental dependence we see here.
4.2. Lick indices
The age-metallicity degeneracy has haunted stellar population analysis for decades. Nevertheless, a promising approach to breaking it remains the combined use of multiple absorption-line indices (e.g., Faber et al., 1985; González, 1993; Worthey et al., 1994; Worthey & Ottaviani, 1997; Trager et al., 1998). In this and the next section we measure the absorption-line indices of our spectra and compare them with state-of-the-art SSP models in order to infer their ages, metallicities, and enhancements.
4.2.1 Lick indices of smoothed flux-calibrated spectra
Lick indices measure the absorption-line strength of features in the SEDs and are widely used in studying stellar populations. The standard Lick indices are measured on low-resolution spectra that are observed with the Lick IDS instrument and not flux-calibrated. The SDSS did not observe the bright stars in the Lick library; therefore we cannot match the fluxing and calibration of the Lick system. Therefore we attempt an intermediate step by measuring the Lick indices of smoothed flux-calibrated SDSS spectra.
The bandpasses of the Lick indices studied here are defined in Table 1 of Worthey et al. (1994) and Table 1 of Worthey & Ottaviani (1997). To calculate the Lick indices, we first smooth each spectrum to a resolution that is equivalent to a velocity dispersion of , as observed under the SDSS resolution (), to match the largest of our sample. We then calculate the Lick indices with a modified version of the Lick_EW routine in Ez_Ages666http://www.ucolick.org/graves/EZ_Ages.html package developed by Graves & Schiavon (2008). The Lick_EW routine reports the errors of each Lick index calculated in the way suggested by Cardiel et al. (1998).
The combined resolution of and the instrumental resolution of the SDSS () is at lower resolution than the Lick IDS instrument resolution at which the Lick indices are defined. We therefore need to correct the measurements back to the effective Lick IDS resolution. To do so, we use the correction factors given by S07 in their Table 46, which are for a Gyr old stellar population with solar metallicity. The factors vary at the few percent level for stellar populations with different ages and metallicities; we ignore those tiny differences here. We also note that these empirical corrections for may have large uncertainties (e.g., Trager et al., 1998), which unfortunately are hard to quantify and we also ignore here.
In the end, the Lick indices measured in this way are matched in resolution, but still not with the fluxing of the Lick IDS system. S07 gives empirical zero-point corrections (Table in their paper). When necessary, we adopt these corrections to compare flux-calibrated Lick indices with standard ones. These corrections have very large uncertainties; therefore we remind our readers that any comparison of our measurements with the standard Lick indices should be taken with some caution.
4.2.2 Emission line infill correction
One of the most challenging issues in Lick index measurements is emission line contamination. The Balmer absorption features are contaminated by emission from ionized gas, either from star formation, AGN activity, or interstellar shocks. This emission line infill severely affects the measurement of the Balmer indices, which are thought to be the best age indicators. For example, a Å contamination to the absorption-line equivalent width (EW) of from emission translates to an SSP age Gyr older (e.g., S07).
We correct for emission-line contamination using [O III] , which is correlated with the Balmer emission. Similar to the template fitting in , for each individual spectrum, we mask out the emission line regions and fit the continuum to a nonnegative linear combination of a set of SSP templates. Unlike in , where we only use models of old and young stellar populations, we here use more templates, including some of intermediate age as well. We then subtract the best-fit model and measure the flux and equivalent width (EW) of [O III] , which is more reliable than the direct emission measurement. We then correct for the emission line assuming ([O III] ) (see, e.g., González, 1993; Trager et al., 2000b). We also correct and for emission assuming the decrements and . For reference, the median correction for all galaxies in the Elliptical sample is Å, Gyr in SSP analysis.
We emphasize that the corrections we adopt are by no means perfect. The relation between and [O III] has a large scatter (see also, Trager et al., 2000b; Mehlert et al., 2000; Nelan et al., 2005; Kuntschner et al., 2006). For EW([O III] ) Å, an error of in the conversion factor translates to Å in the measurement. On the other hand, the [O III] has been widely used in the literature and is reliable to measure.
Another way to correct for the emission is to use emission measurements, by adopting the intrinsic Balmer decrement / and a reasonable dust extinction (e.g., Graves et al., 2007). If dust is well-behaved, this relationship should be tighter than that for [O III] . However, the and emission lines are entangled with the underlying stellar absorption feature. In fact, they are almost impossible to measure reliably if they are relatively weak ( Å), which is the case for most of our spectra. In particular, because measuring the emission lines requires modeling the stellar continuum, using corrections based on tends to merely recover the H index of the continuum template itself.
Here we estimate the emission line infill using [O III] because the line is easier to measure independently of the stellar continuum, and because its intrinsic scatter is less important due to the large sample size in our case. In any case, we have tried using by adopting E(-) mag and find that the dependence of H absorption-line strength on and environment is basically not affected.
4.2.3 Velocity dispersion dependence of Lick indices
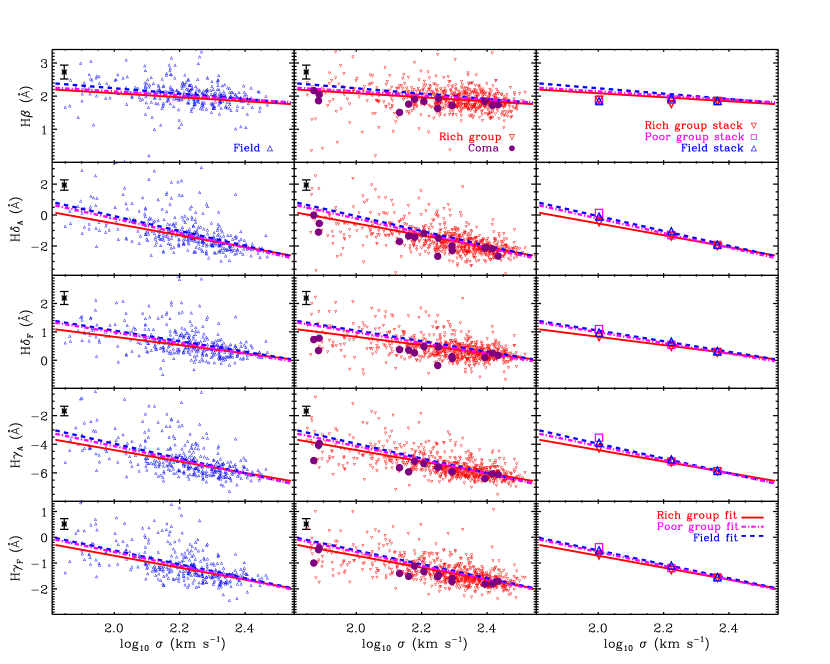
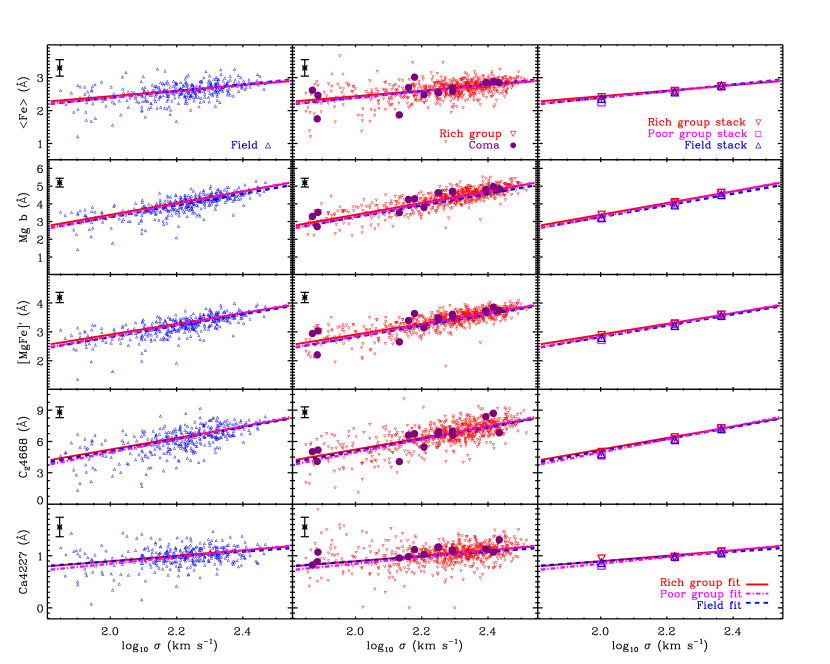
Figures 13 and 14 present our Lick index measurements as a function of velocity dispersion and environment. Figure 13 shows the Balmer absorption lines: , , , , and . Figure 14 shows the metallicity indicators: , the average of 5270 and 5335, , , 4668, and 4227. The index is defined as follows:
is a good metallicity indicator almost independent of ratio variations (TMB). The left columns of these figures show the field galaxies and the middle columns show the rich-group galaxies. We single out the Coma galaxies in the middle column and show them separately. We exclude the poor-group galaxies in these two columns, though we do show linear fits to their distribution. We also show the indices measured on the average spectra in the right column.
The most obvious feature from these plots is the strong index- relation, which has been studied intensively in numerous works (e.g., Terlevich et al. 1981; Gorgas et al. 1990; Guzman et al. 1992; Bender et al. 1993; Jørgensen 1997; Bender et al. 1998; Bernardi et al. 1998; Colless et al. 1999; Jørgensen 1999; Concannon et al. 2000; Kuntschner 2000; Poggianti et al. 2001; Proctor & Sansom 2002; Bernardi et al. 2003b; Caldwell et al. 2003; Worthey & Collobert 2003; Mehlert et al. 2003; Nelan et al. 2005, T05). We perform a linear least-squares fit to each distribution with the following form:
| (4) |
and list the results in Table 2. We show these fits in each panel of Figures 13 and 14 for all three group classifications.
All the Balmer indices strongly anti-correlate with (). Their strength is weaker at higher , indicating older ages or weaker recent star formation for more massive elliptical galaxies. Of these indices, is the one most investigators rely on as the best age indicator, despite the fact that it is the one with the most significant emission line contamination issues. In particular, it is less sensitive to metal lines than are other Balmer lines (e.g., Korn et al., 2005).
The right column of Figure 13 shows the measurements of the average spectra. All such measurements appear to follow the best-fit scaling relations very well except for the measurement in the lowest bin. This discrepancy is possibly due to strong Balmer emission compared to the [O III] , which makes the emission correction underestimated.
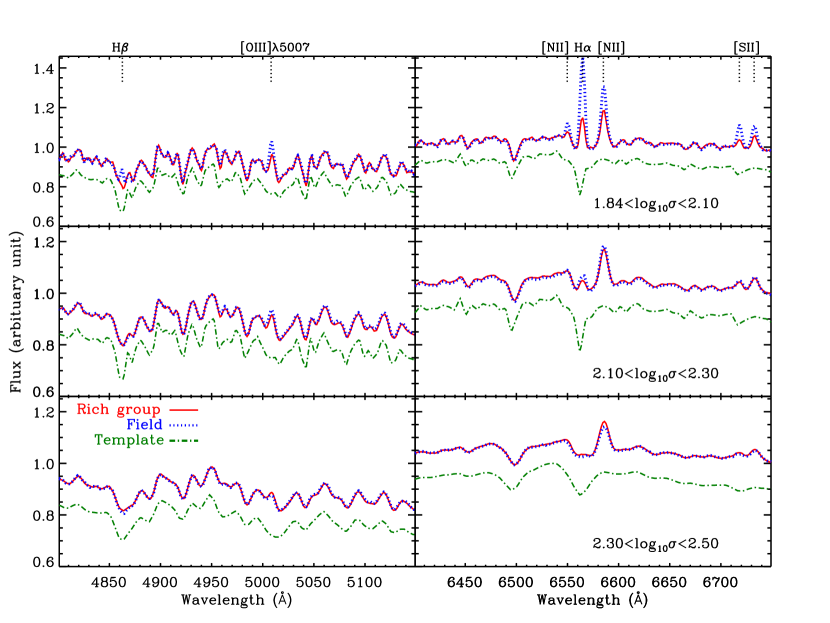
In Figure 15, we take a closer look at the average spectra within the wavelength range containing , [O III] and , where we also overplot the best-fit template to the continuum for the rich-group galaxies. The Balmer emission lines are indeed very strong compared to [O III] in the average spectra of the lowest bin, especially for the field galaxies. Specifically, direct measurements for the field galaxies yield EW() Å and EW([O III] )= Å. Using [O III] gives the correction Å, while using gives Å, larger by Å.
These average spectra are each stacked from spectra of galaxies: thus, one galaxy with very peculiar emission lines can introduce such a feature in the average spectra. In contrast, the fit to the scaling relation is less affected by a single data point outlier, so we will rely below extensively on the scaling relation. These results emphasize that achieving the emission line infill correction at the required level of precision is extremely difficult!
All the metallicity indicators, , , , 4668, and 4227, correlate with (), though to varying degrees. The increasing strength with increasing indicates higher metallicity for more massive elliptical galaxies. The tight relation with of (slope ) is much stronger than that of (), implying a higher [Mg/Fe] ratio for more massive galaxies. Another -element indicator 4668 also appears to be more strongly correlated with than with a slope . Taken together, these results are evidence of stronger in more massive elliptical galaxies. In fact, T05 show that increasing metallicity, and older age account for the Mg- relation by , and respectively (see also Mehlert et al., 2003). The dependence of 4227 on appears to be much weaker than other -elements, with a slope , which implies that more massive galaxies may be more calcium-underabundant (see, e.g. Thomas et al., 2003a).
To summarize, we see signs that the stellar populations in more massive elliptical galaxies are older or with weaker recent star formation, more metal-rich, and more strongly enhanced, as has been found in the past. We will come back to this in the next sections when we interpret our index measurements using SSP models.
4.2.4 Environmental dependence of Lick indices
Figure 13 shows that the Balmer index- relation for elliptical galaxies varies as a function of environment. The Balmer lines are systematically stronger ( Å for ) in field galaxies than in rich-group galaxies. The difference vanishes at high . This agrees well with the environmental dependence we see in the continua of the average spectra (Figures 10 and 11). We also find that the Coma galaxies in our sample all have weaker Balmer lines than average.
Balmer indices are thought to be the best age indicators because massive stars (e.g., A stars) in a young stellar population exhibit strong Balmer-line absorption in their integrated spectra. The environmental dependence thus suggests that the stellar populations in field galaxies are in general younger than those in group galaxies.
In contrast, the distributions of metallicity indicators are remarkably similar for elliptical galaxies in different environments. The index is nearly identical for all the samples. The -element indices seem to be slightly stronger in rich-group galaxies, but only at a barely detectable level (as seen previously by, e.g., Bernardi et al. 1998). However, the same index measurement does not necessarily mean the same metallicity. At a given , if group galaxies are older than field galaxies as the Balmer indices indicate, then having the same metallicity index strength means they are more metal-poor.
In this section, we studied the Lick indices, their relation with , and their environmental dependence. Consistent with previous studies, we have found strong index- relations, indicating higher metallicity, stronger and older ages for more massive elliptical galaxies. We have also found that Balmer indices are systematically weaker in group galaxies, implying older ages for group galaxies. We do not see an obvious dependence on environment for . The -element indices (, 4668 and 4227) show slightly stronger absorption in group galaxies, but only at a barely detectable level. This result suggests that group galaxies are slightly more iron-poor and slightly more strongly enhanced than field galaxies.
However, to convert the measurements to more quantitative parameters of the stellar populations introduces the uncertainties associated with the stellar population synthesis. Later in the paper, we will nonetheless make an attempt to use state-of-the-art SSP models to study the stellar populations in elliptical galaxies.
4.2.5 Systematic Uncertainties
We conclude this subsection by summarizing the systematic uncertainties affecting our Lick index measurements.
We measure the Lick indices on the flux-calibrated spectra that are smoothed to under the SDSS resolution . We have used empirical corrections to correct the indices back to the effective Lick IDS resolution. However, the corrections may have large uncertainties (Trager et al., 1998). The standard Lick indices are measured on spectra that are not flux-calibrated. Therefore, any direct comparison of our measurements with standard ones should be taken with caution.
The SDSS spectra are taken with fibers that enclose an aperture with a diameter of . Since we limited our sample to be lower than redshift , the spectra are of the central region of the galaxies. The velocity dispersion is therefore essentially the velocity dispersion in the central region. For galaxies of different angular sizes, the aperture therefore encloses the central regions of different sizes. Recent work has shown that the radial profile of follows a power law where is radius and the index to (e.g., Jørgensen et al., 1995; Mehlert et al., 2003; Cappellari et al., 2006). The effective radii of the Elliptical sample have a median value . If we correct all the to that at effective half light radius with such a scaling relation, this translates to a difference of ; this small effect should not affect the analysis presented here.
The Lick indices measured here also come from the spectra of stellar populations in the central regions, with a much smaller fraction from those in the outer region within the aperture. The Lick indices also probably correlate with radius, and the gradients of indices such as and seem to correlate with that of as well. On the other hand, is roughly constant with radius (e.g., Mehlert et al., 2003; Kuntschner et al., 2006; Sánchez-Blázquez et al., 2006a; Rawle et al., 2010). The correlations are still poorly understood and we do not correct for them.
Finally, the emission line infill correction for the Balmer indices of an individual spectrum is extremely difficult, even in the case of stacked spectra with galaxies — one galaxy with a peculiar emission line ratio can introduce strong errors in the correction. Nevertheless, we are using [O III] to correct Balmer emission lines, which should be a good compromise for such a large sample. We also have tried using too, which basically does not affect the relative dependence on and environment.
All of these factors may introduce some errors at the few percent level in our measurements. We do not expect they introduce any significant systematic bias in the differential aspect of our analysis, because they should not correlate strongly with which subsample we consider.
4.3. Comparison of Lick indices with SSP models
4.3.1 SSP models
One purpose of stellar population synthesis models is to place constraints on the history of star formation and chemical enrichment of galaxies from their integrated SEDs. We apply two state-of-the-art versions of these models to our measurements: those of TMB and S07.
There are a few caveats that make our goal very challenging. For example, age and metallicity have extremely similar effects on the color and SEDs (e.g., Faber, 1972, 1973; Oconnell, 1980; Rose, 1985; Renzini & Buzzoni, 1986; Worthey et al., 1994); Lick indices have very broadly-defined line windows which makes direct translation into element abundances difficult (e.g., Greggio, 1997; Tantalo et al., 1998; Korn et al., 2005; Serven et al., 2005); finally, many elliptical galaxies have non-solar [] which further complicates the modeling (e.g., Peletier, 1989; Worthey et al., 1992; Davies et al., 1993; McWilliam & Rich, 1994).
Recent SSP models have incorporated adjustable abundance patterns for multiple elements and allow for more reliable derivation of age, metallicity, and element ratio from absorption-line indices (e.g., Borges et al. 1995; Weiss et al. 1995; Tantalo et al. 1998; Trager et al. 2000a, TMB, Maraston 2005; Coelho et al. 2007, S07). Most of these models, however, are based on the Lick system and are not directly applicable to our data, as discussed in §4.2.1. Nonetheless, S07 provide empirical zero-point corrections to correct flux-calibrated Lick indices onto the standard Lick system (see their Table 1). We apply these corrections to our Lick index measurements when we compare them with the TMB models. The S07 models, meanwhile, are built up on flux-calibrated spectral library, so no corrections are necessary for that comparison.
The corrections necessary for the comparison to TMB have a very large scatter (see Table 1 and Figure 1 of S07). Therefore, while we will compare to TMB below, our main focus will be on the models of S07.
4.3.2 Comparison with TMB models and S07 models
Before deriving the stellar population parameters of our sample with SSP models, we first compare our measurements to the predictions of each model on grids of age, metallicity and enhancement.
One of the main differences between TMB models and S07 models is that TMB models are built at fixed metallicity [Z/H], while S07 models are at fixed iron abundance [Fe/H]. To convert between [Z/H] and [Fe/H], we adopt the relation given by TMB: [Z/H]=[F/H]+ []. Because we tie other -elements to [Mg/Fe] when building up S07 models (see next subsection), we assume [Mg/Fe]=[] in the comparison.
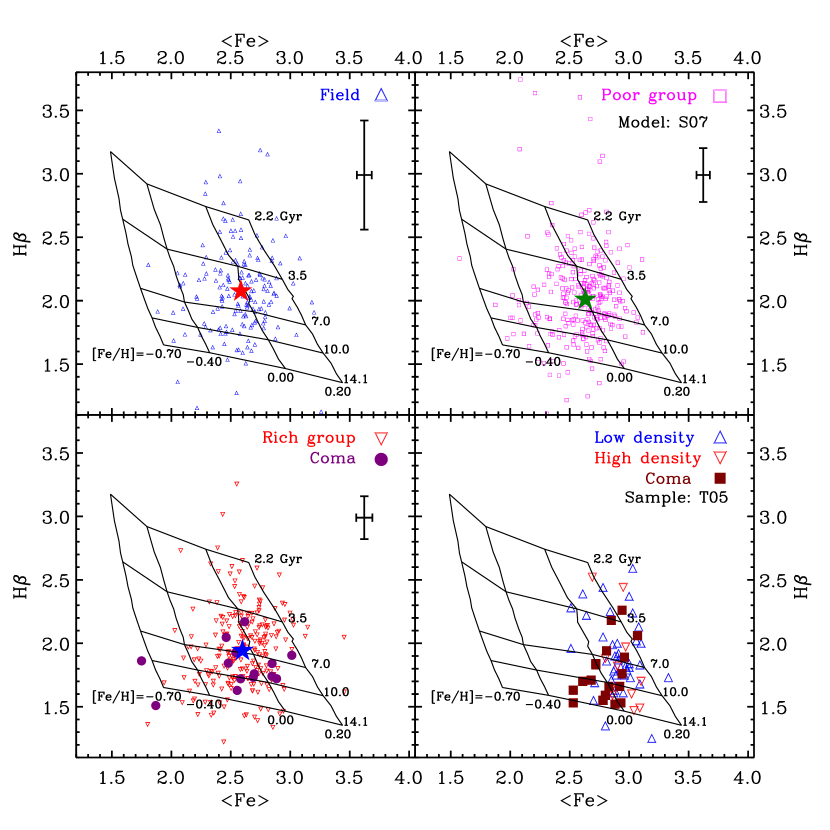
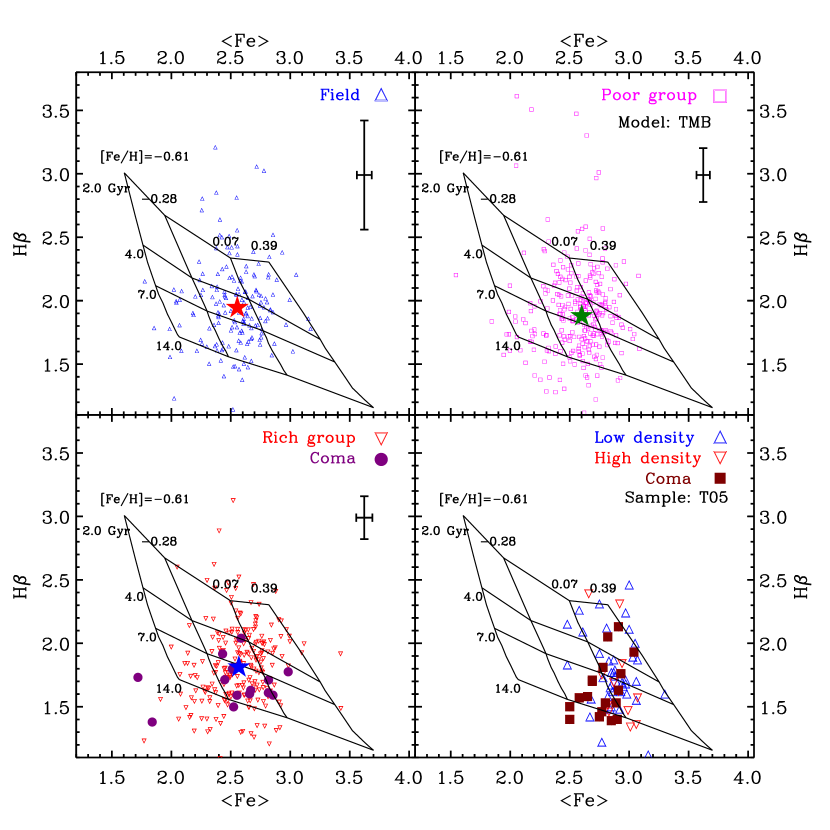
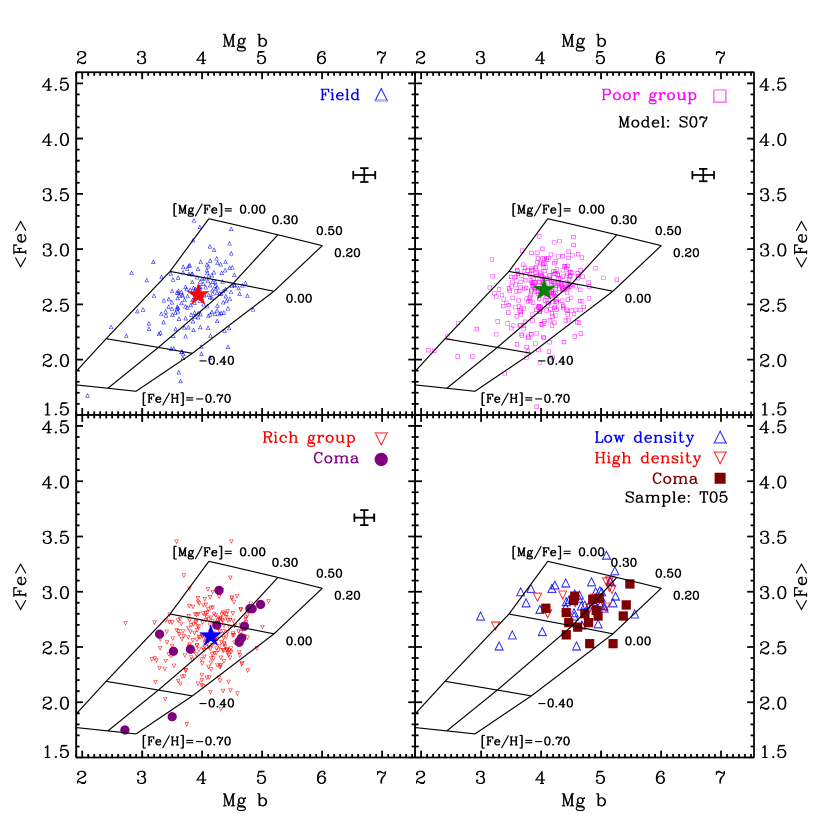
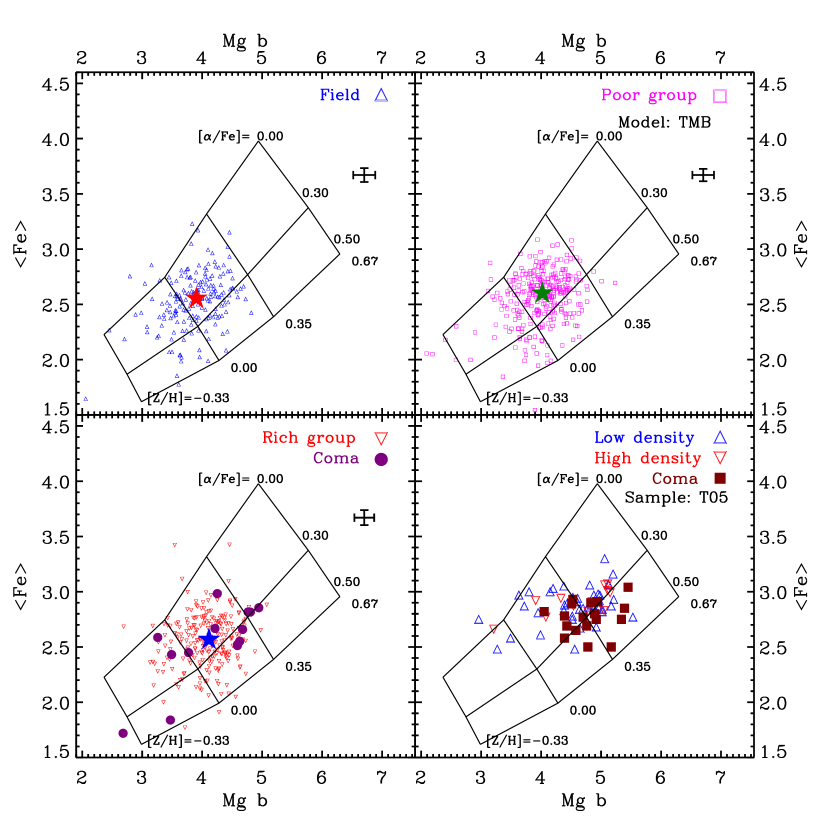
In Figure 16 and 17, we compare our measurements of versus with the S07 and TMB models assuming []=[Mg/Fe]=. We choose [/Fe]= because most elliptical galaxies have super-solar [/Fe]. In the following analysis we only use elliptical galaxies with between and (, the middle bin), to ensure that we do not confuse dependence with environmental dependence. The median values within this range are , and for field, poor-group, and rich-group galaxies, respectively. We also show the median measurements of each subsample as filled stars and the scatters as error bars below the legend. Finally, for comparison, in the lower right panel of each figure we compare the physical parameters of the galaxies in our sample to those of the early-type galaxy sample of T05.
In general, the S07 and TMB models agree well (see S07; Graves & Schiavon 2008; Kuntschner et al. 2010 for more thorough comparisons between the two models). We see that the galaxies in our Elliptical sample have a median SSP-equivalent age of Gyr. These measurements show that group galaxies, especially rich-group galaxies, appear to occupy a different locus than field galaxies. In particular, the distribution of group galaxies extends to older ages and lower iron abundance: relative to the other samples, the rich-group galaxies appear to more commonly have sub-solar iron abundance ([Fe/H]) and older age ( Gyr); meanwhile, the field galaxies are typically Gyr. This result suggests that the rich-group galaxies are slightly older and slightly more iron-poor (in terms of [Fe/H]). We also show the T05 sample in the bottom right panel and see very similar effects. Note when comparing with S07 models, we have corrected measurements of the T05 sample to the flux-calibrated indices. We also see that the Coma galaxies are systematically older than average.
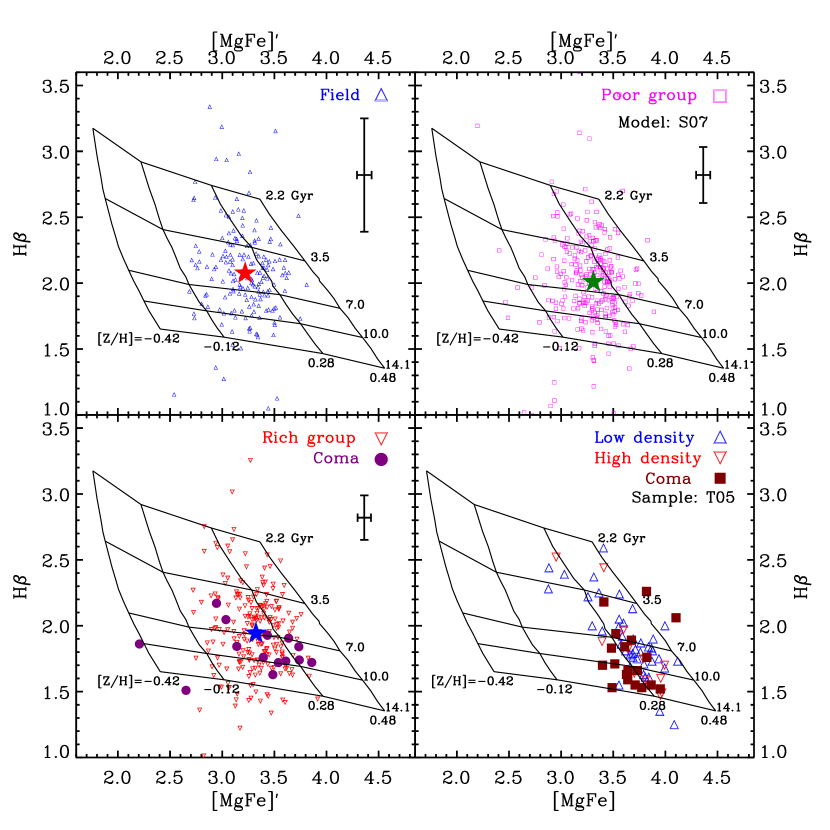
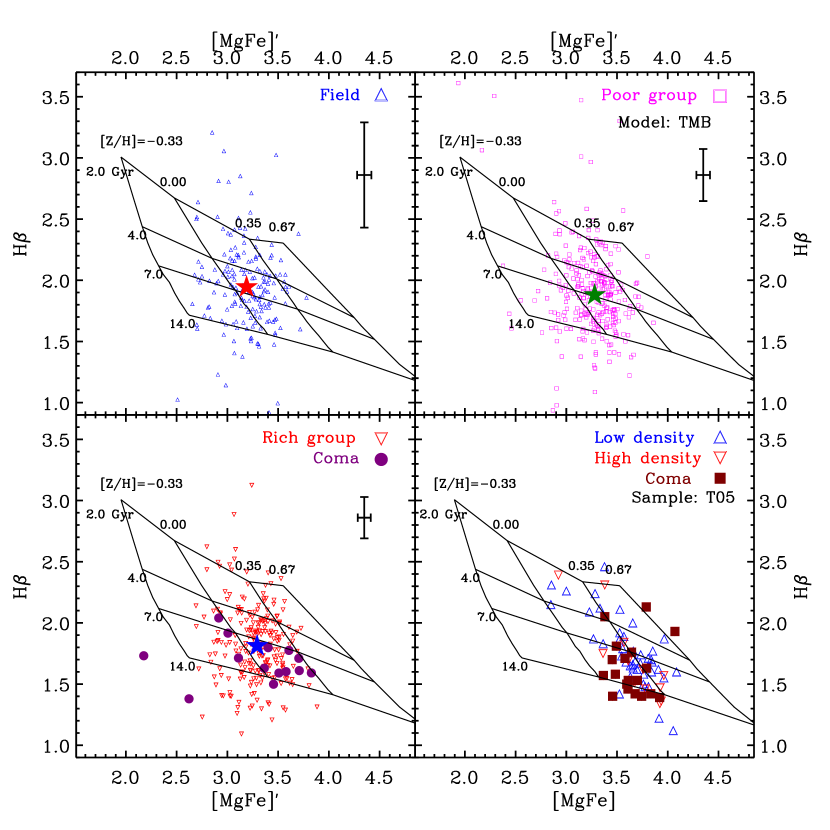
The strength of the index is mainly determined by the iron abundance. For total metallicity, is a better indicator. In Figure 18 and 19, we plot our measurements vs. against S07 and TMB models with [/Fe]=. These measurements show that in different environments the total metallicities [Z/H] are very similar. The T05 sample777The public catalog of T05 only includes the average index , so we show instead the combination =. However, the difference is very small., however, exhibit slightly lower total metallicity for ellipticals in high-density environments.
In Figures 20 and 21, we compare our measurements of and against S07 and TMB models with an age of Gyr. We see that almost all elliptical galaxies have super-solar [Mg/Fe], with a median value close to , and the elliptical galaxies in rich groups exhibiting somewhat higher [Mg/Fe]. In the lower right panel, we also show the elliptical galaxies in the T05 sample. Although T05 do not claim to see an environmental dependence in their analysis, which includes lenticular galaxies (not shown here), we see the elliptical galaxies in high-density environments in their sample also appear to be slightly more strongly enhanced.
4.3.3 SSP-equivalent parameters: age, [Fe/H], [Mg/Fe] and [Z/H]
Here, we use S07 models to derive the SSP-equivalent parameters. To do so, we create a grid of models and interpolate our results onto the grid.
First we use the deltabund code in the EZ_ages package to create SSP models on a grid of three parameters: age, [Fe/H] and [Mg/Fe]. We use the solar-scaled isochrones as suggested in the EZ_ages documentation, and the Salpeter (1955) IMF. We set [O/Fe] to be zero for these isochrones and tie other -elements to Mg. The age allowed in the models ranges from Gyr to Gyr, the [Fe/H] ranges from to and we generate models at [Mg/Fe] between and . We refer the readers to S07 and Graves & Schiavon (2008) for details about S07 models and the EZ_ages package.
Once we have all the models, we employ a two-step interpolation method to derive age, [Fe/H] and [Mg/Fe]. For each galaxy, we first calculate age and [Fe/H] using and , at all [Mg/Fe] (from -0.1 to 0.5). We then compare the pair and with models at the median age we obtained in the first step to calculate a new [Fe/H] and [Mg/Fe]. We then update the age by interpolating the ages found in the first step at the [Mg/Fe] we found in the second step and iterate the second step with the new age. The iteration usually only needs steps before fully converging. After convergence, we have the parameters age, [Fe/H] and [Mg/Fe] for each galaxy with , and . We also give [Z/H] assuming [Z/H]=[F/H]+ []. For those measurements that fall out of the model grids, we set the parameter to be the boundaries, i.e., the maximum or the minimum in the models. We have also tried using higher-order Balmer lines instead of and found very consistent results.
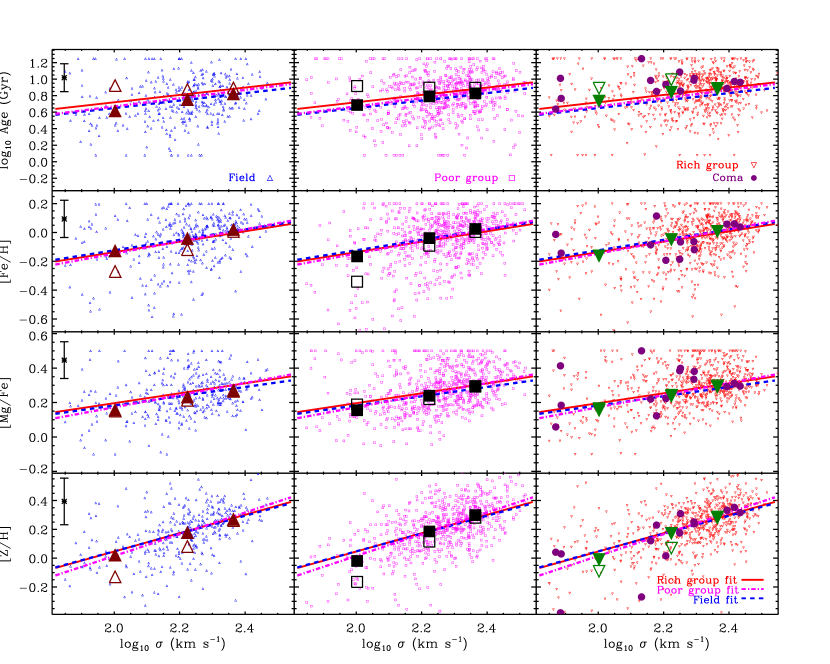
Figure 22 shows all the measurements as a function of environment and . We also overplot the derived parameters for the average spectra as large open symbols. In addition, we also show as large filled symbols the derived parameters at the same of the average spectra but assuming that the index- relations (Eq. 1 and Table 2) hold exactly.
As we pointed out above, the absorption in the average spectra is underestimated due to the underestimation of the emission correction. The derived age therefore is overestimated, and the derived [Fe/H] underestimated. For this reason, in this context we trust results based on the index- relationships more than the average spectra.
The most obvious feature in Figure 22 is the strong dependence on of all three parameters, as we expect from the index- relations (though with a large scatter due to the combined errors from the three indices). More massive elliptical galaxies are older, more metal-rich and more strongly enhanced. The environmental effect on age is also apparent: galaxies in groups appear to be older than their counterparts in the field. Meanwhile, we do not see an obvious environmental effect on [Fe/H], [Mg/Fe] and [Z/H], implying the environmental dependence of [Fe/H], [Mg/Fe] and [Z/H] is very subtle, if it exists.
To quantify the and environmental dependence of the SSP-equivalent parameters we fit the scaling relation for each distribution as a function of as follows:
| (5) |
However, we need error measurements for the derived parameters in the fitting. The errors are unfortunately more difficult to quantify.
We assume all the measurement errors are independent and propagate the errors to the derived parameters with a Monte Carlo method. To do this, we create fake measurements for each galaxy by adding Gaussian errors to the measurements of , and , and derive the new parameters for the fake measurements. We then calculate the standard deviations of the parameters of the Monte Carlo ensemble for each galaxy and quote it as the Monte Carlo error of the derived parameters.
We show the median Monte Carlo error of each parameter in the upper left corner in Figure 22. However, the individual error of each point can be heavily biased, due to edge effects on the grid. Almost all the galaxies have some simulated data points falling outside the grid. This effect is more severe for those galaxies with parameters closer to the boundaries. In the extreme case, the simulated measurements of a galaxy with index measurements lying outside the grid are almost always also outside the grid; thus, for the Monte Carlo ensemble of such a galaxy, the parameters derived with our method are almost always the same as the boundary values in the models. Therefore, the Monte Carlo errors are unrealistically small for the parameters of the galaxies with measurements close to or outside the model boundaries.
However, for most of the derived parameters that are relatively far away from the boundaries, the Monte Carlo errors are very similar. We therefore apply a uniform error (the median Monte Carlo error) to each parameter of all galaxies. We also ignore the galaxies with measurements that are out of grids when fitting the scaling relation, because they have the same values for the derived parameters (either the maximum or the minimum) at all , which will heavily skew the fitting.
Using these choices, we fit equation (5) to the derived parameters. Figure 22 shows the best-fit scaling relations and Table 3 lists all of the coefficients. Besides the errors in the slopes and intercepts, we have also calculated the internal scatter of the distribution of the whole sample in our three bins. The internal scatter (in dex) for , [Fe/H] and [Mg/Fe] in the three bins (in ascending order) are: (, , ), (, , ) and (, , ), respectively. Recall that the median in the three bins are , and , respectively.
The strong dependence is obvious from the best-fit relations. Elliptical galaxies at the highest masses are older, more metal-rich, and more strongly enhanced. The rich-group galaxies are also apparently older than the field galaxies, by Gyr. We note, however, that the difference between different subsamples is relatively small compared with the intrinsic scatter. In the previous sections, we showed that the environmental dependence of the average spectra and - relations vanishes at higher . We therefore expect that the SSP-equivalent age dependence on environment may correlate with too. Indeed, the slope of the age- relation for field galaxies is slightly larger than that for rich-group galaxies, but the difference is very small. The dependence of the age-environment relationship on thus may be buried in the large scatter in this diagram.
Aside from the strong dependence and the obvious environmental dependence of age in the best-fit scaling relations, we do see very subtle environmental effects on [Fe/H] and [Mg/Fe]. However, these are at a barely significant level (). And we do not see obvious dependence of total metallicity [Z/H] on environment. Compared to the field galaxies, the rich-group galaxies are slightly more iron-poor (only by dex in terms of [Fe/H]) and slightly more strongly enhanced (only by dex). These differences are consistent with the environmental dependence of the index- relations we saw in §4.2.4. In Figure 14 and Table 2, we show that the absorption-line strength is almost identical in different environments. However, because field galaxies are younger, they need slightly more iron to produce the same signature as the rich-group galaxies; field galaxies also have slightly weaker (and other -element indices), implying slightly lower abundance in the field, as we see here.
The environmental dependence we see agrees very well with previous studies (e.g., T05; Bernardi et al. 2006; Cooper et al. 2010). T05 show that early-type (E/S0) galaxies in high-density environments (mostly in the Virgo and the Coma clusters) are older by Gyr than galaxies in low-density environments. We have also shown that the Coma galaxies in our Elliptical sample are systematically older than average; thus, the Coma galaxies in their sample may have contributed to the relatively stronger dependence in their results. They also found a relatively stronger dependence for metallicity; in particular, they found that galaxies in high-density environments are more metal-poor by dex (in terms of [Z/H]) with no dependence for [/Fe]. As seen in Figure 20, if we only look at the elliptical galaxies in their sample, we see the galaxies in high-density environments appear to be slightly more strongly enhanced. Considering the large scatter in the SSP parameter- relation, our results agree very well with each other.
By comparing samples in different environments, Bernardi et al. (2006) find that the spectroscopic differences between early-type galaxies in high-density environments and in low-density environments are very similar to the differences between early-types at redshift and . Under the reasonable assumption that the primary difference between the samples at each redshift is overall age, they therefore conclude that early-type galaxies in high-density environments are Gyr older than those in low-density regions. Thus, our conclusions are in very good agreement with theirs. They also do not find noticeable environmental dependence in total metallicity. Combining results from different groups (e.g., T05, Bernardi et al. 2006, and this work), we note that the environmental dependence in metallicity is indeed very subtle.
Using samples drawn from the SDSS, Cooper et al. (2010) remove the mean dependence of average overdensity (i.e., environment) on color and luminosity, and find that there remains a strong residual trend between stellar age and environment, such that galaxies with older stellar populations favor regions of higher overdensity relative to galaxies of like color and luminosity. Their conclusions therefore are also consistent with the environmental dependence we find here.
Thomas et al. (2010) do not find a noticeable environmental dependence for the bulk old population of early-type galaxies, likely because they separate the young objects with signs of recent star formation from the bulk old population. In §4.1.4 we argued that the environmental dependence of the average spectra was likely due to recent low-level star formation in low galaxies. We conclude, therefore, that our results would be consistent with Thomas et al. (2010) if they had included the young early-type galaxies in their scaling-relation analysis.
In Figure 23, we compare the linear relationships we derive between velocity dispersion and age, iron abundance, -enhancement, and total metallicity against those derived by T05 and Nelan et al. (2005). We emphasize that the fits derived by both T05 and Nelan et al. (2005) include elliptical and lenticular galaxies, while our sample only includes elliptical galaxies. We determine the intercept of Nelan et al. (2005) from their Table and Figure . For T05, we use the mean of the slopes and the intercepts for samples in high-density and low-density environments. We also overplot the scatter in the distribution of the parameters for the whole sample as error bars (though of course the errors in the mean values are much smaller).
Figure 23 shows that our slopes are in very good agreement with theirs. Considering the large scatter in the distribution, uncertainties in zero-point corrections, different samples and measurements used, and different models used, we find the agreement is remarkable and very encouraging for SSP analysis. The main difference is that our age- relation is systematically younger, by Gyr. This is mainly caused by the difference in the measurements in that our indices are systematically stronger than theirs, by Å (see, e.g., Figure 16).
The discrepancy in age can probably be attributed to the emission line infill correction and/or sample bias. We notice that in Nelan et al. (2005) they exclude galaxies with significant emission lines, by which they may have thrown away galaxies with significant young stellar populations. For the resulting sample without significant emission lines , they do not correct for emission-line contamination. In the sample compiled by T05, we find in the literature that the indices of some galaxies are corrected for emission (González, 1993), while others are not (Beuing et al. 2002, Mehlert et al. 2000888We are not sure whether or not they correct emission for the galaxies with strong emission (EW() Å).). Note the median correction for in our Elliptical sample is Å. Although this difference is fairly small compared to the absorption strength ( Å), it translates to Gyr in SSP analysis. In addition, in T05 more than half of the galaxies in high-density environments are from the Coma cluster. As we have shown here, the Coma galaxies in our sample are systematically older than average. Taking into account the emission line infill correction, sample bias, and the large scatter of the distribution, we conclude that these age relationships agree fairly well with each other.
4.3.4 Caveats on SSP parameters
We emphasize that the parameters calculated above are SSP-equivalent parameters. That is, they can only be taken literally if elliptical galaxies formed in a short enough, and uniform enough, burst of star formation. Such a scenario is probably incorrect. Recent observations from GALEX, Spitzer, and HST have shown that a significant fraction of early-type galaxies exhibit strong UV excess, PAH emission and IR excess, implying possible low-level recent star formation (Yi et al., 2005; Rich et al., 2005; Kaviraj et al., 2007; Schawinski et al., 2007; Temi et al., 2009; Young et al., 2009; Salim & Rich, 2010). Similarly, in §4.1.4, we showed that the environmental dependence of our frosting model parameters (e.g., Trager et al. 2000a; Gebhardt et al. 2003, S07) were consistent with the results of Schawinski et al. (2007) who used GALEX NUV photometry to look for recent star formation in early-type galaxies.
If recent star formation is responsible for some or all of the and environmental dependence of the average spectra, then instead of giving the age of the dominant old stellar population, the derived SSP-equivalent age will be significantly younger (than the real age of the old population) because of the existence of a significant fraction of young stars (e.g. Trager et al., 2000a; Serra & Trager, 2007). Serra & Trager (2007) show that the Balmer indices of a composite stellar population depends primarily on the mass fraction and age of the younger component. If so, then the and environmental dependence of the derived age we see here may reflect partly, or totally, the and environmental dependence of the mass fraction and age of the young component in the frosting model. That is, elliptical galaxies at different may host the old base stellar populations of the same (or similar) age, but the SSP-equivalent ages are younger at lower and in the field due to stronger recent star formation.
Meanwhile, because of the age-metallicity degeneracy, the derived metallicity might be overestimated due to the underestimated age — assuming the metallicity indices are primarily tracing the old population. Precisely how the metal absorption indices behave in the case of composite stellar populations is as yet unclear.
5. Discussion
In the above sections, we have found systematic differences in the average spectra of ellipticals, as a function of and environment. In addition, we have measured the dependence of SSP-equivalent ages, [Fe/H], [Mg/Fe] and [Z/H] on these parameters.
As previous studies have shown, stellar ages of elliptical galaxy seem to be older at higher masses. In this sense, our results fit into the now-classic “downsizing” scenario that Cowie et al. (1996) presented in the context of the more general galaxy population. This age dependence on appears to be explainable in the hierarchical scenario of galaxy formation, as long as star formation can be shut down effectively (e.g., De Lucia et al. 2006). In these models, the higher mass halos are comprised of small systems that on average collapsed earlier. If there is a mechanism to shut off their star formation quickly enough, these progenitors become gas poor and thus the higher mass systems will have older stellar population ages.
The precise nature of what shuts off star formation in elliptical galaxies is unknown. AGN are a possible source for such feedback, through both radiative and mechanical heating processes (Ciotti & Ostriker 1997; Benson et al. 2003; De Lucia et al. 2006; Vernaleo & Reynolds 2006; Ciotti et al. 2009). A commonly invoked mechanism for triggering the AGN is by feeding the central black holes during a major merger (e.g., Silk & Rees 1998; Matteo et al. 2005; Hopkins et al. 2008). Indeed, Hopkins et al. (2008) argue that in these models the time since the last major gas-rich merger is an increasing function of galaxy mass, and could explain an age- relationship of ellipticals. Other mechanisms for shutting off star formation also are potentially important: Ciotti et al. (2009) fuel AGN feedback using the recycled gas from dying stars, while Johansson et al. (2009) and others invoke gravitational heating from infalling stellar systems.
Elliptical galaxies also have a strong dependence of abundance on . This trend implies that the nature of chemical enrichment depends on galaxy mass. The iron-peak elements mainly come from Type Ia supernovae, while the -elements are mainly produced in massive stars experiencing Type II supernovae. That the enhancement (or probably more accurately, the iron-deficit) is stronger in more massive elliptical galaxies may imply that their star forming timescale is shorter than less massive elliptical galaxies, before the delayed Type Ia supernovae enrich the star forming regions with iron-peak elements (e.g.,Thomas et al. 1998; Pipino & Matteucci 2004; T05. But also see Smith et al. 2009). Hierarchical models with feedback, such as those of De Lucia et al. (2006), appear consistent with this result at least qualitatively.
Finally, ellipticals have a dependence of metallicity on stellar mass. If most of the stars are formed in situ, this trend might be explained by their deeper potential well, boosting chemical recycling by hampering the outflow of gas from the galaxy (e.g., Arimoto & Yoshii, 1987; Matteucci, 1994). However, if most of the stellar mass in ellipticals is produced in progenitor spiral disks, this metallicity trend may instead be a remnant of the mass-metallicity trends known for spirals (e.g. Garnett 2002; Pilyugin et al. 2004; Tremonti et al. 2004).
Where the stars formed that now constitute elliptical galaxies remains in debate. Naab & Ostriker (2009) claim that the metallicities of present day spirals are several times lower than those measured for ellipticals, indicating that giant ellipticals cannot have been produced from mergers of spirals. Hopkins et al. (2009b) counter that this problem could be mitigated if the stellar metallicity gradients of ellipticals are large enough; typical metallicity measurements of ellipticals only cover apertures that are a fraction of the effective radius, and the central regions might have highly enhanced metallicities. It remains to be determined what would be the mass-metallicity relation predicted by a fully cosmological simulation of the merger scenario (though see Kobayashi 2005; Finlator & Davé 2008).
A final wrinkle in the dependence of elliptical properties as a function of mass is that their strength and scatter put some constraint on their late-time merger history. After all, if the largest galaxies are built from progenitor populations of lower- galaxies, one expects the dependence of age and chemical abundance on to weaken with time. If the merging process is important to galaxy growth, these trends should be steeper and tighter in the past. An interesting quantitative prediction from the theoretical models would be how large this evolution really was expected to be, given various merging scenarios.
Alternatively, a variation of the stellar initial mass function (IMF) with galaxy mass — within the ellipticals or their progenitors — can account for the metallicity and abundance trends as well (Cenarro et al. 2003; Nagashima et al. 2005; Köppen et al. 2007; Hoversten & Glazebrook 2008).
Our results demonstrate that whatever processes produce these correlations differ across environment, though only slightly. Explaining the differences between ellipticals in rich groups and in the field requires either a slightly later time of formation for field galaxies, or equivalently and more likely a slightly thicker frosting of recent star formation. Furthermore, these differences are substantially stronger for low-mass galaxies than for high-mass galaxies. This distinction between the effects on high- and low-mass ellipticals is apparent both in the stellar continuum shapes, and in the age measurements based on the Lick index scaling relations (the age measurements we trust the most; large filled symbols in Figure 22).
As noted above, the stellar ages of ellipticals may be related to the formation times of their progenitor halos. Gao et al. (2005) (see also Wechsler et al., 2006; Zhu et al., 2006) show that CDM dark matter halos in dense environments were assembled earlier than average. Such an effect may also be reflected in Fig. 1 of De Lucia et al. (2006), of the stellar age as a function of environment. If the ages of the populations are related to the formation time of the progenitor halos, these theoretical results could explain the younger populations seen in the field. The theoretical results also predict that this effect declines at higher masses (reversing, in fact, above the current nonlinear mass). These results could be related to the environmental dependence of mean stellar age.
Alternatively, field ellipticals may simply have somewhat better access to reservoirs of cold inflowing gas whose virial temperature in groups would be too hot to accrete at late times. In this case, the mean stellar age difference would derive mainly from recent star formation, which as we note above is actually seen in nearby fast-rotator ellipticals (e.g., Kaviraj et al., 2007). However, it is unclear whether and why such an effect should be weaker for more massive ellipticals, as required by the data. For example, the gravitational heating scenario of Khochfar & Ostriker (2008) appears to predict a fairly strong dependence of age on environment for massive galaxies. These considerations possibly favor internal processes, rather than external ones, for regulating the star formation rates in the most massive ellipticals.
The metallicity and -abundance of stellar populations are a much weaker function of environment than age. Whatever determines the chemical evolution of such galaxies must therefore be a weak function of environment. For example, if the mass-metallicity relation is determined by a systematic variation in the IMF, our results would imply that the IMF does not vary substantially with environment. In contrast, if merger history is important in establishing the present day mass-metallicity relation, then ellipticals in different environments must have similar enough merger histories. On the other hand, if the environmental dependence of age is caused by recent star formation (§4.1.4), we expect that stronger recent star formation would cause lower [] and higher metallicity in field ellipticals. For example, by separating the young early-types from the bulk old population, Thomas et al. (2010) find that the young population have lower [] and higher metallicity. It is possible that our sample is still too small to detect a stronger environmental dependence. It is therefore of great interest to investigate the relation of metallicity and -abundance with environment with a larger sample of elliptical galaxies.
6. Summary
We reanalyzed the images of red-sequence galaxies in the local universe using the homogeneous data set of the SDSS. By carefully examining the surface brightness profiles, we selected elliptical galaxies with velocity dispersion at redshift . We found that elliptical galaxies dominate the bright/massive end () of the red sequence in the color-magnitude diagram, and disk-dominated galaxies dominate at lower luminosity (). We also found that elliptical galaxies and disk-dominated galaxies form different loci in color gradient-magnitude/velocity dispersion space, suggesting color gradient can be used for morphological classification.
We studied the dependence of properties of elliptical galaxies on velocity dispersion and environment. Group galaxies tend to have higher velocity dispersion, and thus higher mass.
We have calculated the average optical spectra as a function of velocity dispersion and environment, which all show a typical SED of an old stellar population. We found that the average spectra depend strongly on velocity dispersion. Elliptical galaxies at lower- have a bluer continuum, stronger Balmer and nebular emission, and weaker metal absorption. This result is consistent with the color-magnitude/mass relation that brighter/more massive elliptical galaxies are redder in optical broad-band colors.
Interestingly, we found weak but significant environmental dependence of the average spectra. Elliptical galaxies in the field have a bluer continuum, especially at wavelengths Å, and have stronger (but still weak) emission lines than their counterparts in groups. However, this dependence on environment appears primarily for low- ellipticals; the highest- ellipticals are much less affected. Assuming that age is the dominant factor shaping SEDs and that elliptical galaxies consist of an old base stellar population and a small frosting of young stars, we fit the frosting model to each spectrum in the Elliptical sample. Assuming these trends to be due to a young population, we found that the fraction of galaxies with significant young population is higher at lower velocity dispersion and in the field. We also found that the environmental dependence appears primarily at low velocity dispersion and vanishes at high velocity dispersion.
We measured the Lick indices of the flux-calibrated SDSS spectra of galaxies in our Elliptical sample. In agreement with previous work, we found strong index- relations. The Balmer absorption indices are stronger at lower velocity dispersion, while the metallicity indices are stronger at higher velocity dispersion. The Balmer indices of field galaxies are systematically stronger than those of rich-group galaxies. As in the case of average spectra, this dependence is most pronounced at low velocity dispersion and disappears at high velocity dispersion. We did not find significant environmental dependence of metallicity indicators, only that the -element indices appear to be slightly stronger in rich-group galaxies. We also noted that the emission line infill correction for Balmer lines is an extremely difficult task.
Assuming SSP analysis applies to elliptical galaxies, we have derived the SSP-equivalent age, iron abundance (in terms of [Fe/H]), enhancement ([Mg/Fe]) and total metallicity ([Z/H]). We found that the SSP-equivalent parameters strongly correlate with velocity dispersion. More massive elliptical galaxies are older, more metal-rich, and more strongly enhanced. We also found that, galaxies in rich groups are systematically older than their counterparts in the field, by Gyr. However, this effect is strongest at low velocity dispersion. We found that galaxies in rich groups are slightly more iron-poor and slightly more strongly enhanced, but only at a barely significant level. And we do not find noticeable environmental dependence of total metallicity as well. We have performed fits to the parameter- relation and found that our fits are in very good agreement with previous work, especially taking into account many uncertainties such as zero-point corrections, different samples and data, and different SSP models employed. We found that emission line infill corrections can affect the age determination by Gyr. We also caution that the SSP-equivalent age and metallicity may be affected by the existence of the young component if the frosting model applies to elliptical galaxies.
Finally, we make our sample publicly available to the community999http://bias.cosmo.fas.nyu.edu/galevolution/elliptical.
References
- Abazajian et al. (2003) Abazajian, K., et al. 2003, AJ, 126, 2081
- Adelman-McCarthy et al. (2006) Adelman-McCarthy, J. K., et al. 2006, ApJS, 162, 38
- Alongi et al. (1993) Alongi, M., Bertelli, G., Bressan, A., Chiosi, C., Fagotto, F., Greggio, L., & Nasi, E. 1993, A&AS, 97, 851
- Arimoto & Yoshii (1987) Arimoto, N., & Yoshii, Y. 1987, A&A, 173, 23
- Bacon et al. (2001) Bacon, R., et al. 2001, MNRAS, 326, 23
- Bailyn (1995) Bailyn, C. D. 1995, ARA&A, 33, 133
- Baldry et al. (2004) Baldry, I. K., Glazebrook, K., Brinkmann, J., Ivezić, Ž., Lupton, R. H., Nichol, R. C., & Szalay, A. S. 2004, ApJ, 600, 681
- Baldwin et al. (1981) Baldwin, J. A., Phillips, M. M., & Terlevich, R. 1981, PASP, 93, 5
- Balogh et al. (2004) Balogh, M., et al. 2004, MNRAS, 348, 1355
- Baum (1959) Baum, W. A. 1959, PASP, 71, 106
- Bell et al. (2006a) Bell, E. F., Phleps, S., Somerville, R. S., Wolf, C., Borch, A., & Meisenheimer, K. 2006a, ApJ, 652, 270
- Bell et al. (2004a) Bell, E. F., et al. 2004a, ApJ, 600, L11
- Bell et al. (2004b) —. 2004b, ApJ, 608, 752
- Bell et al. (2006b) —. 2006b, ApJ, 640, 241
- Bender et al. (1993) Bender, R., Burstein, D., & Faber, S. M. 1993, ApJ, 411, 153
- Bender et al. (1998) Bender, R., Saglia, R. P., Ziegler, B., Belloni, P., Greggio, L., Hopp, U., & Bruzual, G. 1998, ApJ, 493, 529
- Bender et al. (1989) Bender, R., Surma, P., Doebereiner, S., Moellenhoff, C., & Madejsky, R. 1989, A&A, 217, 35
- Benson et al. (2003) Benson, A. J., Bower, R. G., Frenk, C. S., Lacey, C. G., Baugh, C. M., & Cole, S. 2003, ApJ, 599, 38
- Berlind et al. (2005) Berlind, A. A., Blanton, M. R., Hogg, D. W., Weinberg, D. H., Davé, R., Eisenstein, D. J., & Katz, N. 2005, ApJ, 629, 625
- Berlind et al. (2006) Berlind, A. A., et al. 2006, ApJS, 167, 1
- Bernardi et al. (2006) Bernardi, M., Nichol, R. C., Sheth, R. K., Miller, C. J., & Brinkmann, J. 2006, AJ, 131, 1288
- Bernardi et al. (1998) Bernardi, M., Renzini, A., da Costa, L. N., Wegner, G., Alonso, M. V., Pellegrini, P. S., Rité, C., & Willmer, C. N. A. 1998, ApJ, 508, L143
- Bernardi et al. (2003a) Bernardi, M., et al. 2003a, AJ, 125, 1817
- Bernardi et al. (2003b) —. 2003b, AJ, 125, 1882
- Beuing et al. (2002) Beuing, J., Bender, R., Mendes de Oliveira, C., Thomas, D., & Maraston, C. 2002, A&A, 395, 431
- Binggeli et al. (1988) Binggeli, B., Sandage, A., & Tammann, G. A. 1988, ARA&A, 26, 509
- Blanton et al. (2005a) Blanton, M. R., Eisenstein, D., Hogg, D. W., Schlegel, D. J., & Brinkmann, J. 2005a, ApJ, 629, 143
- Blanton et al. (2003a) Blanton, M. R., Lin, H., Lupton, R. H., Maley, F. M., Young, N., Zehavi, I., & Loveday, J. 2003a, AJ, 125, 2276
- Blanton & Moustakas (2009) Blanton, M. R., & Moustakas, J. 2009, ARA&A, 47, 159
- Blanton & Roweis (2007) Blanton, M. R., & Roweis, S. 2007, AJ, 133, 734
- Blanton et al. (2003b) Blanton, M. R., et al. 2003b, ApJ, 594, 186
- Blanton et al. (2005b) —. 2005b, AJ, 129, 2562
- Borges et al. (1995) Borges, A. C., Idiart, T. P., de Freitas Pacheco, J. A., & Thevenin, F. 1995, AJ, 110, 2408
- Boroson et al. (1983) Boroson, T. A., Thompson, I. B., & Shectman, S. A. 1983, Astronomical Journal (ISSN 0004-6256), 88, 1707
- Bower et al. (1992) Bower, R. G., Lucey, J. R., & Ellis, R. S. 1992, MNRAS, 254, 589
- Bressan et al. (1993) Bressan, A., Fagotto, F., Bertelli, G., & Chiosi, C. 1993, A&AS, 100, 647
- Brown et al. (2007) Brown, M. J. I., Dey, A., Jannuzi, B. T., Brand, K., Benson, A. J., Brodwin, M., Croton, D. J., & Eisenhardt, P. R. 2007, ApJ, 654, 858
- Brown et al. (2005) Brown, T. M., et al. 2005, AJ, 130, 1693
- Bruzual & Charlot (2003) Bruzual, G., & Charlot, S. 2003, MNRAS, 344, 1000
- Bundy et al. (2009) Bundy, K., et al. 2009, ArXiv e-prints
- Caldwell et al. (2003) Caldwell, N., Rose, J. A., & Concannon, K. D. 2003, AJ, 125, 2891
- Caon et al. (1993) Caon, N., Capaccioli, M., & D’Onofrio, M. 1993, MNRAS, 265, 1013
- Cappellari et al. (2006) Cappellari, M., et al. 2006, MNRAS, 366, 1126
- Cappellari et al. (2007) —. 2007, MNRAS, 379, 418
- Cardiel et al. (1998) Cardiel, N., Gorgas, J., Cenarro, J., & Gonzalez, J. J. 1998, A&AS, 127, 597
- Cenarro et al. (2003) Cenarro, A. J., Gorgas, J., Vazdekis, A., Cardiel, N., & Peletier, R. F. 2003, MNRAS, 339, L12
- Chabrier (2003) Chabrier, G. 2003, PASP, 115, 763
- Cimatti et al. (2006) Cimatti, A., Daddi, E., & Renzini, A. 2006, A&A, 453, L29
- Cimatti et al. (2008) Cimatti, A., et al. 2008, A&A, 482, 21
- Ciotti (1991) Ciotti, L. 1991, A&A, 249, 99
- Ciotti & Ostriker (1997) Ciotti, L., & Ostriker, J. P. 1997, Astrophysical Journal Letters v.487, 487, L105
- Ciotti et al. (2009) Ciotti, L., Ostriker, J. P., & Proga, D. 2009, The Astrophysical Journal, 699, 89
- Coelho et al. (2007) Coelho, P., Bruzual, G., Charlot, S., Weiss, A., Barbuy, B., & Ferguson, J. W. 2007, MNRAS, 382, 498
- Colless et al. (1999) Colless, M., Burstein, D., Davies, R. L., McMahan, R. K., Saglia, R. P., & Wegner, G. 1999, MNRAS, 303, 813
- Concannon et al. (2000) Concannon, K. D., Rose, J. A., & Caldwell, N. 2000, ApJ, 536, L19
- Conroy & Gunn (2010) Conroy, C., & Gunn, J. E. 2010, ApJ, 712, 833
- Conroy et al. (2009) Conroy, C., Gunn, J. E., & White, M. 2009, ApJ, 699, 486
- Conroy et al. (2010) Conroy, C., White, M., & Gunn, J. E. 2010, ApJ, 708, 58
- Conselice et al. (2003) Conselice, C. J., Bershady, M. A., Dickinson, M., & Papovich, C. 2003, AJ, 126, 1183
- Cool et al. (2008) Cool, R. J., et al. 2008, ApJ, 682, 919
- Cooper et al. (2010) Cooper, M. C., Gallazzi, A., Newman, J. A., & Yan, R. 2010, MNRAS, 402, 1942
- Corwin et al. (1994) Corwin, Jr., H. G., Buta, R. J., & de Vaucouleurs, G. 1994, AJ, 108, 2128
- Côté et al. (2007) Côté, P., et al. 2007, ApJ, 671, 1456
- Cowie et al. (1996) Cowie, L. L., Songaila, A., Hu, E. M., & Cohen, J. G. 1996, AJ, 112, 839
- Cox et al. (2006) Cox, T. J., Dutta, S. N., Di Matteo, T., Hernquist, L., Hopkins, P. F., Robertson, B., & Springel, V. 2006, ApJ, 650, 791
- Croton et al. (2005) Croton, D. J., et al. 2005, MNRAS, 356, 1155
- Daddi et al. (2005) Daddi, E., et al. 2005, ApJ, 626, 680
- Davies et al. (1993) Davies, R. L., Sadler, E. M., & Peletier, R. F. 1993, MNRAS, 262, 650
- De Lucia et al. (2006) De Lucia, G., Springel, V., White, S. D. M., Croton, D., & Kauffmann, G. 2006, MNRAS, 366, 499
- de Vaucouleurs (1959) de Vaucouleurs, G. 1959, Handbuch der Physik, 53, 275
- de Vaucouleurs et al. (1991) de Vaucouleurs, G., de Vaucouleurs, A., Corwin, Jr., H. G., Buta, R. J., Paturel, G., & Fouque, P. 1991, Third Reference Catalogue of Bright Galaxies, ed. de Vaucouleurs, G., de Vaucouleurs, A., Corwin, H. G., Jr., Buta, R. J., Paturel, G., & Fouque, P.
- Desai et al. (2007) Desai, V., et al. 2007, ApJ, 660, 1151
- Djorgovski & Davis (1987) Djorgovski, S., & Davis, M. 1987, ApJ, 313, 59
- Dressler (1980) Dressler, A. 1980, ApJ, 236, 351
- Dressler et al. (1987) Dressler, A., Lynden-Bell, D., Burstein, D., Davies, R. L., Faber, S. M., Terlevich, R., & Wegner, G. 1987, ApJ, 313, 42
- Eisenstein et al. (2001) Eisenstein, D. J., et al. 2001, AJ, 122, 2267
- Eisenstein et al. (2003) —. 2003, ApJ, 585, 694
- Emsellem et al. (2007) Emsellem, E., et al. 2007, MNRAS, 379, 401
- Faber (1972) Faber, S. M. 1972, A&A, 20, 361
- Faber (1973) —. 1973, ApJ, 179, 731
- Faber et al. (1985) Faber, S. M., Friel, E. D., Burstein, D., & Gaskell, C. M. 1985, ApJS, 57, 711
- Faber & Gallagher (1976) Faber, S. M., & Gallagher, J. S. 1976, ApJ, 204, 365
- Faber & Jackson (1976) Faber, S. M., & Jackson, R. E. 1976, ApJ, 204, 668
- Faber et al. (2007) Faber, S. M., et al. 2007, ApJ, 665, 265
- Fagotto et al. (1994a) Fagotto, F., Bressan, A., Bertelli, G., & Chiosi, C. 1994a, A&AS, 104, 365
- Fagotto et al. (1994b) —. 1994b, A&AS, 105, 29
- Ferrarese et al. (1994) Ferrarese, L., van den Bosch, F. C., Ford, H. C., Jaffe, W., & O’Connell, R. W. 1994, AJ, 108, 1598
- Ferrarese et al. (2006) Ferrarese, L., et al. 2006, ApJS, 164, 334
- Finlator & Davé (2008) Finlator, K., & Davé, R. 2008, MNRAS, 385, 2181
- Fukugita et al. (1996) Fukugita, M., Ichikawa, T., Gunn, J. E., Doi, M., Shimasaku, K., & Schneider, D. P. 1996, AJ, 111, 1748
- Fukugita et al. (2004) Fukugita, M., Nakamura, O., Turner, E. L., Helmboldt, J., & Nichol, R. C. 2004, ApJ, 601, L127
- Gao et al. (2005) Gao, L., Springel, V., & White, S. D. M. 2005, MNRAS, 363, L66
- Garnett (2002) Garnett, D. R. 2002, ApJ, 581, 1019
- Gebhardt et al. (2003) Gebhardt, K., et al. 2003, ApJ, 597, 239
- Girardi et al. (1996) Girardi, L., Bressan, A., Chiosi, C., Bertelli, G., & Nasi, E. 1996, A&AS, 117, 113
- González (1993) González, J. J. 1993, PhD thesis, Thesis (PH.D.)–UNIVERSITY OF CALIFORNIA, SANTA CRUZ, 1993.Source: Dissertation Abstracts International, Volume: 54-05, Section: B, page: 2551.
- Gorgas et al. (1990) Gorgas, J., Efstathiou, G., & Aragon Salamanca, A. 1990, MNRAS, 245, 217
- Goto (2005) Goto, T. 2005, MNRAS, 359, 1415
- Graham (2002) Graham, A. W. 2002, Monthly Notices of the Royal Astronomical Society, 334, 859
- Graham & Driver (2005) Graham, A. W., & Driver, S. P. 2005, Publications of the Astronomical Society of Australia, 22, 118
- Graves et al. (2007) Graves, G. J., Faber, S. M., Schiavon, R. P., & Yan, R. 2007, ApJ, 671, 243
- Graves & Schiavon (2008) Graves, G. J., & Schiavon, R. P. 2008, ApJS, 177, 446
- Greggio (1997) Greggio, L. 1997, MNRAS, 285, 151
- Gunn et al. (1998) Gunn, J. E., et al. 1998, AJ, 116, 3040
- Guzman et al. (1992) Guzman, R., Lucey, J. R., Carter, D., & Terlevich, R. J. 1992, MNRAS, 257, 187
- Hogg et al. (2001) Hogg, D. W., Finkbeiner, D. P., Schlegel, D. J., & Gunn, J. E. 2001, AJ, 122, 2129
- Hogg et al. (2003) Hogg, D. W., et al. 2003, ApJ, 585, L5
- Hogg et al. (2004) —. 2004, ApJ, 601, L29
- Hopkins et al. (2009a) Hopkins, P. F., Cox, T. J., Dutta, S. N., Hernquist, L., Kormendy, J., & Lauer, T. R. 2009a, ApJS, 181, 135
- Hopkins et al. (2008) Hopkins, P. F., Hernquist, L., Cox, T. J., & Kereš, D. 2008, ApJS, 175, 356
- Hopkins et al. (2009b) Hopkins, P. F., Lauer, T. R., Cox, T. J., Hernquist, L., & Kormendy, J. 2009b, ApJS, 181, 486
- Hoversten & Glazebrook (2008) Hoversten, E. A., & Glazebrook, K. 2008, The Astrophysical Journal, 675, 163
- Jansen et al. (2000) Jansen, R. A., Franx, M., Fabricant, D., & Caldwell, N. 2000, ApJS, 126, 271
- Jedrzejewski (1987) Jedrzejewski, R. I. 1987, MNRAS, 226, 747
- Johansson et al. (2009) Johansson, P. H., Naab, T., & Ostriker, J. P. 2009, The Astrophysical Journal Letters, 697, L38
- Jørgensen (1997) Jørgensen, I. 1997, MNRAS, 288, 161
- Jørgensen (1999) —. 1999, MNRAS, 306, 607
- Jørgensen et al. (1995) Jørgensen, I., Franx, M., & Kjaergaard, P. 1995, MNRAS, 276, 1341
- Kauffmann et al. (2004) Kauffmann, G., White, S. D. M., Heckman, T. M., Ménard, B., Brinchmann, J., Charlot, S., Tremonti, C., & Brinkmann, J. 2004, MNRAS, 353, 713
- Kauffmann et al. (2003) Kauffmann, G., et al. 2003, MNRAS, 346, 1055
- Kaviraj et al. (2009) Kaviraj, S., Peirani, S., Khochfar, S., Silk, J., & Kay, S. 2009, MNRAS, 394, 1713
- Kaviraj et al. (2007) Kaviraj, S., et al. 2007, ApJS, 173, 619
- Kent (1983) Kent, S. M. 1983, ApJ, 266, 562
- Khochfar & Ostriker (2008) Khochfar, S., & Ostriker, J. P. 2008, ApJ, 680, 54
- Knapp et al. (1985) Knapp, G. R., Turner, E. L., & Cunniffe, P. E. 1985, AJ, 90, 454
- Kobayashi (2005) Kobayashi, C. 2005, Monthly Notices of the Royal Astronomical Society, 361, 1216
- Komatsu et al. (2010) Komatsu, E., et al. 2010, eprint arXiv, 1001, 4538
- Köppen et al. (2007) Köppen, J., Weidner, C., & Kroupa, P. 2007, MNRAS, 375, 673
- Kormendy (1999) Kormendy, J. 1999, in Astronomical Society of the Pacific Conference Series, Vol. 182, Galaxy Dynamics - A Rutgers Symposium, ed. D. R. Merritt, M. Valluri, & J. A. Sellwood, 124–+
- Kormendy et al. (1994) Kormendy, J., Dressler, A., Byun, Y. I., Faber, S. M., Grillmair, C., Lauer, T. R., Richstone, D., & Tremaine, S. 1994, in European Southern Observatory Conference and Workshop Proceedings, Vol. 49, European Southern Observatory Conference and Workshop Proceedings, ed. G. Meylan & P. Prugniel, 147–+
- Kormendy et al. (2009) Kormendy, J., Fisher, D. B., Cornell, M. E., & Bender, R. 2009, ApJS, 182, 216
- Korn et al. (2005) Korn, A. J., Maraston, C., & Thomas, D. 2005, A&A, 438, 685
- Kuntschner (2000) Kuntschner, H. 2000, MNRAS, 315, 184
- Kuntschner et al. (2006) Kuntschner, H., et al. 2006, MNRAS, 369, 497
- Kuntschner et al. (2010) —. 2010, ArXiv e-prints
- La Barbera et al. (2010) La Barbera, F., Lopes, P. A. A., de Carvalho, R. R., de la Rosa, I. G., & Berlind, A. A. 2010, ArXiv e-prints
- Lauer et al. (1995) Lauer, T. R., et al. 1995, AJ, 110, 2622
- Lauer et al. (2005) —. 2005, AJ, 129, 2138
- Lauer et al. (2007) —. 2007, ApJ, 664, 226
- Lee et al. (2000) Lee, H., Yoon, S., & Lee, Y. 2000, AJ, 120, 998
- Lee et al. (1990) Lee, Y., Demarque, P., & Zinn, R. 1990, ApJ, 350, 155
- Lee et al. (1994) —. 1994, ApJ, 423, 248
- Lemson & Kauffmann (1999) Lemson, G., & Kauffmann, G. 1999, MNRAS, 302, 111
- Lintott et al. (2008) Lintott, C. J., et al. 2008, MNRAS, 389, 1179
- Longhetti et al. (2007) Longhetti, M., et al. 2007, MNRAS, 374, 614
- Lotz et al. (2004) Lotz, J. M., Primack, J., & Madau, P. 2004, AJ, 128, 163
- Lupton et al. (2001) Lupton, R., Gunn, J. E., Ivezić, Z., Knapp, G. R., & Kent, S. 2001, in Astronomical Society of the Pacific Conference Series, Vol. 238, Astronomical Data Analysis Software and Systems X, ed. F. R. Harnden Jr., F. A. Primini, & H. E. Payne, 269–+
- Maraston (2005) Maraston, C. 2005, MNRAS, 362, 799
- Maraston & Thomas (2000) Maraston, C., & Thomas, D. 2000, ApJ, 541, 126
- Marinoni et al. (1999) Marinoni, C., Monaco, P., Giuricin, G., & Costantini, B. 1999, ApJ, 521, 50
- Martin et al. (2005) Martin, D. C., et al. 2005, ApJ, 619, L1
- Masjedi et al. (2008) Masjedi, M., Hogg, D. W., & Blanton, M. R. 2008, ApJ, 679, 260
- Masjedi et al. (2006) Masjedi, M., et al. 2006, ApJ, 644, 54
- Matteo et al. (2005) Matteo, T. D., Springel, V., & Hernquist, L. 2005, Nature, 433, 604
- Matteucci (1994) Matteucci, F. 1994, A&A, 288, 57
- McWilliam & Rich (1994) McWilliam, A., & Rich, R. M. 1994, ApJS, 91, 749
- Mehlert et al. (2000) Mehlert, D., Saglia, R. P., Bender, R., & Wegner, G. 2000, A&AS, 141, 449
- Mehlert et al. (2003) Mehlert, D., Thomas, D., Saglia, R. P., Bender, R., & Wegner, G. 2003, A&A, 407, 423
- Michard (1985) Michard, R. 1985, Astronomy and Astrophysics Supplement Series (ISSN 0365-0138), 59, 205
- Mihos & Hernquist (1994) Mihos, J. C., & Hernquist, L. 1994, ApJ, 437, L47
- Mo & White (1996) Mo, H. J., & White, S. D. M. 1996, MNRAS, 282, 347
- Naab et al. (2009) Naab, T., Johansson, P. H., & Ostriker, J. P. 2009, ApJ, 699, L178
- Naab et al. (2006) Naab, T., Khochfar, S., & Burkert, A. 2006, ApJ, 636, L81
- Naab & Ostriker (2009) Naab, T., & Ostriker, J. P. 2009, ApJ, 690, 1452
- Nagashima et al. (2005) Nagashima, M., Lacey, C. G., Okamoto, T., Baugh, C. M., Frenk, C. S., & Cole, S. 2005, MNRAS, 363, L31
- Nelan et al. (2005) Nelan, J. E., Smith, R. J., Hudson, M. J., Wegner, G. A., Lucey, J. R., Moore, S. A. W., Quinney, S. J., & Suntzeff, N. B. 2005, ApJ, 632, 137
- Oconnell (1980) Oconnell, R. W. 1980, ApJ, 236, 430
- Park & Choi (2005) Park, C., & Choi, Y. 2005, ApJ, 635, L29
- Park et al. (2007) Park, C., Choi, Y., Vogeley, M. S., Gott, III, J. R., & Blanton, M. R. 2007, ApJ, 658, 898
- Peletier (1989) Peletier, R. F. 1989, PhD thesis, , University of Groningen, The Netherlands, (1989)
- Pier et al. (2003) Pier, J. R., Munn, J. A., Hindsley, R. B., Hennessy, G. S., Kent, S. M., Lupton, R. H., & Ivezić, Ž. 2003, AJ, 125, 1559
- Pilyugin et al. (2004) Pilyugin, L. S., Vílchez, J. M., & Contini, T. 2004, A&A, 425, 849
- Pipino & Matteucci (2004) Pipino, A., & Matteucci, F. 2004, MNRAS, 347, 968
- Poggianti et al. (2001) Poggianti, B. M., et al. 2001, ApJ, 562, 689
- Proctor & Sansom (2002) Proctor, R. N., & Sansom, A. E. 2002, MNRAS, 333, 517
- Prugniel & Simien (1997) Prugniel, P., & Simien, F. 1997, A&A, 321, 111
- Rawle et al. (2010) Rawle, T. D., Smith, R. J., & Lucey, J. R. 2010, MNRAS, 401, 852
- Renzini & Buzzoni (1986) Renzini, A., & Buzzoni, A. 1986, in Astrophysics and Space Science Library, Vol. 122, Spectral Evolution of Galaxies, ed. C. Chiosi & A. Renzini, 195–231
- Rich et al. (2005) Rich, R. M., et al. 2005, ApJ, 619, L107
- Richards et al. (2002) Richards, G. T., et al. 2002, AJ, 123, 2945
- Robaina et al. (2010) Robaina, A. R., Bell, E. F., van der Wel, A., Somerville, R. S., Skelton, R. E., McIntosh, D. H., Meisenheimer, K., & Wolf, C. 2010, ApJ, 719, 844
- Rose (1985) Rose, J. A. 1985, AJ, 90, 1927
- Salim & Rich (2010) Salim, S., & Rich, R. M. 2010, ApJ, 714, L290
- Salpeter (1955) Salpeter, E. E. 1955, ApJ, 121, 161
- Sánchez-Blázquez et al. (2006a) Sánchez-Blázquez, P., Gorgas, J., & Cardiel, N. 2006a, A&A, 457, 823
- Sánchez-Blázquez et al. (2003) Sánchez-Blázquez, P., Gorgas, J., Cardiel, N., Cenarro, J., & González, J. J. 2003, ApJ, 590, L91
- Sánchez-Blázquez et al. (2006b) Sánchez-Blázquez, P., Gorgas, J., Cardiel, N., & González, J. J. 2006b, A&A, 457, 809
- Sandage et al. (1975) Sandage, A., Sandage, M., & Kristian, J. 1975, Galaxies and the Universe, ed. Sandage, A., Sandage, M., & Kristian, J.
- Saracco et al. (2009) Saracco, P., Longhetti, M., & Andreon, S. 2009, MNRAS, 392, 718
- Scarlata et al. (2007) Scarlata, C., et al. 2007, ApJS, 172, 494
- Schawinski et al. (2007) Schawinski, K., et al. 2007, ApJS, 173, 512
- Schawinski et al. (2009) —. 2009, MNRAS, 396, 818
- Schiavon (2007) Schiavon, R. P. 2007, ApJS, 171, 146
- Schlegel et al. (1998) Schlegel, D. J., Finkbeiner, D. P., & Davis, M. 1998, ApJ, 500, 525
- Schombert (1986) Schombert, J. M. 1986, ApJS, 60, 603
- Serra & Trager (2007) Serra, P., & Trager, S. C. 2007, MNRAS, 374, 769
- Sérsic (1963) Sérsic, J. L. 1963, Boletin de la Asociacion Argentina de Astronomia La Plata Argentina, 6, 41
- Serven et al. (2005) Serven, J., Worthey, G., & Briley, M. M. 2005, ApJ, 627, 754
- Shapiro et al. (2010) Shapiro, K. L., et al. 2010, MNRAS, 402, 2140
- Silk & Rees (1998) Silk, J., & Rees, M. J. 1998, Astronomy and Astrophysics, 331, L1
- Skibba et al. (2009) Skibba, R. A., et al. 2009, MNRAS, 399, 966
- Smail et al. (1997) Smail, I., Dressler, A., Couch, W. J., Ellis, R. S., Oemler, Jr., A., Butcher, H., & Sharples, R. M. 1997, ApJS, 110, 213
- Smith et al. (2002) Smith, J. A., et al. 2002, AJ, 123, 2121
- Smith et al. (2009) Smith, R. J., Lucey, J. R., Hudson, M. J., & Bridges, T. J. 2009, MNRAS, 398, 119
- Spolaor et al. (2009) Spolaor, M., Proctor, R. N., Forbes, D. A., & Couch, W. J. 2009, ApJ, 691, L138
- Stoughton et al. (2002) Stoughton, C., et al. 2002, AJ, 123, 485
- Strateva et al. (2001) Strateva, I., et al. 2001, AJ, 122, 1861
- Strauss et al. (2002) Strauss, M. A., et al. 2002, AJ, 124, 1810
- Suh et al. (2010) Suh, H., Jeong, H., Oh, K., Yi, S. K., Ferreras, I., & Schawinski, K. 2010, The Astrophysical Journal Supplement, 187, 374
- Sweigart (1987) Sweigart, A. V. 1987, ApJS, 65, 95
- Tantalo et al. (1998) Tantalo, R., Chiosi, C., & Bressan, A. 1998, A&A, 333, 419
- Temi et al. (2009) Temi, P., Brighenti, F., & Mathews, W. G. 2009, ApJ, 695, 1
- Terlevich et al. (1981) Terlevich, R., Davies, R. L., Faber, S. M., & Burstein, D. 1981, MNRAS, 196, 381
- Thomas et al. (1998) Thomas, D., Greggio, L., & Bender, R. 1998, MNRAS, 296, 119
- Thomas et al. (2003a) Thomas, D., Maraston, C., & Bender, R. 2003a, MNRAS, 343, 279
- Thomas et al. (2003b) —. 2003b, MNRAS, 339, 897
- Thomas et al. (2005) Thomas, D., Maraston, C., Bender, R., & Mendes de Oliveira, C. 2005, ApJ, 621, 673
- Thomas et al. (2010) Thomas, D., Maraston, C., Schawinski, K., Sarzi, M., & Silk, J. 2010, MNRAS, 404, 1775
- Toft et al. (2007) Toft, S., et al. 2007, ApJ, 671, 285
- Toomre (1977) Toomre, A. 1977, in Evolution of Galaxies and Stellar Populations, ed. B. M. Tinsley & R. B. Larson, 401–+
- Trager et al. (2000a) Trager, S. C., Faber, S. M., Worthey, G., & González, J. J. 2000a, AJ, 120, 165
- Trager et al. (2000b) —. 2000b, AJ, 119, 1645
- Trager et al. (1998) Trager, S. C., Worthey, G., Faber, S. M., Burstein, D., & Gonzalez, J. J. 1998, ApJS, 116, 1
- Tremonti et al. (2004) Tremonti, C. A., et al. 2004, ApJ, 613, 898
- Trujillo et al. (2007) Trujillo, I., Conselice, C. J., Bundy, K., Cooper, M. C., Eisenhardt, P., & Ellis, R. S. 2007, MNRAS, 382, 109
- Tully et al. (1996) Tully, R. B., Verheijen, M. A. W., Pierce, M. J., Huang, J., & Wainscoat, R. J. 1996, AJ, 112, 2471
- van Dokkum et al. (2008) van Dokkum, P. G., et al. 2008, ApJ, 677, L5
- van Dokkum et al. (2010) —. 2010, ApJ, 709, 1018
- van Gorkom & Schiminovich (1997) van Gorkom, J., & Schiminovich, D. 1997, in Astronomical Society of the Pacific Conference Series, Vol. 116, The Nature of Elliptical Galaxies; 2nd Stromlo Symposium, ed. M. Arnaboldi, G. S. Da Costa, & P. Saha, 310–+
- Vernaleo & Reynolds (2006) Vernaleo, J. C., & Reynolds, C. S. 2006, ApJ, 645, 83
- Visvanathan & Sandage (1977) Visvanathan, N., & Sandage, A. 1977, ApJ, 216, 214
- Wechsler et al. (2006) Wechsler, R. H., Zentner, A. R., Bullock, J. S., Kravtsov, A. V., & Allgood, B. 2006, ApJ, 652, 71
- Weiss et al. (1995) Weiss, A., Peletier, R. F., & Matteucci, F. 1995, A&A, 296, 73
- Werner et al. (2004) Werner, M. W., et al. 2004, ApJS, 154, 1
- White & Rees (1978) White, S. D. M., & Rees, M. J. 1978, MNRAS, 183, 341
- Worthey & Collobert (2003) Worthey, G., & Collobert, M. 2003, ApJ, 586, 17
- Worthey et al. (1992) Worthey, G., Faber, S. M., & Gonzalez, J. J. 1992, ApJ, 398, 69
- Worthey et al. (1994) Worthey, G., Faber, S. M., Gonzalez, J. J., & Burstein, D. 1994, ApJS, 94, 687
- Worthey & Ottaviani (1997) Worthey, G., & Ottaviani, D. L. 1997, ApJS, 111, 377
- Xin & Deng (2005) Xin, Y., & Deng, L. 2005, ApJ, 619, 824
- Yan et al. (2006) Yan, R., Newman, J. A., Faber, S. M., Konidaris, N., Koo, D., & Davis, M. 2006, ApJ, 648, 281
- Yi et al. (1997) Yi, S., Demarque, P., & Oemler, Jr., A. 1997, ApJ, 486, 201
- Yi et al. (2005) Yi, S. K., et al. 2005, ApJ, 619, L111
- York et al. (2000) York, D. G., et al. 2000, AJ, 120, 1579
- Young (2002) Young, L. M. 2002, AJ, 124, 788
- Young (2005) —. 2005, ApJ, 634, 258
- Young et al. (2009) Young, L. M., Bendo, G. J., & Lucero, D. M. 2009, AJ, 137, 3053
- Young et al. (2008) Young, L. M., Bureau, M., & Cappellari, M. 2008, ApJ, 676, 317
- Young et al. (1979) Young, P. J., Kristian, J., Westphal, J. A., & Sargent, W. L. W. 1979, ApJ, 234, 76
- Zhu et al. (2006) Zhu, G., Zheng, Z., Lin, W. P., Jing, Y. P., Kang, X., & Gao, L. 2006, ApJ, 639, L5
| Sample | Size | Description |
|---|---|---|
| Lowz | All galaxies with SDSS imaging below z | |
| Environ | Galaxies with in Lowz | |
| PhotoRS | Galaxies that pass red sequence cuts () | |
| SpecRS | Galaxies with SDSS spectroscopy in PhotoRS-Sam. with | |
| Elliptical | The elliptical galaxy sample | |
| Bonus | The bonus elliptical galaxy sample without SDSS spectroscopy |
| Index | Coeffecient | All | Rich group | Poor group | Field |
|---|---|---|---|---|---|
| (Å) | |||||
| (Å) | |||||
| (Å) | |||||
| (Å) | |||||
| (Å) | |||||
| (Å) | |||||
| (Å) | |||||
| (Å) | |||||
| (Å) | |||||
| (Å) | |||||
| (Å) | |||||
| (Å) | |||||
| (Å) | |||||
| (Å) | |||||
| (Å) | |||||
| (Å) | |||||
| 4668 (Å) | |||||
| 4668 (Å) | |||||
| 4227 (Å) | |||||
| 4227 (Å) |
Note. — , where is in .
| SSP parameters | Coeffecient | All | Rich group | Poor group | Field |
|---|---|---|---|---|---|
| Age (Gyr) | |||||
| Age (Gyr) | |||||
| Fe/H | |||||
| Fe/H | |||||
| Mg/Fe | |||||
| Mg/Fe |
Note. — , where is in .