On the absolute age of the Globular Cluster M9211affiliation: This paper makes use of data obtained from the Isaac Newton Group Archive which is maintained as part of the CASU Astronomical Data Centre at the Institute of Astronomy, Cambridge. This research used the facilities of the Canadian Astronomy Data Centre operated by the National Research Council of Canada with the support of the Canadian Space Agency.
Abstract
We present precise and deep optical photometry of the globular M92. Data were collected in three different photometric systems: Sloan Digital Sky Survey (,,,; MegaCam@CFHT), Johnson-Kron-Cousins (,,; various ground-based telescopes) and Advanced Camera for Surveys (ACS) Vegamag (, , ; Hubble Space Telescope). Special attention was given to the photometric calibration, and the precision of the ground-based data is generally better than 0.01 mag. We computed a new set of -enhanced evolutionary models accounting for the gravitational settling of heavy elements at fixed chemical composition ([/Fe]=+0.3, [Fe/H]=–2.32 dex, =0.248). The isochrones—assuming the same true distance modulus (=14.74 mag), the same reddening (=0.0250.010 mag), and the same reddening law—account for the stellar distribution along the main sequence and the red giant branch in different Color-Magnitude Diagrams (,; ,; ,; ,; ,). The same outcome applies to the comparison between the predicted Zero-Age-Horizontal-Branch (ZAHB) and the HB stars. We also found a cluster age of 111.5 Gyr, in good agreement with previous estimates. The error budget accounts for uncertainties in the input physics and the photometry. To test the possible occurrence of CNO-enhanced stars, we also computed two sets of - and CNO-enhanced (by a factor of three) models both at fixed total metallicity ([M/H]=–2.10 dex) and at fixed iron abundance. We found that the isochrones based on the former set give the same cluster age (111.5 Gyr) as the canonical -enhanced isochrones. The isochrones based on the latter set also give a similar cluster age (101.5 Gyr). These findings support previous results concerning the weak sensitivity of cluster isochrones to CNO-enhanced chemical mixtures.
Subject headings:
globular cluster: individual (M92) — stars: evolution — stars: horizontal-branch — stars: main sequence — stars: Population II — stars: red giants1. Introduction
The Galactic globular cluster (GGC) M92 (NGC 6341) is among the oldest and most metal-poor ([Fe/H]=–2.38, Kraft & Ivans 2003; 2004) Galactic stellar systems. It is located well above the Galactic plane (l=68.34∘, b=34.86∘, Harris 1996), is minimally affected by field star contamination, and is only slightly reddened (E(B–V)=0.02, Harris 1996). However, the cluster’s absolute age is far from being well established. Recent estimates based on updated cluster isochrones indicate that the absolute age of M92 ranges from Gyr (Salaris & Weiss 2002) to 14.82.5 Gyr (Carretta et al. 2000; Grundahl et al. 2000). A very accurate estimate of the absolute age of M92 was also provided by VandenBerg et al. (2002). They gave a new estimate of both distance modulus (DM) and reddening (=14.600.12, E(B–V)=0.023 mag) using the unique field, metal-poor ([Fe/H]–2.3) subdwarf calibrator with an accurate trigonometric parallax from Hipparcos (0.1). By adopting the quoted values and a set of cluster isochrones ([Fe/H]=–2.3, [/Fe]=0.3 dex) including gravitational settling and radiative accelerations they found an absolute age of 13.51.0-1.5 Gyr. Similar cluster ages have been found using the luminosity function (LF) of evolved stars, and indeed Cho & Lee (2007) found an age of 13.5 Gyr, while Paust, Chaboyer & Sarajedini (2007) found an age of 14.21.2 Gyr. Precise estimates of the GC absolute ages rely, from an empirical point of view, on four ingredients: distance, total metallicity, reddening, and photometric zero-points (Renzini 1991). Recent estimates of the cluster distance modulus based on different standard candles agree quite well. The true DM () of M92 based on main sequence (MS) fitting ranges from mag (Carretta et al. 2000) to mag (Kraft & Ivans 2003). Distances based on the near-infrared (NIR) Period-Luminosity (PL) relation of RR Lyrae stars (Bono et al. 2001; Cassisi et al. 2004; Catelan 2004; Del Principe et al. 2005, 2006; Sollima et al. 2006) suggest a similar mean value, i.e., =14.650.10 mag. Thus, the different distance estimates agree within their current uncertainties (1).
The uncertainty in the reddening correction for low-reddening GCs is typically of the order of 0.02 mag (Gratton et al. 2003; Bono et al. 2008 ). Experience has shown that the typical uncertainty in the zero-point of photometry from a given observing run is still of the order of 0.01–0.02 mag (e.g., Stetson, Bruntt & Grundahl 2003; Stetson, McClure & VandenBerg 2004; Stetson 2005). In the case of M92, this uncertainty may occasionally have been still larger (0.03 mag, Carretta et al. 2000). However, we believe that this systematic uncertainty can be reduced by averaging the photometric results of many observing runs, each of which has been individually calibrated to a common photometric standard system. The uncertainty affecting the total metallicity is of the order of 0.2 dex, if we include cluster-to-cluster uncertainties in iron and -element abundances as well as systematic uncertainties in the overall metallicity scale (Carretta et al. 2009).
Dating back to the seventies, spectroscopic measurements showed quite clearly the occurrence of star-to-star variations of C and N abundances in several GGCs (M5, M10, M13, M92, Cen, Osborn 1971; Cohen 1978). Subsequent investigations also found variations in Na (Cohen 1978; Peterson 1980), in Al (Norris et al. 1981) and in O (Pilachowski et al. 1983; Leep, Wallerstein & Oke 1986). The observational scenario was further enriched by the evidence that the molecular band-stregths of CN and CH appear to be anticorrelated (Smith 1987; Kraft 1994, and references therein). Both this anticorrelation and an anticorrelation between O–Na and Mg–Al have been observed in evolved (red giant branch [RGB], Horizontal Branch [HB]), and in unevolved MS stars of all GCs studied in sufficient detail (Suntzeff & Smith 1991; Cannon et al. 1998; Harbeck, Grebel & Smith 2003; Gratton et al. 2001; Ramirez & Cohen 2002; Carretta et al. 2007).
A working hypothesis to explain these observations is that a previous generation (first generation) of asymptotic giant branch (AGB) stars expelled processed material during thermal pulses, thus the subsequent stellar generation (second generation) formed with material that had already been polluted (Ventura et al. 2001; Gratton, Sneden & Carretta 2004, and references therein). In this scenario, the surface abundance of the second stellar generation is characterized by a significant He enrichment and by well defined C-N-O-Na anticorrelations. It has been suggested that typically the fraction of stars belonging to the second generation might be of order 50% (D’Antona & Caloi 2008). Alternative hypotheses are that cluster self-pollution is caused either by evolved RGB stars that experienced extra-deep mixing (Denissenkov & Weiss 2004) or by fast rotating intermediate-mass stars (Maeder & Meynet 2006; Prantzos & Charbonnel 2006; Decressin et al. 2007). M92 shows the typical variations in [C/Fe] and [N/Fe] (Carbon et al. 1982; Langer et al. 1986; Bellman et al. 2001), together with the usual anticorrelations (Pilachowski 1988; Sneden et al. 1991; Kraft 1994). However, up to now no evidence has been found concerning the occurrence of multiple stellar populations (Piotto et al. 2007; Cassisi et al. 2008). Therefore, M92 is a perfect laboratory to constrain the impact of canonical and CNO-enhanced mixtures on the estimate of the cluster age.
We take advantage of deep and accurate multiband optical images collected with both ground-based and space telescopes to constrain the absolute age of M92.
2. Data reduction and theoretical framework
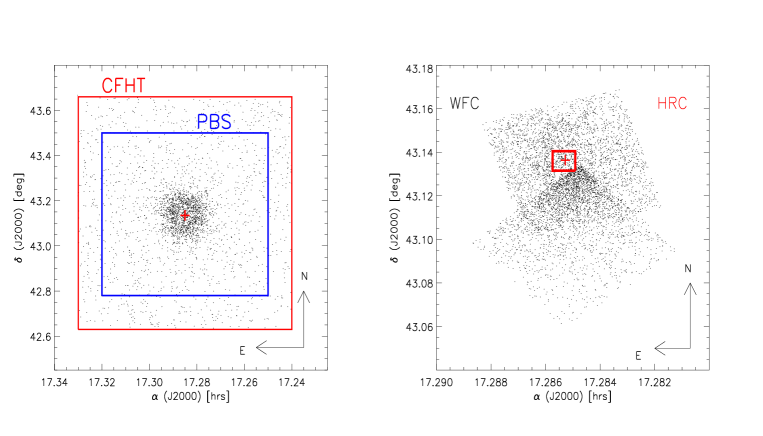
To provide robust estimates of the absolute age of M92, we secured optical images collected in three different photometric systems. In particular, we adopted both ground-based and space images. The ground-based data were collected either with MegaCam — the mosaic camera available at the Canada-France-Hawaii Telescope (CFHT: Sloan filters, field of view [FoV]: x, spatial resolution: 0′′.19/pixel) — or with several small/medium telescopes (Johnson-Cousins bands). The space data were collected with the Advanced Camera for Surveys (ACS) on the Hubble Space Telescope (HST) using both the Wide Field Channel (WFC, FoV: 202′′x202′′, 0′′.05/pixel) and the High Resolution Channel (HRC, FoV: x, 0′′.025/pixel). The sky coverage of the different data sets is plotted in Fig. 1.
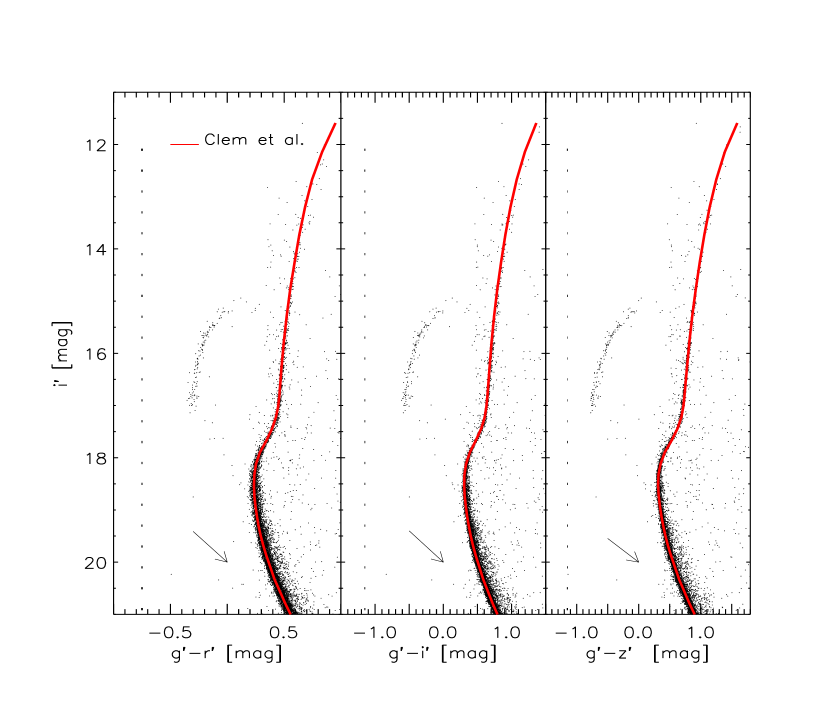
The CFHT data set includes 1440 CCD images collected in the Sloan bands –– with different exposure times (ETs). In particular, the shallow images were acquired with ETs of 5 () and 15 () s, while the deep images had ETs of 250 (), 300 () and 500 () s. The mean seeing in the different bands ranges from 0′′.75 () to 0′′.85 (). These images were pre-processed using Elixir (Magnier & Cuillandre 2004). For each chip of the mosaic camera we performed standard Point Spread Function (PSF) fitting photometry with DAOPHOT IV and ALLSTAR (Stetson 1987). The individual chips were rescaled to a common geometrical systems defined by a 1∘.51∘.5 Sloan Digital Sky Service (SDSS) reference image using DAOMATCH/DAOMASTER. We performed the final photometry by running ALLFRAME (Stetson 1994) simultaneously over the entire data set. We ended up with a photometric catalog including 84,000 stars with at least one measurement in two different photometric bands. The absolute calibration was performed using local secondary standards provided by Clem, VandenBerg & Stetson (2007). Fig. 2 shows three different Color-Magnitude Diagrams (CMDs) based on this catalog. Data plotted in this figure were selected according to photometric error mag, sharpness111The sharpness is an index that quantify the similarity between the shape of the measured objects and of the adopted PSF. abs(sha)1, and separation222The separation index quantifies the degree of crowding (Stetson et al. 2003) sep2.5. Moreover, to overcome the central crowding and contamination by field stars we selected stars in an annulus 60′′′′. Special attention was paied to the absolute and relative photometric zero-points. The precision for a single star is typically better than 0.02 mag. The precision of the different calibrations is supported by the very good agreement between the ridge lines (red lines in Fig. 2) provided by Clem et al. and our measurements of the cluster stars. The error budget accounting for intrinsic and calibration errors is smaller than 0.01 mag down to Main Sequence Turn-Off (MSTO) stars (19 mag).
In addition to the Sloan data, we also analyzed 782 CCD images collected in the Johnson-Cousins bands; these were reduced and calibrated by one of us (PBS) in an ongoing effort to provide homogeneous photometry on the Landolt (1992) photometric system333For more details see the following URL: http://www4.cadc-ccda.hia-iha.nrc-cnrc.gc.ca/ community/ STETSON/ standards/. These data were obtained in the course of 44 independent observing runs on nine telescopes (CFHT; DAO; INT; JKT; KPNO 0.9, 2.1, 4.0; NOT) from 1984 to 2002. Based upon frame-to-frame repeatability, we infer that at least some stars have magnitudes and colors individually precise to mag as faint as , which is mag fainter than the MSTO. Given the large number of independently calibrated observing runs, we believe that systematic calibration uncertainties should be well under 0.01 mag.
The ground-based images were supplemented with space images collected with ACS@HST. In particular, we used twelve images in two different pointings acquired with the WFC (see right panel of Fig. 1). The innermost WFC images444 GO-9453, PI: T. Brown were three with the -band (ETs of 0.5, 6, and 100 s) and covering the center of the cluster. The outermost WFC images555GO-10505, PI: C. Gallart were: three with the (ETs of 3, 20, 40 s) and three with the (ETs of 1, 10, 20 s) filters, located S–E from the cluster center. We used the FLT versions of these images and did not apply any cosmic ray mask, since the individual ETs are short. To overcome the crowding of the innermost regions (concentration c=1.81, Harris 1996), we also considered a set of images collected with the HRC (see right panel of Fig. 1). This data set includes 155 drizzled images collected with different exposure times (7410 s, 4120 s, 1040 s, 480 s, 34100 s, 8200 s, 4400 s, 9500 s, 81000 s)666GO-10335, PI: H. Ford. These images were pre-reduced using the HST pipeline. To reduce the ACS data, individual PSF were modeled for both chips using DAOPHOT/ALLFRAME programs, and the individual catalogs were calibrated following the Sirianni et al. (2005) prescriptions.
To compare the observations with the models we computed evolutionary tracks with an updated version of the FRANEC evolutionary code (Chieffi & Straniero 1989; Degl’Innocenti et al. 2008). For these models the OPAL 2006 equation of state (EOS) was adopted (Iglesias & Rogers 1996), together with radiative opacity tables by the Livermore group (Iglesias & Rogers 1996)777http://opalopacity.llnl.gov/opal.html for temperatures higher than 12,000oK; in this way the EOS and the opacity are fully consistent. The conductive opacities are from Shternin & Yakovlev (2006, see also Potekhin 1999) while the atmospheric opacities are from Ferguson et al. (2005). All the opacity tables were calculated for the Asplund, Grevesse & Sauval (2005, hereinafter AG05) solar mixture. The nuclear reaction rates, are from the NACRE compilation (Angulo et al. 1999). It is worth mentioning that the use of the new measurement of the 14N(p,)15O capture cross section (Formicola et al. 2004) would imply a systematic increase of 1 Gyr in the estimate of the GC absolute age (Imbriani et al. 2004). Our models include atomic He and metal diffusion, with diffusion coefficients given by Thoul, Bahcall & Loeb (1994). The reader interested in a detailed discussion of the uncertainties affecting the diffusion coefficients is referred to Bahcall, Pinsonneautl & Wasserburg (1995), Castellani et al. (1997) and to Guzik, Watson & Cox (2005). To model external convection we adopted, as usual, the mixing length formalism (Bohm-Vitense 1958). The mixing length parameter, , governing the efficiency of convection, was set at =2.0.
The metallicity adopted for the models is directly related to the observed [Fe/H] (when the AG05 solar mixture is assumed)
| (1) |
and -element abundances according to formula originally suggested by Salaris et al. (1993).
We adopted the value [Fe/H]=–2.32, given by spectroscopic measurements ([Fe/H]=–2.38) by Kraft & Ivans (2003,2004), but rescaled to the AG05 solar iron abundance. The adopted -element enhancement is [/Fe]=+0.3, while for the primordial helium content, we adopted the recent cosmological value =0.248 (Peimbert et al. 2007; Izotov, Thuan & Stasińska 2007). Note that the change from the old Grevesse & Sauval (1999) to the new AG05 solar mixture causes at fixed iron and -element abundances a decrease from =0.00014 to =0.00010. The difference is mainly caused by the decrease in CNO solar abundances. The interested reader is referred to the recent investigation by Caffau et al. (2010) for a new and independent measurements of solar CNO abundances. The cluster isochrones were transformed into the observational plane using the bolometric corrections (BCs) and the color-temperature relations (CTRs) provided by Brott & Hauschild (2005), while for the zero-age horizontal-branch (ZAHB) models we used the BCs and CTRs provided by Castelli & Kurucz (2003). In the following, the evolutionary models constructed assuming the above chemical abundances are called “canonical models”.
To account for C-N-O-Na anticorrelations, we used the same mixture adopted in the literature (Salaris et al. 2006; Cassisi et al. 2008; Pietrinferni et al. 2009) which is based on a mean value of the observed anticorrelations provided by Carretta et al. (2005). The changes in elemental abundance relative to the canonical -enhanced models are the following: N increased by 1.8 dex, C decreased by 0.6 dex, Na increased by 0.8 dex, and O decreased by 0.8 dex. These changes give an enhancement of a factor of three (+0.5 dex) in the [C+N+O/Fe] abundance. We did not include the Mg–Al anticorrelation because it minimally affects the evolutionary properties (Salaris et al. 2006). The increase in the total CNO abundance causes, at fixed iron abundance, an increase in the total metallicity from =0.00010 to =0.00023. This increase in metallicity makes the MSTO fainter and cooler as originally suggested by Bazzano et al. (1982) and by VandenBerg (1985). To constrain the impact of the different chemical mixtures, the CNO-enhanced models were constructed both at fixed total metallicity ([M/H]=–2.10) and at fixed iron content ([Fe/H]=–2.32). Note that the net effect of element diffusion in -enhanced models is to decrease the surface CNO abundances from [C/Fe]=0.00, [N/Fe]=0.00, [O/Fe]=0.30 at the zero age main sequence to [C/Fe]=-0.06, [N/Fe]=-0.04, [O/Fe]=0.27 dex at the MSTO. The and CNO-enhanced models show a similar decrese, and indeed the surface CNO abundances change from [C/Fe]=-0.60, [N/Fe]=1.80, [O/Fe]=-0.5 at the zero age main sequence to [C/Fe]=-0.65, [N/Fe]=1.76, [O/Fe]=-0.53 dex at the MSTO.
Transforming these evolutionary models into the observational plane requires a set of BCs and CTRs computed for the same mixtures, but they are not available yet. However, Cassisi et al. (2008) and Pietrinferni et al. (2009) found that BCs and CTRs computed assuming simple -enhanced mixtures mimic the same behaviour. Moreover, we found that BCs and CTRs hardly depend, at fixed total metallicity, on changes in the mixture. Accordingly, to transform the CNO-enhanced models constructed at fixed iron abundance, we adopted [Fe/H]=–2.32 and [/Fe]=+0.72 to obtain the same total metallicity.
3. Comparison between theory and observations
To compare theory and observations we assumed a true distance modulus mag, in good agreement with the distance estimated by Kraft & Ivans (2003, =14.75) and a cluster reddening of (Zinn 1985; Schlegel, Finkbeiner, & Davis 1989; Gratton et al. 1997; Kraft & Ivans 2003; Carretta et al. 2000). Moreover, we adopted a total to selective absorption ratio of =3.10 and the empirical reddening laws provided by Cardelli, Clayton & Mathis (1989). In particular, for the Sloan bands available at CFHT, we computed the following ratios: =, =0.87, =0.66 and =0.48. For the Johnson-Cousins filters we adopted =1.32 and =0.59, while for the ACS filters =1.20 and =0.55, respectively.
The top panels of Fig. 3 show the comparison between data collected in different photometric bands and -enhanced isochrones at fixed total metallicity ([M/H]=–2.10 dex) and two cluster ages 10 (red line) and 12 (green line) Gyr. The CFHT data (the first three panels from left to right) were selected according to photometric error ((color) 0.04), sharpness () and radial distance (). The same selection was adopted for the Johnson data (fourth panel), while the ACS data (fifth panel) were only selected on the basis of the photometric error. To validate the adopted values of the true distance modulus and the cluster reddening we also plotted the predicted ZAHB for the same chemical composition (blue line). We found that using the same distance and the same reddening the predicted “canonical” ZAHB agrees quite well with observations in the five different CMDs. Moreover, the comparison between theory and observations gives a cluster age of Gyr. The error budget is mainly driven by observational uncertainties affecting the metallicity measurements, and theoretical uncertainties in the input physics of the evolutionary models and transformations.
To constrain the impact of the CNO abundance on the age of M92, we performed the same comparison at fixed total metallicity, but using the CNO-enhanced models. The middle panels of Fig. 3 show the same data as plotted in the top panel, but the cluster isochrones are based on evolutionary models that are enhanced in both elements and CNO. The same enriched composition was also adopted to compute the ZAHB and we found no significant differences compared to the canonical models. Therefore, we assumed the same true distance modulus and cluster reddening as for the canonical predictions. The comparison between theory and observations indicates that and CNO enriched isochrones provide, at fixed total metallicity, the same cluster age ( Gyr) as the canonical -enhanced models. Data plotted in the bottom panels show the comparison between theory and observations for and CNO enhancements at fixed iron abundance ([Fe/H]=–2.32). Note that the total metallicity of the isochrones and of the ZAHB is now increased to [M/H]=–1.75. The cluster age we found is, for the same true distance and cluster reddening, minimally younger ( Gyr), but still agrees quite well () with the above estimates. It is worth noticing that canonical and CNO-enhanced isochrones show very similar morphologies in optical CMDs, as originally suggested by Salaris et al. (2006). This indicates that broad-band optical photometry like that investigated here cannot be safely adopted to constrain the occurrence of CNO-enhanced subpopulations in GCs.
To further constrain the impact of the CNO enhancement on the evolutionary properties of metal-poor GCs we also compared the observed star count ratios with the evolutionary lifetime ratios. The comparison between theory and observations was performed using evolved (RGB, HB) and MS stars. The MS stars were selected in a magnitude interval of 0.25 mag across the MSTO (), while the RGB stars were selected in the magnitude interval 15.0 17.2 (see the left panel of Fig. 4). To provide robust star counts over the entire body of the cluster we used ACS/HRC data for the regions across the very center of the cluster (), the ACS/WFC data up to radial distances of and the CFHT data for the remaining regions. To homogenize the star counts, the ACS/HRC and the ACS/WFC data collected in the -band were transformed into the -band, while those ones collected in the and in the -band were transformed into the and -band. The accuracy of the transformations is better than 0.02 mag. To estimate the completeness of the CFHT data in the regions outside the internal ACS/WFC pointing, we adopted the ACS/WFC data of the external pointing. We found that the completeness for 22 mag is 54% for 75′′ r 150′′, 82% for 150′′ r 200′′, and complete for larger distances. To investigate possible radial trends (Castellani et al. 2007; Sandquist & Martel 2007) the cluster was divided into eight annuli up to r=400′′. Each annulus includes the same number of stars ( 12,200).
The right panel of Fig. 4 shows the star count ratios HB/RGB (top), RGB/MS (middle) and HB/MS (bottom) as a function of the radial distance. Data plotted in this figure show the star counts are, within the errors, constant across the cluster. To estimate the lifetime ratios of the same evolutionary phases we adopted for the -enhanced models the evolutionary track of a stellar structure with =0.78, [M/H]=–2.10. Note that this is the TO mass of the 11 Gyr cluster isochrone. For the - and CNO-enhanced models with the same total metallicity we adopted the same stellar mass, while for those with the same iron abundance ([Fe/H]=–2.32) we adopted a stellar mass of =0.80. This is the TO mass of the 10 Gyr cluster isochrone. The HB evolutionary lifetime was estimated using a structure with stellar mass of =0.70. This mass value relies on the mean mass for HB stars found by Cassisi et a. (2001) and by Cho & Lee (2007) using synthetic HB models. Note that a change of 0.05 has a minimal impact on the HB lifetime (3-4%). By using the same true distance modulus and cluster reddening adopted to estimate the cluster age, we found that observed and predicted ratios agree quite well (1, see Table 1). It is worth mentioning that the stated uncertainties in the star counts include Poisson uncertainties and completeness uncertainties. For the predicted ratios we assumed an uncertainty of 10% for each of the different evolutionary phases (Castellani et al. 2007, and references therein).
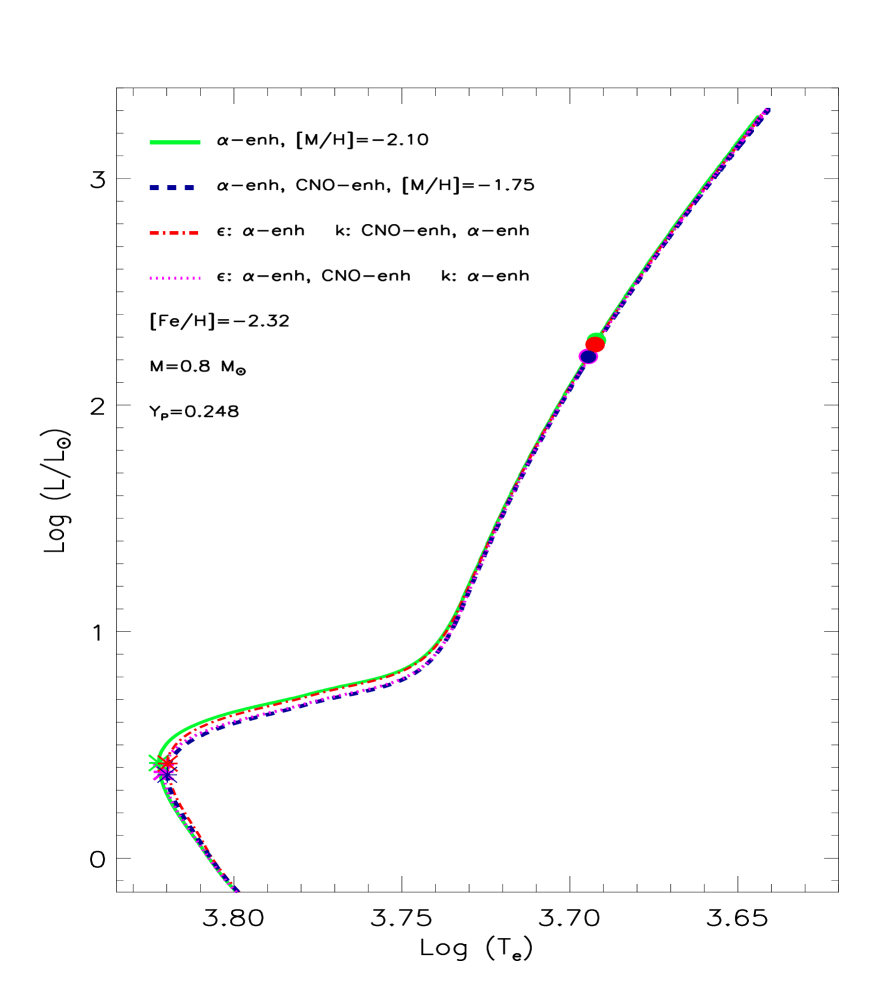
The anonymous referee suggested that we specify the impact of the different chemical mixtures on both the opacities and the burning processes. To disentangle the effects, we performed a series of numerical experiments following the approach recently adopted by Pietrinferni et al. (2009) for a chemical composition that is at the metal-rich end of GCs, namely [Fe/H]=–0.7 dex, by Ventura et al. (2009) for the metal-intermediate ([Fe/H] –1.2 dex) GC NGC 1851 and by Di Criscienzo et al. (2010) for the metal-poor ([Fe/H] –2 dex) GC NGC 6397. We performed these experiments at fixed iron content to reveal the differential effects produced by either -enhanced or - plus CNO-enhanced mixtures. The green solid and the blue dashed lines plotted in Fig. 5 show two evolutionary tracks constructed at fixed stellar mass (M=0.80 M⊙), iron content ([Fe/H]=–2.32) and helium content (=0.248), but the former assumes a canonical -enhanced mixture ([M/H]=–2.10, =0.00010), while the latter assumes the - and CNO-enhanced mixture ([M/H]=–1.75, =0.00023). As expected, the difference is minimal along the MS, but becomes relevant between the TO and the base of the RGB. During these evolutionary phases the track with the - and CNO-enhanced mixture is, at fixed effective temperature, systematically fainter. The MSTO is fainter and cooler. The RGB bump, i.e., the evolutionary phases during which the H-burning shell encounters the chemical discontinuity in the envelope left over by the first dredge-up is slightly fainter in the - and CNO-enhanced track than in the -enhanced track. The difference is caused by the fact that the convective envelope during the earlier RGB phases deepens more in the former than in the latter case (Salaris et al. 2006; Pietrinferni et al. 2009; Di Cecco et al. 2010), because the increase in the total metallicity causes an increase in the opacity.
To further investigate the specific impact of - and CNO-enhanced mixture on the opacity we also constructed an evolutionary track in which the nuclear burning processes use an -enhanced mixture, while the opacity is based on an and CNO-enhanced mixture. The red dashed-dotted line plotted in Fig. 5 shows that this track is, at fixed effective temperature, slightly fainter than the track using an -enhanced mixture (green solid line) both in the nuclear burning and in the opacity. As a consequence, the MSTO of the former track is marginally cooler, while the RGB bump is minimally fainter than in the latter one.
To study the impact of - and CNO-enhanced mixture on the nuclear network we also constructed an evolutionary track in which the nuclear burning processes use an - and CNO-enhanced mixture, while the opacity is based on an -enhanced mixture. The pink dotted line plotted in Fig. 5 shows that this track is, at fixed effective temperature, minimally brighter than the track with an - and CNO-enhanced mixture both in the nuclear burning and in the opacity. The same outcome applies to the MSTO and to the RGB bump.
These findings indicate that the changes in the luminosity and in the effective temperature of the MSTO, when switching from an -enhanced to an - and CNO-enhanced mixture, are caused by changes both in the nuclear burning and in the opacity. On the other hand, the change in the luminosity of the SGB is caused primarily by the change in the nuclear burning processes. The same outcome applies for the decrease in the luminosity of the RGB bump. These results support the dependences found by Pietrinferni et al. (2009) for more metal-rich stellar structures.
4. Conclusions
We present different optical data sets for M92 collected in three different photometric systems (SDSS, ; Johnson-Cousins, ; ACS Vegamag, , , ) and with ground-based and space (HST) telescopes. Special attention was given to the precision of the photometric zero-points. By using the same true distance modulus and cluster reddening our canonical -enhanced isochrones constructed assuming [Fe/H]=–2.32, [/Fe]=0.3 and =0.248, account for the observed features in five different CMDs. We found a cluster age of 111.5 Gyr, supporting previous results based on cluster isochrones and luminosity functions. The same outcome applies to the comparison between the HB stars and the predicted ZAHB. We also investigated the impact of a CNO enriched chemical composition and we found that - and CNO- enhanced isochrones at fixed total metallicity ([M/H]=–2.10) provide, within the errors, the same cluster age. Moreover, - and CNO- enhanced isochrones at fixed iron abundance ([Fe/H]=–2.32, [M/H]=–1.75) give a cluster age that is minimally younger (101.5 Gyr).
We also investigated the star count ratios for evolved (RGB,HB) and MSTO stars. We found that they do not show any radial trend when moving from the very center to the outermost cluster regions. Moreover and even more importantly, star count ratios agree quite well (within 1) with the lifetime ratios of the same evolutionary phases.
The above results indicate that the occurrence of CNO enriched subpopulations has a minimal impact on the cluster age in the metal-poor domain. The same outcome applies to star count ratios and evolutionary lifetimes. These findings appear quite robust, since they rely on different photometric data sets covering the entire body of the cluster and on the same evolutionary framework.
We also note that isochrones including atomic He and metal diffusion give cluster ages that are 1 Gyr younger than canonical isochrones (Castellani et al. 1997). This means that current findings support previous theoretical predictions for typical GCs by Salaris et al. (2006) and recent age estimates for metal-poor GCs provided by Marin-Franch et al. (2009). Finally, it is worth emphasizing that current age estimates agree quite well with the cluster age provided by VandenBerg et al. (2002) using an independent but similar theoretical framework. The difference is larger than one only for the cluster age based on the CNO-enhanced models computed at fixed iron content (101.5 vs 13.51.5 Gyr). This difference can be explained if we account for the mild change in the shape of the SGB region of these isochrones when compared with the canonical ones.


| Ratios | HB/RGB | RGB/MS | HB/MS |
|---|---|---|---|
| Empiricala | |||
| Theoryb | |||
| Theoryc | |||
| Theoryd |
References
- Angulo et al. (1999) Angulo C. et al., 1999, Nucl. Phys., 656, 3
- Asplund & Grevesse (2005) Asplund, M., Grevesse, N., & Sauval, A.J. 2005, in Cosmic Abundances as Records of Stellar Evolution and Nucleosynthesis, eds. F.N. Bash, & T.J. Barnes, ASP Conf. Series, 336, 25 [AG05]
- bahcall (1995) Bahcall, J. N., Pinsonneault, M. H., & Wasserburg, G. J. 1995, RevModPhys, 67, 781
- bazzano et al. (1982) Bazzano, A., Caputo, F., Sestili, M., & Castellani, V. 1982, A&A, 111, 312
- belman et al. (2001) Bellman, S., Briley, M. M., Smith, G. H., & Claver, C. F. 2001, PASP, 113, 326
- bhom (1958) Bohm-Vitense, E. 1958, Zeitschrift für Astrophysik, 46, 108
- bono (2001) Bono, G., Caputo, F., Castellani, V., Marconi, M., & Storm, J., 2001, MNRAS, 326, 1183
- bono (2008) Bono, G. et al. 2008, ApJ, 686, 87
- Brott et al. (2005) Brott, I.,& Hauschildt, P. H. 2005, ESASP, 576, 565
- Caffau et al (2019) Caffau, E. et al. 2010, A&A, 514, 92
- cannon (1998) Cannon, R. D., Croke, B. F. W., Bell, R. A., Hesser, J. E., & Stathakis, R. A. 1998, MNRAS, 298, 601
- carbon (1982) Carbon, D. F., Romanishin, W., Langer, G. E., Butler, D., Kemper, E., Trefzger, C. F., Kraft, R. P., & Suntzeff, N. B. 1982, ApJS, 49, 207
- card (1989) Cardelli, J. A., Clayton, G. C., & Mathis, J. S. 1989, IAUS, 135, 5
- carretta et al (2009) Carretta, E., Bragaglia, A., Gratton, R., D’Orazi, V., & Lucatello, S. 2009, A&A, 508, 695
- Carretta et al. (2007) Carretta, E., Bragaglia, A., Gratton, R. G., Lucatello, S., & Momany, Y. 2007, A&A , 464, 927
- Carretta et al. (2000) Carretta, E., Gratton, R. G., Clementini, G., & Fusi Pecci, F. 2000, ApJ, 533, 215
- Carretta et al. (2005) Carretta, E., Gratton, R. G., Lucatello, S., Bragaglia, A., & Bonifacio, P. 2005, A&A, 433, 597
- cassi (2004) Cassisi, S., Castellani, M., Caputo, F.,& Castellani, V., 2004, A&A, 426, 641
- Cassisi et al. (2001) Cassisi, S., Castellani, V., Degl’Innocenti, S., Piotto, G., & Salaris, M. 2001, A&A, 366, 578
- cassi (2008) Cassisi, S., Salaris, M., Pietrinferni, A., Piotto G. , Milone, A. P., Bedin, L. R., & Anderson, J. 2008, ApJ, 672, L115
- castellani (2007) Castellani, V. et al. 2007, ApJ, 663, 1021
- castellani (1997) Castellani, V., Ciacio, F., degl’Innocenti, S., & Fiorentini, G. 1997, A&A, 322, 801
- Castelli et al. (2003) Castelli, F.,& Kurucz, R. L. 2003, IAUS, 210, A20
- cate (2004) Catelan, M. 2004, ASPC, 310, 113
- Chieffi & Straniero (1989) Chieffi A., & Straniero O. 1989, ApJS, 71, 47
- Cho et al. (2007) Cho, D. H., & Lee, S. G. 2007, AJ, 133, 2163
- clem (2007) Clem, J. L., VandenBerg, D. A., & Stetson, P. B. 2007, AJ, 134, 1890
- Cohen (1978) Cohen, J. G. 1978, ApJ, 223, 487
- dancal (2008) D’Antona, F.,& Caloi, V. 2008, MNRAS, 390, 693
- decre (2007) Decressin, T., Meynet, G., Charbonnel, C., Prantzos, N., & Ekström, S. 2007, A&A, 464, 1029
- Degl’Innocenti et al. (2008) Degl’Innocenti S., Prada Moroni P. G., Marconi M., & Ruoppo A., 2008, Astrophysics and Space Science, 316, 215
- delprincipe (2006) Del Principe, M. et al. 2006, ApJ, 652, 362
- delprincipe (2005) Del Principe, M., Piersimoni, A. M., Bono, G., Di Paola, A., Dolci, M., & Marconi, M. 2005, AJ, 129, 2714
- Denissenkov & Weiss (2004) Denissenkov, P. A., & Weiss, A. 2004, ApJ, 603, 119
- Di Cecco et al. (2010) Di Cecco, A. et al. 2010, ApJ, 712, 527
- Di Criscienzo et al (2010) Di Criscienzo, M., D’Antona, F., & Ventura, P. 2010, A&A, 511, 70
- Ferguson et al. (2005) Ferguson J.W., Alexander, D. R., Allard, F., Barman, T., Bodnarik, J. G., Hauschildt, P. H., Heffner-Wong, A., & Tamanai, A. 2005, ApJ, 623, 585
- Formicola et al. (2004) Formicola, A. et al. 2004, Phys. Lett. B, 591, 61
- grat (2001) Gratton, R. G. et al. 2001, A&A, 369, 87
- gra (2003) Gratton, R. G., Bragaglia, A., Carretta, E., Clementini, G. , Desidera, S., Grundahl, F.;, & Lucatello, S. 2003, A&A, 408, 529
- gratt (1997) Gratton, R. G., Fusi Pecci, F., Carretta, E., Clementini, G., Corsi, C. E., & Lattanzi, M. 1997, ApJ, 491, 749
- Gratton et al. (2004) Gratton, R., Sneden, C., & Carretta, E. 2004, A&S, 42, 385
- Grevesse & Sauval (1999) Grevesse, N., & Sauval, A. J. 1999, A&A, 347, 348
- gru (2000) Grundahl, F., VandenBerg, D. A., Bell, R. A., Andersen, M. I.,& Stetson, P. B. 2000, AJ, 120, 1884
- guzik (2005) Guzik, J. A., Watson, L. S., & Cox, A. N. 2005, ApJ, 627, 1049
- har (2003) Harbeck, D., Grebel, E. K., & Smith G. H. 2003, ANS, 324, 78
- Harris (1996) Harris, W. E. 1996, AJ, 112, 1487
- Iglesias & Rogers (1996) Iglesias, C., & Rogers, F.J., 1996, ApJ, 464, 943
- Imbriani et al. (2004) Imbriani, G. et al. 2004, A&A, 420, 625
- Izotov et al. (2007) Izotov, Y. I., Thuan, T. X., & Stasińska, G., 2007, 662, 15
- Kraft (1994) Kraft, R. P., 1994, PASP, 106, 553
- Kraft & Ivans (2003) Kraft, R. P., & Ivans, I.I. 2003, PASP, 115, 143
- Kraft & Ivans (2004) Kraft, R. P., & Ivans, I.I. 2004, arXiv:astro-ph/0305380v1
- Landolt (1992) Landolt, A. U. 1992, AJ, 104, 340
- langer (1986) Langer, G. E., Kraft, R. P., Carbon, D. F., Friel, E., & Oke, J. B. 1986, PASP, 98, 473
- Leep et al. (1986) Leep, E. M., Wallerstein, G., & Oke, J. B. 1986, AJ, 91, 1117
- maeder (2006) Maeder, A., & Meynet, G. 2006, A&A, 448, L37
- magner (2004) Magnier, E. A., & Cuillandre, J.-C. 2004, PASP, 116, 449
- marin (2009) Marin-Franch, A. et al. 2009, ApJ, 694, 1498
- Norris et al. (1981) Norris, J., Cottrell, P. L., Freeman, K.C., & Da Costa, G. S. 1981, ApJ, 244,205
- Osborn (1971) Osborn, W. 1971, The Observatory, 91, 223
- pau (2007) Paust, N. E. Q., Chaboyer, B., & Sarajedini, A. 2007, AJ, 133, 2787
- Peimbert et al. (2007) Peimbert, M., Luridiana, V., Peimbert, A., & Carigi, L. 2007, Astronomical Society of the Pacific Conference Series, 374, 81
- Peterson (1980) Peterson, R. C. 1980, ApJ, 237, 87
- Pietrinferni et al. (2009) Pietrinferni, A., Cassisi, S., Salaris, M., Percival, S., & Ferguson, J. W. 2009, ApJ, 697, 275
- pila (1983) Pilachowski, C. A., Bothun, G. D., Olszewski, E. W., & Odell, A. 1983, ApJ, 273, 187
- pio07 (2007) Piotto, G. et al. 2007, ApJ, 661, L53
- Potekhin (1999) Potekhin A.Y., 1999, A&A, 351, 787
- pra (2006) Prantzos, N.,& Charbonnel, C. 2006, A&A, 458, 135
- ramirez (2002) Ramirez, S. V., & Cohen, J. G. 2002, AJ, 123, 3277
- ren (1991) Renzini, A. 1991, in Observational Test of Cosmological Inflaction, ed. T. Shanks, A. J. Banday, & R. S. Ellis (Dordrecht: Kluwer), 131]
- Salaris et al. (1993) Salaris, M., Chieffi, A., & Straniero, O. 1993, ApJ, 414, 580
- Salaris & Weiss (2002) Salaris, M. & Weiss, A. 2002, A&A, 388, 492
- Salaris et al. (2006) Salaris, M., Weiss, A., Ferguson, J. W., & Fusilier, D. J. 2006, ApJ, 645, 1131
- sand (2007) Sandquist, E. L., & Martel, A. R. 2007, ApJ, 654L, 65
- schlegel (19989) Schlegel, D. J., Finkbeiner, D. P., & Davis, M. 1998, ApJ, 500, 525
- Shternin & Yakovlev (2006) Shternin, P.S. & Yakovlev, D.G., 2006, PhRvD, 74, (4) 3004
- siri (2005) Sirianni, M. et al. 2005, PASP, 117, 1049
- Smith (1987) Smith, G. H., 1987, PASP, 99, 67
- sneden (1991) Sneden, C., Kraft, R. P., Prosser, C. F., & Langer, G. E. 1991, AJ, 102, 2001
- sollima (2006) Sollima, A., Pancino, E., Ferraro, F. R., Bellazzini, M., Straniero, O., & Pasquini, L. 2005, ApJ, 634, 332
- ste1 (1987) Stetson, P. B. 1987, PASP, 99, 191
- ste2 (1994) Stetson, P. B. 1994, PASP, 106, 250
- stetson (2000) Stetson, P. B. 2000, PASP, 112, 925
- stetson (2005) Stetson, P. B. 2005, PASP, 117, 563
- stetson (2003) Stetson, P. B., Bruntt, H., & Grundahl, F. 2003, PASP, 115, 413
- stetson (2004) Stetson, P. B., McClure, R. D., & VandenBerg, D. A. 2004, PASP, 116, 1012
- sun (1991) Suntzeff, N. B.,& Smith, V. V. 1991, ApJ, 381, 160
- Thoul et al. (1994) Thoul A., Bahcall J. & Loeb A. 1994, ApJ, 421, 828
- vandenberg (1985) VandenBerg, D. A. 1985, in Proc. ESO Whorkshop 21, Production and Distribution of C, N, O Elements, ed. I. J. Danziger, F. Matteucci, & K. Kjar (Garching: ESO), 73
- vandenberg (2002) VandenBerg, D. A., Richard, O., Michaud, G., & Richer, J. 2002, ApJ, 571, 487
- ven (2001) Ventura, P., D’Antona, F., Mazzitelli, I.,& Gratton, R. 2001, ApJ, 550, L65
- ven (2009) Ventura, P., Caloi, V., D’Antona, F., Ferguson, J., Milone, A.,& Piotto, G. P. 2009, MNRAS, 399, 934
- zinn (1985) Zinn, R. 1985, ApJ, 293, 424