Phase Field Crystal Study of Symmetric Tilt Grain Boundaries of Iron
Abstract
We apply the phase field crystal model to study the structure and energy of symmetric tilt grain boundaries of bcc iron in 3D. The parameters for the model are obtained by using a recently developed eight-order fitting scheme [A. Jaatinen et al., Phys. Rev. B 80, 031602 (2009)]. The grain boundary free energies we obtain from the model are in good agreement with previous results from molecular dynamics simulations and experiments.
1 Introduction
One of the challenges in modern computational materials science is being able to access phenomena that take place on different time and length scales. Recently, a new model called the phase field crystal (PFC) model has been constructed that describes phenomena taking place on atomic length scale but diffusive time scales (Elder et al., 2002), the combination of which has been unaccessible for molecular dynamics (MD) simulations using present day computers. The PFC method is able to achieve this combination of scales by replacing the individual atoms in MD simulations by a continuous field that exhibits the periodic nature of the underlying atomic lattice in the solid phase, but evolves in diffusive time scales. As the original formulation of the PFC model relies on a phenomenologically constructed free energy functional, it has proven challenging to quantitatively relate the parameters that enter the PFC model to the properties of real materials. In a recent study, we have shown how the PFC model can be modified in such a way that many relevant material properties can be included in the PFC free energy, while still conserving most of the computational simplicity of the model (Jaatinen et al., 2009). This can be achieved using the so-called Eighth Order fitting (EOF) scheme. In the present work, we use the EOF-PFC model to study the energy of symmetrically tilted grain boundaries of bcc iron near its melting point. Results of our calculations will provide an independent theoretical prediction for the grain boundary energy of iron near its melting point. Perhaps more importantly, they also provide indication on whether the EOF scheme is a good candidate for future studies of grain boundary related phenomena, such as grain boundary premelting (Berry et al., 2008; Mellenthin et al., 2008) and nanocrystalline deformation (Elder and Grant, 2004; Stefanovic et al., 2009), with the PFC model.
2 Model
The phase field crystal (PFC) model describes crystallization phenomena and has been applied to many different problems in materials science. Originally, the model was phenomenologically postulated in the spirit of the Ginzburg-Landau theory by Elder et al. (2002). The model consists of an order parameter field that is driven by dissipative, conserved dynamics to minimize a free energy functional, whose ground state exhibits a periodic structure commensurate with the crystal symmetry of interest. More specifically, the deterministic equation of motion for the locally conserved order parameter field in these models is given by
| (1) |
where is mobility and is free energy of the system as a functional of the field . The most usual choice of a free energy functional for PFC studies is the form derived by Swift and Hohenberg (1977) for a study of convective instabilities. Here we briefly describe the procedure suggested by Jaatinen et al. (2009) for obtaining a free energy that is capable of describing body-centered cubic materials from a fundamental basis.
Derivation of our free energy starts from the classical density-functional theory (DFT) of freezing, first pioneered by Ramakrishnan and Yussouff (1979). The simplest free energy used in DFT of freezing studies can be obtained by expanding the excess (over ideal gas) contribution to the free energy around a uniform reference density , leading to
| (2) |
where is the free energy difference between a given state and the reference, is the thermal energy and the order-parameter field is related to the ensemble-averaged one-particle density through . The function entering Eq. (2) is the two-body direct correlation function (DCF) of the reference liquid, which is related to the total pair correlation function, and thus structure factor of the liquid through the well-known Ornstein-Zernike relation.
In principle it is possible to use Eq. (2) for PFC studies; however, in practice solutions of this equation are very sharply peaked in space (around atomic lattice positions) which restricts numerical calculations to very small systems. To overcome this difficulty, we make two approximations. Firstly, the non-local part of is simplified by expanding the DCF in -space up to eighth order as
| (3) |
where the parameter is the position of the first maximum in the original DCF, and and are chosen such that the expansion reproduces the position, height and curvature of the first maximum, and the value of the original DCF. This is achieved by choosing
| (4) |
where primes denote derivatives with respect to , and
| (5) |
As shown by Jaatinen et al. (2009), this eighth order expansion provides an excellent fit from to the first peak in in the case of iron. However, for the density oscillations whose wave vector corresponds to a larger than , the expanded free energy now results in a significantly larger free energy penalty, thus reducing stability of the solid phase. In order to partly correct this error, and to further simplify the mathematical form of the free energy, the local part is expanded in a fourth order power series as
| (6) |
The coefficient for the second order term in this series is obtained from a Taylor series in order to conserve the linear stability of the model. For the third and fourth order terms we have included constants and , which are chosen such that the solid will stabilize in the model, with the correct amplitude of density fluctuations corresponding to the first star of reciprocal lattice vectors, . This is approximately achieved by choosing them as
| (7) |
where is height of the first peak in the structure factor of the reference liquid (Jaatinen et al., 2009). With these approximations, the free energy finally becomes
| (8) |
In our previous study we fitted the parameters of the current model with molecular dynamics simulation data from Wu and Karma (2007), complemented by experimental data from Itami and Shimoji (1984) and Jimbo and Cramb (1993), for iron. The resulting model parameters are Å-1, , and for the DCF part, and and for the non-linear part. The reference temperature and density, necessary for converting model results into SI units are K and Å-3. We have also shown that with these parameters, the model produces very reasonable predictions for bulk modulus, solid-liquid coexistence gap and low index surface free energies. (Jaatinen et al., 2009) In the next section, we will show that this model is also capable of describing grain boundaries in iron.
3 Grain boundaries
Using the model and parameters described in the previous section, we have studied the symmetrically tilted grain boundaries of iron. Three choices of tilting axis, , and , were studied. The calculations were performed at a density of , which is just above the density of the solid at coexistence. A density close to the solid-liquid coexistence was chosen due to the fact that the model parameters have been obtained to reproduce the selected properties of iron close to its melting point (Jaatinen et al., 2009).
First, we have found the lattice constant of the bcc phase that minimizes the free energy at the density in question. Then, a computational box of dimensions , and periodic boundary conditions in all directions was initialized by using the one-mode approximation,
| (9) |
where , being the lattice spacing, and is the amplitude of density fluctuations. First, a rotation to the one-mode approximation was applied such that the tilt axis was parallel to the axis of the computational box. Then, in the region , the one-mode approximation was rotated in the plane by an angle , and in the region by an angle , creating two symmetrically tilted grain boundaries, located at and , with a tilting angle . The tilting angles and box dimensions were chosen such that the periodic pattern of the lattice continues smoothly over the periodic boundaries in the and directions, and an integer number of atomic planes was placed between the two grain boundaries in the system. The system size in the direction of the tilting axis, , was chosen to be the closest distance between two similar atomic planes in the -direction. In the perpendicular directions, and were varied from case to case, such that for small angles, the simulation box contained several thousands of maxima, while for large angle calculations, only hundreds of maxima were required, due to the smaller spacing between dislocations at the boundary.


In order to find the minimum energy of the system with the grain boundaries, we have numerically integrated Eq. (1) until convergence, using the semi-implicit operator splitting method of Tegze et al. (2009). The Laplace operator is discretized in -space as . Grain boundary free energy per unit area, , is then obtained from
| (10) |
where is the average free energy density of the final configuration, and is free energy density of a non-rotated system.
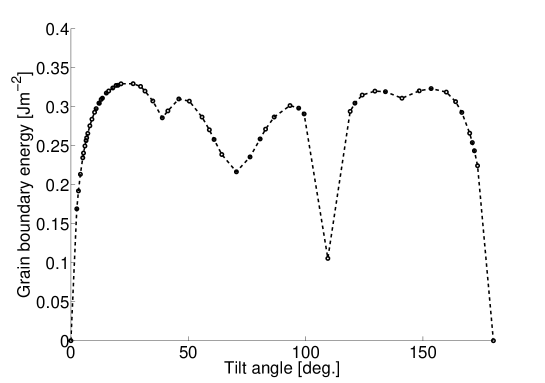
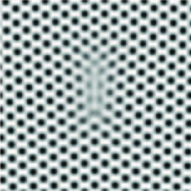
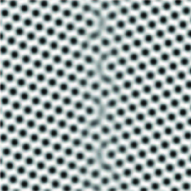


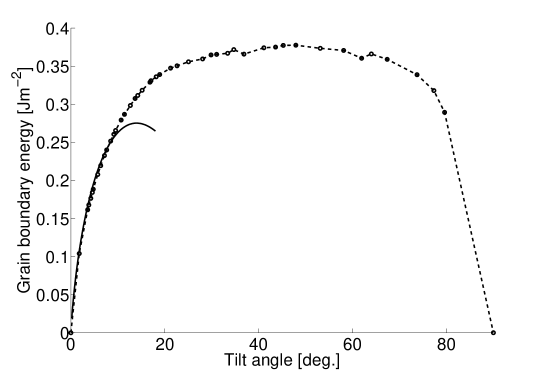
Fig. 1 shows the results of our grain boundary free energy calculations, and Fig. 2 shows three example final configurations for the case. As in previous studies utilizing the original PFC free energy functional (Elder et al., 2002; Elder and Grant, 2004; Mellenthin et al., 2008), we find that for small angles the grain boundary energy closely follows the expression by Read and Shockley (1950),
| (11) |
where is an energy scale that depends on elastic properties of the material studied, and the constant depends on the dislocation core energy. In addition, both of these constants depend on the orientation of the grain boundary. In the present work, as we have not developed numerical tools for quantifying all the properties that enter the expressions for and (Read and Shockley, 1950), we have chosen to treat them as fitting parameters. The best fit to the current data gives Jm-2 and .
For large values of , the changes in are moderate, with the maximum value being 0.377 Jm-2. By close inspection of Fig. 1 one can distinguish small energy cusps at angles corresponding to bcc () and bcc () grain boundary planes. Both of these energy cusps correspond to a low coincidence site lattice (CSL) . However, for the other low- grain boundaries, for example the bcc (), no such cusps were observed. More generally, we do not observe any clear correlation between the CSL and energies of large angle grain boundaries. Thus, our results do not agree with Zhang et al. (2005) who found, using molecular statics with modified analytical embedded atom method, that the energy of symmetrically tilted grain boundaries in iron increases with increasing . Our results agree much better with Shibuta et al. (2008) who have performed molecular dynamics simulations with Finnis-Sinclair potential to calculate the energies of different symmetric tilt boundaries of iron in different temperatures. Their results are qualitatively (but not quantitatively) very similar to ours, and they also observe the small energy cusp at bcc present in our results as well. However, unlike in our results, Shibuta et al. (2008) observe another small energy cusp at bcc. The cusp we observe at bcc is not present in their results.
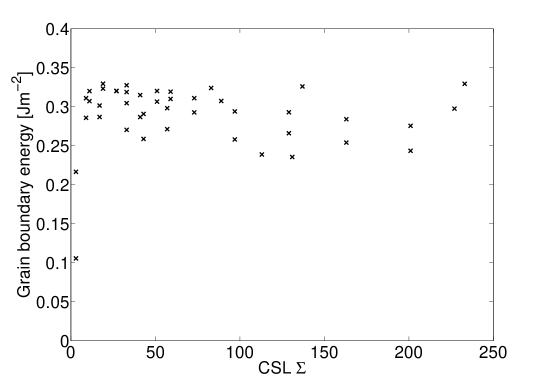
Results of our grain boundary free energy calculations for the case are shown in Fig. 3, and example final configurations for this case are shown in Fig. 4. The low-angle behavior of vs. is qualitatively very similar to the case, but at large angles, interesting features are observed. There is a deep minimum corresponding to bcc (), which is a twin boundary. The grain boundary energy in this minimum is only approximately third of the maximum values observed. Other clear local minima are observed at bcc (), bcc () and bcc (). Thus for grain boundaries all angles with correspond to a local minimum in grain boundary energy. However, as in the case, we do not find a more general correlation between and , as can be seen from Fig 5, where we plot vs. for the case. In comparison of our results with Shibuta et al. (2008), we find that our depth of the bcc minimum is in an excellent agreement with their work. However, their bcc minimum is much less pronounced than in our work, and the remaining two of the local minima, that we observed, were not observed in their study at all. Instead, they observe a small energy cusp at bcc (), which we did not find anomalous.
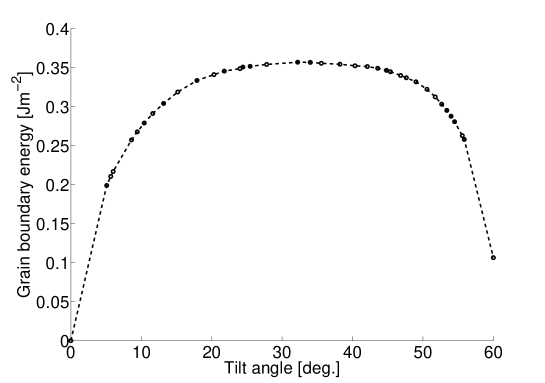
Results for the case where tilting axis is in the direction are shown in Fig. 6. In this case, the energy increases with increasing misorientation, without any noteworthy energy cusps, until reaching a maximum value at . When further increasing from that maximum, the grain boundary decreases, as the orientation gets closer to the partial matching at . Finally, at (i.e. bcc) the grain boundary energy is 0.357 Jm-2, which is approximately 30 % of the maximum value. The place of the maximum energy, magnitude of the value compared to the maximum, and the absence of energy cusps agree very well with the molecular dynamics results of Shibuta et al. (2008).
Experimentally, the large angle grain boundary energy of iron has been determined to be 0.468 Jm-2 (Murr, 1975), in good agreement with our maximum value. It is also worthwhile noting that the agreement of our results with Murr (1975) for the ratio of large angle grain boundary energy to the solid-liquid surface free energy is even better: in the present model (solid-liquid surface energy from Jaatinen et al. (2009)), where the values from Murr (1975) give . When comparing our values for grain boundary energies with the results of the previously mentioned atomistic calculations, we observe that the grain boundary energies obtained by Zhang et al. (2005) are of the order of several Joules per square meter, being significantly higher than the values reported here or those reported by by Shibuta et al. (2008). It should be noted that the calculations of Zhang et al. (2005) were conducted at absolute zero temperature, not near the melting point, which perhaps explains this discrepancy. The grain boundary energies reported by Shibuta et al. (2008), on the other hand, reach a maximum of approximately 1.6 Jm-2 at moderate temperatures, rising to approximately 2.4 Jm-2 close to the melting point. A likely reason for our grain boundary energies being closer to the experimental values than those of Shibuta et al. (2008) is that we are, in accordance to the experimentalists, actually measuring the grain boundary free energy, unlike Shibuta et al. (2008) who only measure the excess energy of creating a grain boundary, without taking into account the entropic part of the free energy.
4 Conclusion
We have applied the recently established EOF-PFC model to study the structure and energy of symmetric tilt grain boundaries in iron, with the axis of rotation parallel to and directions. For small misorientation angles, we found that the grain boundary energy increases with increasing misorientation, in agreement with the Read-Shockley equation. For large misorientation angles, we observed local minima in the grain boundary energy vs. misorientation curve, many of which have been observed in molecular dynamics simulations as well. The local minima are associated with low values of the coincidence site lattice , but no general correlation between and the grain boundary energy was found. In general, the qualitative agreement between present results and previous MD results at finite temperature was found to be good. Quantitatively, the agreement of our result with an experimental value for the large angle grain boundary energy is better than that from the MD. As our phase field crystal results agree well with previous MD study of grain boundaries in iron, and an experimental large angle grain boundary energy, they may even be considered an independent prediction for the angular dependence of grain boundary energy in iron. More importantly, they show the potential of the EOF-PFC in modeling materials properties where grain boundaries play an important role.
5 Acknowledgements
This work was supported in part by the Academy of Finland through its Center of Excellence COMP grant, Tekes through its MASIT33 project, and joint funding under EU STREP Grant No. 016447 MagDot and NSF DMR Grant No. 0502737. K.R.E. acknowledges support from NSF under Grant No. DMR-0906676.
References
- Berry et al. (2008) Berry, J.; Elder, K. R.; Grant, M.: Melting at dislocations and grain boundaries: A phase field crystal study. Phys. Rev. B, 77, (2008), 224114.
- Elder and Grant (2004) Elder, K. R.; Grant, M.: Modeling elastic and plastic deformations in nonequilibrium processing using phase field crystals. Phys. Rev. E, 70, (2004), 051605.
- Elder et al. (2002) Elder, K. R.; Katakowski, M.; Haataja, M.; Grant, M.: Modeling elasticity in crystal growth. Phys. Rev. Lett., 88, (2002), 245701.
- Itami and Shimoji (1984) Itami, T.; Shimoji, M.: Application of simple model theories to thermodynamic properties of liquid transition metals. J. Phys. F: Met. Phys., 14, (1984), L15–L20.
- Jaatinen et al. (2009) Jaatinen, A.; Achim, C. V.; Elder, K. R.; Ala-Nissila, T.: Thermodynamics of bcc metals in phase-field-crystal models. Phys. Rev. E, 80, (2009), 031602.
- Jimbo and Cramb (1993) Jimbo, I.; Cramb, A. W.: The density of liquid iron-carbon alloys. Metall. Mater. Trans. B, 24, (1993), 5–10.
- Mellenthin et al. (2008) Mellenthin, J.; Karma, A.; Plapp, M.: Phase-field crystal study of grain-boundary premelting. Phys. Rev. B, 78, (2008), 184110.
- Murr (1975) Murr, L. E.: Interfacial Phenomena in Metals and Alloys. Addison Wesley, New York (1975).
- Ramakrishnan and Yussouff (1979) Ramakrishnan, T. V.; Yussouff, M.: First-principles order-parameter theory of freezing. Phys. Rev. B, 19, (1979), 2775–2794.
- Read and Shockley (1950) Read, W. T.; Shockley, W.: Dislocation models of crystal grain boundarie. Phys. Rev., 78, (1950), 275 – 289.
- Shibuta et al. (2008) Shibuta, Y.; Takamoto, S.; Suzuki, T.: A molecular dynamics study of the energy and structure of the symmetric tilt boundary of iron. ISIJ Int., 48, (2008), 1582–1591.
- Stefanovic et al. (2009) Stefanovic, P.; Haataja, M.; Provatas, N.: Phase-field crystal study of deformation and plasticity in nanocrystalline materials. Phys. Rev. E, 80, (2009), 046107.
- Swift and Hohenberg (1977) Swift, J.; Hohenberg, P. C.: Hydrodynamic fluctuations at the convective instability. Phys. Rev. A, 15, (1977), 319 – 328.
- Tegze et al. (2009) Tegze, G.; Bansel, G.; Tóth, G. I.; Pusztai, T.; Fan, Z.; Gránásy, L.: Advanced operator splitting-based semi-implicit spectral method to solve the binary phase-field crystal equations with variable coefficients. J. Comp. Phys., 228, (2009), 1612–1623.
- Wu and Karma (2007) Wu, K.-A.; Karma, A.: Phase-field crystal modeling of equilibrium bcc-liquid interfaces. Phys. Rev. B, 76, (2007), 184107.
- Zhang et al. (2005) Zhang, J.-M.; Huang, Y.-H.; Wu, X.-J.; Xu, K.-W.: Energy calculation for symmetric tilt grain boundaries in iron. Appl. Surf. Sci., 252, (2005), 4936–4942.
Address: 1Department of Applied Physics and
COMP Center of Excellence, Helsinki University of Technology, P.O. Box 1100, Helsinki FI-02015 TKK,
Finland
2Department of Materials Science and Engineering,
Helsinki University of Technology, P.O. Box 6200, Helsinki FIN-02015
TKK,
Finland
3Institut für Theoretische Physik II: Weiche Materie,
Heinrich-Heine-Universität, Universitätsstrasse 1, D-40225
Düsseldorf, Germany
4Department of Physics, Oakland University, Rochester, Michigan
48309-4487, USA
5Department of Physics, Brown University, Providence, Rhode
Island 02912-1843, USA
email: Akusti.Jaatinen@tkk.fi