11email: smartin@eso.org 22institutetext: Instituto de Radioastronomía Milimétrica (IRAM), Avda. Divina Pastora, 7, Local 20, E-18012 Granada, Spain 33institutetext: Centro de Astrobiología (CSIC-INTA), Ctra. de Torrejón Ajalvir, km. 4, E-28850 Torrejón de Ardoz, Madrid, Spain 44institutetext: Joint ALMA Observatory, Av. El Golf 40, Piso 18, Las Condes, Santiago, Chile
A large 12C/13C isotopic ratio in M 82 and NGC 253
Abstract
Aims. To derive carbon isotopic ratios from optically thin tracers in the central regions of the starburst galaxies M 82 and NGC 253.
Methods. We present high sensitivity observations of CCH and two of its 13C isotopologues, C13CH and 13CCH, as well as the optically thin emission from C18O and 13C18O. We assume the column density ratio between isotopologues is representative of the 12C/13C isotopic ratio.
Results. From CCH, lower limits to the 12C/13C isotopic ratio of 138 in M 82, and 81 in NGC 253, are derived. Lower limits to the 12C/13C ratios from CO isotopologues support these.13C18O is tentatively detected in NGC 253, which is the first reported detection in the extragalactic ISM. Based on these limits, we infer ratios of 16O/18O and in M 82 and NGC 253, respectively, and 32S/34S in NGC 253. The derived CCH fractional abundances toward these galaxies of are in good agreement with those of molecular clouds in the Galactic disk.
Conclusions. Our lower limits to the 12C/13C ratio from CCH are a factor of larger than previous limits. The results are discussed in the context of molecular and nucleo-chemical evolution. The large 12C/13C isotopic ratio of the molecular ISM in these starburst galaxies suggest that the gas has been recently accreted toward their nuclear regions.
Key Words.:
Galaxies: abundances - Galaxies: evolution - Galaxies: individual: NGC 253, M 82 - Galaxies: ISM - Galaxies: nuclei - Galaxies: starburst1 Introduction
Isotopic ratios in the interstellar medium (ISM) of starburst (SB) galaxies provide important clues on their nucleo-chemical evolution. In particular, the 12C/13C isotopic ratio is believed to be a good tracer of the chemical evolution of the Galaxy (see e.g. Audouze 1985) This ratio is understood to be a direct measurement of the primary to secondary nuclear processing (Wilson & Rood 1994). While 12C is a primary product of stellar nucleosynthesis, quickly produced via He burning in massive stars that can be formed in first generation metal-poor stars, 13C is a secondary nuclear product from 12C seeds (Meyer 1994; Wilson & Matteucci 1992; Wilson & Rood 1994).
So far, only lower limits to the abundance ratios could be determined for some starburst galaxies. A value of was derived toward the nuclei of the nearby galaxy NGC 253 based on observations of CN, CS, and HNC (Henkel et al. 1993) and further supported by CO, HCN, and HCO+ data on M 82 and NGC 4945 (Henkel & Mauersberger 1993; Henkel et al. 1994). Additional CN data on M 82 and IC 342 resulted in lower limits to the ratio of and respectively (Henkel et al. 1998). The CO and 13CO multi-transition non-LTE study toward M 82 by (Mao et al. 2000) excludes 12C/13C ratios below 25 and point toward a ratio . Apart from these multi-molecule studies toward the nearest SB galaxies, and limited by sensitivity, only the 12CO/13CO ratio is available for a small sample of nearby sources (Young & Sanders 1986; Sage & Isbell 1991; Aalto et al. 1991; Casoli et al. 1992; Paglione et al. 2001). However, the lines from the species used so far can be severely affected by optically depth effects as estimated by Henkel et al. (1993). Thus optically thin species are crucial to derive accurate isotopic ratios.
Ethynyl (CCH) has the brightest line in the 2 mm spectral scans carried out toward NGC 253 and M 82 (Martín et al. 2006, Aladro et al. in prep.). Its hyperfine structure, unresolved in these objects, can help to constrain the opacity through the observed lineshape. Within the Galaxy, CCH emission appears tightly bound to massive star formation at all evolutionary stages (Beuther et al. 2008).
In this paper, we present observations of CCH and two of its 13C isotopologues, and provide a more stringent lower limit to the 12C/13C isotopic ratio in the nuclear starburst ISM of M 82 and NGC 253. Additionally we present CO observations in the 18O substitution and the double isotopologue 13C18O. The derived 12C/13C ratio from CO, though not as stringent as that from CCH, supports the idea of larger isotopic ratios in these starbursts than previously determined.
2 Observations and Results
We have observed the group of hyperfine (hf) transitions of CCH (174.635 GHz), C13CH (170.491 GHz), and 13CCH (168.274 GHz), and the transition of C18O (109.782 GHz) and 13C18O (104.711 GHz) toward M 82 and NGC 253. Observations were carried out with the IRAM 30m telescope (Pico Veleta, Spain). In the case of M 82, observations were aimed toward the north-eastern molecular lobe at the offset position from the center (). NGC 253 observations were aimed at the central position () for C18O while the 13C18O observations were slightly offset at . The beam widths at these frequencies were and , for CCH and CO lines, respectively. We used the wobbler switched observing mode with a symmetrical beam throw of in azimuth and a wobbling frequency of 0.5 Hz. As spectrometers we used the MHz filter banks and WILMA autocorrelator (2 MHz) for CCH and CO, respectively. The CCH data for NGC 253 were extracted from the 2 mm line survey by Martín et al. (2006). Figs. 1 shows the observed spectra.
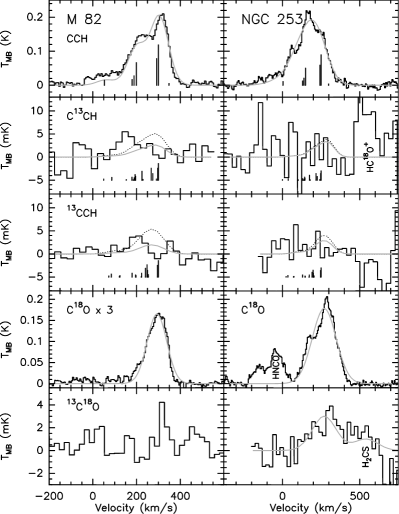
The hf structure of CCH is unresolved. We fitted a comb of Gaussian profiles at the positions of the hf lines and intensity ratios fixed by their spectroscopic parameters (Müller et al. 2001), shown as vertical lines in Fig. 1. In M 82, the wing of emission at low velocities in CCH is a contribution of both the fainter hf components and the emission from the nuclear region, as also seen in the C18O profile. Though two velocity components could be fit to the CCH profile in NGC 253 (Martín et al. 2006), for the purposes of this paper we just fit a single velocity component. We assumed optically thin emission to fit the line profiles. We show the resulting fits as grey lines in Fig 1 while the fitting parameters are shown in Table 1. Neither C13CH nor 13CCH emission were detected toward M 82 and NGC 253. No line contamination by other species is expected at the frequencies of the isotopologues. We have estimated upper limits to the integrated intensities of the overall line profile of these isotopologues, calculated from the corresponding spectral parameters (Müller et al. 2001). We assumed a peak intensity of the overall profile at a level (for 187 and 224 km s-1 wide channels, corresponding to that from single Gaussian fit to the CCH features) for M 82 and NGC 253, respectively.
Line emission from 13C18O is not detected toward M 82 and only tentatively toward NGC 253. This tentative 13C18O detection, the first in the extragalactic ISM, appears blended to the H2CS transition at 104.616 GHz. The derived intensity of supports the tentative detection reported by Martín et al. (2005).
With the fitted integrated intensities we have estimated the beam averaged column densities for each species under the local thermodynamic equilibrium assumption. An excitation temperature of 10 K was assumed for the calculations. The assumed temperature , being the same for all isotopologues, has no effect on the derived column density ratios. As reported from CO observations, the different isotopologues might be tracing different gas component (Wall & Jaffe 1990; Aalto et al. 1994; Meier et al. 2000), and therefore the similar excitation temperature assumption would not be fulfilled. As a test case, if the 13C isotopologue was emitted from a gas component with 50 K, our assumption would lead to the 12C/13C ratio being overestimated by a factor of . Multi transition observations of CCH and its 13C isotopologues would be needed to accurately establish the magnitude of such effect. On the other hand, we do not expect it to be significant in the optically thin CO isotopologues. The derived CCH and CO beam averaged column densities and upper limits are shown in Table 1.
The derived lower limits to the 12C/13C ratios are of and for M 82 and NGC 253, respectively. We can further constraint these limits by averaging the spectra of both C13CH and 13CCH. The resulting limit to the column densities raises the limits to the isotopic ratios up to 12C/13C and , respectively. Using CO we obtain ratios of and , respectively.
| Source | Isotopologue | a𝑎aa𝑎aThis value refers to the brightest component in the group. | a𝑎aa𝑎aThis value refers to the brightest component in the group. | b𝑏bb𝑏b rms at the resolution shown in Fig. 1. | c𝑐cc𝑐cBeam averaged column density assuming a K. | ||||
| (K km s-1) | (km s-1) | (km s-1) | (mK) | (mK) | |||||
| M 82 | CCH | 307 | 97 | 119 | 7.6 | … | |||
| C13CH | d𝑑dd𝑑d limit to the integrated intensity | … | … | … | 2.3 | ||||
| 13CCH | d𝑑dd𝑑d limit to the integrated intensity | … | … | … | 1.7 | ||||
| 13CCH+C13CH | d𝑑dd𝑑d limit to the integrated intensity | … | … | … | 1.5 | ||||
| C18O | 293 | 106 | 55 | 1.9 | … | ||||
| 13C18O | 0.8 | ||||||||
| NGC 253 | CCH | 216 | 171 | 90 | 8.4 | … | |||
| C13CH | d𝑑dd𝑑d limit to the integrated intensity | … | … | … | 4.5 | ||||
| 13CCH | d𝑑dd𝑑d limit to the integrated intensity | … | … | … | 3.3 | ||||
| 13CCH+C13CH | d𝑑dd𝑑d limit to the integrated intensity | … | … | … | 2.2 | ||||
| C18O | 270 | 183 | 178 | 3.7 | … | ||||
| 13C18O | e𝑒ee𝑒eTentative detection blended to an H2CS transition. Velocity and width parameters were fixed to fit both lines simultaneously. | 270 | 183 | 3 | 1.5 |
3 12C/13C isotopic ratio from CCH and CO
Estimating the interstellar isotopic ratio from the derived molecular abundances one has to discuss two main drawbacks, opacity and fractionation effects.
Lines of 12C isotopologues of CO and abundant species such as HCN or HCO+, are likely to be optically thick. If our derived lower limits to the carbon isotopic ratio applies to CO, it would imply opacities of and for NGC 253 and M 82, respectively, as derived from the observed 12CO to 13CO integrated intensity ratios by Sage & Isbell (1991). Higher opacities will lead to a decrease of the measured 12C/13C ratio from CO and possibly other abundant species. Therefore, molecules with opaque lines poorly constrain the 12C/13C ratios. From the hf fit to the line profile we can exclude large opacity effects affecting the CCH lines. Moreover, small opacity effects on the CCH observed lines would result in an increase of our lower limits to the 12C/13C isotopic ratios.
Fractionation (Watson et al. 1976; Langer et al. 1984; Wilson & Rood 1994) might produce an enhancement of 13CO in the outer layers of molecular clouds. Thus the observed CO would be tracing regions with lower 12CO/13CO ratio than the actual 12C/13C isotopic ratio. The CCH observations reported by Sakai et al. (2010) toward the dark cloud TMC-1 and the star forming region L1527, also show a 12C/13C ratio a factor of larger than the interstellar ratio. However, the chemical fractionation claimed in their work is mostly effective at very low temperatures ( K) while isotopic exchange reactions rates tend to balance out at higher temperatures (Woods & Willacy 2009). This fractionation is also expected to affect species other than CO, such as HCO+ and HCN. Moreover, the models by Woods & Willacy (2009) show how species such as HCN and HNC should result in even larger ratios than those from CCH, which is not observed in galaxies. Thus, chemical fractionation cannot explain the large CCH ratio observed in the warm ISM in the central regions of galaxies. 12C/13C isotopic ratios of derived from CCH in the GC (Armijos et al. in prep.), similar to those derived from other molecular species, support the hypothesis that fractionation does not play an important role.
We conclude that ours limits for the 12C/13C isotopic ratios derived from CCH isotopologues are representative of the ISM in the observed SB galaxies.
4 A large 12C/13C isotopic ratio in starbursts
Our results from CCH show that the 12C/13C isotopic ratio in the SB environment is much higher than the value of measured in the Galactic Center (GC) region (Wilson & Rood 1994). Moreover, our limits are clearly higher than previous limits for SB galaxies of (Henkel et al. 1993; Henkel & Mauersberger 1993). We can exclude a ratio of 40 or lower, since in that case we would have detected the 13CCH emission in both galaxies and that of C13CH in M 82. If the 12C/13C ratios derived from CCH are representative of the overall 12C/13C, it would imply this ratio to be at least a factor of larger than previously reported in the starburst ISM. Though lower, the limits to the ratios we derive from CO isotopologues also suggest larger 12C/13C isotopic ratios than previously measured.
Single dish 12CO/13CO ratios have been measured as high as 55 and 44 toward NGC 4195 and NGC 6240, respectively (Casoli et al. 1992). However the latter was disproved by further mapping resulting in a 12CO/13CO ratio of (Aalto & Hüttemeister 2000). In Arp 299 (consisting of a merger of IC 694 and NGC 3690), a ratio of 60 was found toward the nucleus of IC 694, and in the surrounding disk (Aalto et al. 1999), with the ratio ranging over at single dish resolution. Recently, a 12CO/13CO ratio of was reported toward the Cloverleaf quasar at (Henkel et al. 2010)
5 Revisited carbon isotopic ratio implications
5.1 The oxygen 16O/18O ratio
The uncertainty in the measured 12C/13C ratio directly affects the determination of the 16O/18O ratio based on measurements of 13CO and C18O. For NGC 253, Harrison et al. (1999) presented 13CO and C18O measurements. If we use our revised lower 12C/13C limit of , their 13CO/C18O intensity ratio would correspond to an abundance ratio of 16O/18O Toward M 82, using the 13CO observations from (Mao et al. 2000), observed at the same position, we derive a 16O/18O. Both limits are now closer to the ratio of found within the 4 kpc molecular ring of the Milky Way (Wilson & Rood 1994).
5.2 The sulfur 32S/34S ratio
The 32S/34S ratio based on measurements of 13CS and C34S will also be affected, as that derived by Martín et al. (2005) for NGC 253. Their value of the 32S/34S ratio of would be doubled up to a value , closer to the value of measured in the Galactic disk (Chin et al. 1996). The ratio of 32S/34S toward NGC 4945 (Wang et al. 2004) might also be underestimated as it was based on the CS/C34S ratio assuming no significant saturation of the CS lines.
5.3 H2 column density determination
Our large lower limits to the 12C/13C ratio impacts the H2 column density () derived from the optically thin CO isotopologues. These isotopologues, less affected by optical depth, are expected to be better suited to trace the overall molecular material than the main isotopologue. However, the determination of the will depend on the isotopic ratios. If we apply our new limits to the oxygen isotopic ratio to estimate the from C18O, and assuming a conversion factor CO/H (Frerking et al. 1982), we derive beam averaged limits of for M 82 and for NGC 253. We then infer CCH fractional abundances of and , respectively, in good agreement with the Galactic abundances found in prestellar cores (, Padovani et al. 2009), dark clouds (, Wootten et al. 1980), diffuse clouds (, Lucas & Liszt 2000) and about two orders of magnitude above the abundances in hot cores (, Nummelin et al. 2000).
Moreover, assuming our derived ratio of 16O/18O a better agreement is found between the gas mass estimate from 1.3 mm dust observations (Krugel et al. 1990) and that from C18O (see Table 2 in Mauersberger et al. 1996, where a ratio of 16O/18O was used). This agreement further supports our result.
We can estimate a conversion factor of cm-2(K km s-1), using the CO integrated intensity of 920 K km s-1 (Mauersberger et al. 1996). This conversion factor, significantly lower by a factor of than the “standard” value within the Galaxy of cm-2(K km s-1) (Solomon et al. 1987; Strong et al. 1988), is a factor of 3 larger than the values proposed for the starburst ISM of cm-2(K km s-1) (Mauersberger et al. 1996; Martín et al. 2010).
6 Chemical evolution of starburst galaxies
After several cycles of star formation, nucleosynthesis will enrich the interstellar medium with processed material which could be “dated” by using the 12C/13C isotopic ratio. Thus, the 12C/13C ratio is expected to decrease with time. The solar system ratio of 89 (Wilson & Rood 1994) is thought to be representative of the local ISM when the Solar System formed, 4.6 billion years ago. Although the ratio toward both M 82 and NGC 253 is observed to be a factor of larger within the nuclear region than in the outer disk, this ratio is unlikely to be representative of the ratio due to opacity effects and/or variation of the CO/H2 conversion factor, as reported by Paglione et al. (2001). On the contrary, a positive gradient towards the central region is expected, due to the molecular material being further processed by stars, and similar to what is observed with optically thin tracers in the Milky Way (Langer & Penzias 1990; Wilson & Rood 1994). It is remarkable that, taking into account the ratios derived in this work, the 12C/13C ratio in SB galaxies is larger than in the Galactic center, the solar neighborhood (Wilson & Rood 1994) and even in the low metallicity ISM of the Large Magellanic Cloud (LMC; 12C/13C, Wang et al. 2009). Similarly, the oxygen and sulfur isotopic ratios measured do not evidence an enrichment of 18O and 34S in the starburst ISM with respect to the values measured in the local ISM (Wilson & Rood 1994). Moreover, our lower limit to 16O/18O is slightly above the value of 250 measured toward the Galactic Center (Wilson & Rood 1994), and the 32S/34S would be at least a factor of 2 above the expected ratio within the central 3 kpc of the Galaxy from the gradient found by Chin et al. (1996). The 16O/18O and 32S/34S are significantly lower and similar, respectively, to those measured in the LMC (16O/18O=2000, 32S/34S, Wang et al. 2009).
An enhanced of star formation was likely triggered across the disk of M 82 as a result of a close encounter with M 81 about 220 Myr ago. However, the ongoing nuclear starbursts started Myr ago, with nuclear star clusters dated between 7 and 15 Myr (Konstantopoulos et al. 2009). This dating is in agreement with the two short duration bursts of star formation in the nuclear region of M 82, with peaks at 5 and 10 Myr (Förster Schreiber et al. 2003). The nucleus of NGC 253 appear to host an even younger starburst with a median age of Myr (Fernández-Ontiveros et al. 2009). With a average lifetime of 10 Myr, massive star clusters formed in the starburst appear not to have efficiently enriched the ISM in their nuclear region. Furthermore, the enriched material could have been banished from the nuclear region via the starburst driven super-winds in both galaxies (Heckman et al. 1990).
One possible interpretation would be that in very young SBs one should find large 12C/13C ratios due to fast evolution of very massive stars, leading to a overproduction of 12C relative to 13C, synthesized in intermediate mass stars (Henkel & Mauersberger 1993). However, such fast evolution might also result in an overproduction of 18O (Henkel & Mauersberger 1993) which is not observed. Moreover, if the time scale of the main burst in the nucleus of M 82 is less than 15 Myr (Förster Schreiber et al. 2003; Konstantopoulos et al. 2009), then most of the 12C enriched material would be in the hot outflow with contribution to the molecular gas. The time scale is rather short to have the 12C enriched material well mixed over the 300 pc of our beam size, in both M 82 and NGC 253. It would mean that the enhanced 12C molecular gas is confined to shells around the stellar clusters with a huge 12C/13C ratio.
Thus, our measured isotopic ratios suggest that the bulk of the mass of molecular material within the nuclear regions of M 82 and NGC 253 consists of little or unprocessed gas by massive stars. This suggests that the ISM which is supporting the starbursts in M 82 and NGC 253 has been recently funneled toward their centers from the outer regions or accreted by these galaxies. The evolution of these isotopic ratios as a function of metallicity is not clear from the available observations. However, Wang et al. (2009) found the 16O/18O ratio to be a good tracer of metallicity. The lower limits to the ratio found toward M 82 and NGC 253, larger than the value toward the Galactic Center, is consistent with that found within the 4 kpc molecular ring and even that within the local ISM. This would support the idea of inflowing material from the outer regions of these galaxies toward their centers conforming the gas concentration unleashing their starburst events, where enriched material from previous star formation events would contribute little to the bulk of the starburst molecular material.
Acknowledgements.
This work has been partially supported by the Spanish Ministerio de Ciencia e Innovación under projects ESP2007-65812-CO2-01 and AYA2008-06181-C02-02.References
- Aalto et al. (1994) Aalto, S., Booth, R. S., Black, J. H., Koribalski, B., & Wielebinski, R. 1994, A&A, 286, 365
- Aalto & Hüttemeister (2000) Aalto, S. & Hüttemeister, S. 2000, A&A, 362, 42
- Aalto et al. (1991) Aalto, S., Johansson, L. E. B., Booth, R. S., & Black, J. H. 1991, A&A, 249, 323
- Aalto et al. (1999) Aalto, S., Radford, S. J. E., Scoville, N. Z., & Sargent, A. I. 1999, in IAU Symposium, Vol. 186, Galaxy Interactions at Low and High Redshift, ed. J. E. Barnes & D. B. Sanders, 231
- Beuther et al. (2008) Beuther, H., Semenov, D., Henning, T., & Linz, H. 2008, ApJ, 675, L33
- Casoli et al. (1992) Casoli, F., Dupraz, C., & Combes, F. 1992, A&A, 264, 49
- Chin et al. (1996) Chin, Y., Henkel, C., Whiteoak, J. B., Langer, N., & Churchwell, E. B. 1996, A&A, 305, 960
- Fernández-Ontiveros et al. (2009) Fernández-Ontiveros, J. A., Prieto, M. A., & Acosta-Pulido, J. A. 2009, MNRAS, 392, L16
- Förster Schreiber et al. (2003) Förster Schreiber, N. M., Genzel, R., Lutz, D., & Sternberg, A. 2003, ApJ, 599, 193
- Frerking et al. (1982) Frerking, M. A., Langer, W. D., & Wilson, R. W. 1982, ApJ, 262, 590
- Harrison et al. (1999) Harrison, A., Henkel, C., & Russell, A. 1999, MNRAS, 303, 157
- Heckman et al. (1990) Heckman, T. M., Armus, L., & Miley, G. K. 1990, ApJS, 74, 833
- Henkel et al. (1998) Henkel, C., Chin, Y., Mauersberger, R., & Whiteoak, J. B. 1998, A&A, 329, 443
- Henkel et al. (2010) Henkel, C., Downes, D., Weiss, A., Riechers, D., & Walter, F. 2010, ArXiv e-prints
- Henkel & Mauersberger (1993) Henkel, C. & Mauersberger, R. 1993, A&A, 274, 730
- Henkel et al. (1993) Henkel, C., Mauersberger, R., Wiklind, T., et al. 1993, A&A, 268, L17
- Henkel et al. (1994) Henkel, C., Whiteoak, J. B., & Mauersberger, R. 1994, A&A, 284, 17
- Konstantopoulos et al. (2009) Konstantopoulos, I. S., Bastian, N., Smith, L. J., et al. 2009, ApJ, 701, 1015
- Krugel et al. (1990) Krugel, E., Chini, R., Klein, U., et al. 1990, A&A, 240, 232
- Langer et al. (1984) Langer, W. D., Graedel, T. E., Frerking, M. A., & Armentrout, P. B. 1984, ApJ, 277, 581
- Langer & Penzias (1990) Langer, W. D. & Penzias, A. A. 1990, ApJ, 357, 477
- Lucas & Liszt (2000) Lucas, R. & Liszt, H. S. 2000, A&A, 358, 1069
- Mao et al. (2000) Mao, R. Q., Henkel, C., Schulz, A., et al. 2000, A&A, 358, 433
- Martín et al. (2010) Martín, S., George, M. R., Wilner, D. J., & Espada, D. 2010, AJ, 139, 2241
- Martín et al. (2006) Martín, S., Martín-Pintado, J., & Mauersberger, R. 2006, A&A, 450, L13
- Martín et al. (2005) Martín, S., Martín-Pintado, J., Mauersberger, R., Henkel, C., & García-Burillo, S. 2005, ApJ, 620, 210
- Mauersberger et al. (1996) Mauersberger, R., Henkel, C., Wielebinski, R., Wiklind, T., & Reuter, H. 1996, A&A, 305, 421
- Meier et al. (2000) Meier, D. S., Turner, J. L., & Hurt, R. L. 2000, ApJ, 531, 200
- Meyer (1994) Meyer, B. S. 1994, ARA&A, 32, 153
- Müller et al. (2001) Müller, H. S. P., Thorwirth, S., Roth, D. A., & Winnewisser, G. 2001, A&A, 370, L49
- Nummelin et al. (2000) Nummelin, A., Bergman, P., Hjalmarson, Å., et al. 2000, ApJS, 128, 213
- Padovani et al. (2009) Padovani, M., Walmsley, C. M., Tafalla, M., Galli, D., & Müller, H. S. P. 2009, A&A, 505, 1199
- Paglione et al. (2001) Paglione, T. A. D., Wall, W. F., Young, J. S., et al. 2001, ApJS, 135, 183
- Sage & Isbell (1991) Sage, L. J. & Isbell, D. W. 1991, A&A, 247, 320
- Sakai et al. (2010) Sakai, N., Saruwatari, O., Sakai, T., Takano, S., & Yamamoto, S. 2010, A&A, 512, A31
- Solomon et al. (1987) Solomon, P. M., Rivolo, A. R., Barrett, J., & Yahil, A. 1987, ApJ, 319, 730
- Strong et al. (1988) Strong, A. W., Bloemen, J. B. G. M., Dame, T. M., et al. 1988, A&A, 207, 1
- Wall & Jaffe (1990) Wall, W. F. & Jaffe, D. T. 1990, ApJ, 361, L45
- Wang et al. (2009) Wang, M., Chin, Y., Henkel, C., Whiteoak, J. B., & Cunningham, M. 2009, ApJ, 690, 580
- Wang et al. (2004) Wang, M., Henkel, C., Chin, Y., et al. 2004, A&A, 422, 883
- Watson et al. (1976) Watson, W. D., Anicich, V. G., & Huntress, Jr., W. T. 1976, ApJ, 205, L165
- Wilson & Matteucci (1992) Wilson, T. L. & Matteucci, F. 1992, A&A Rev., 4, 1
- Wilson & Rood (1994) Wilson, T. L. & Rood, R. 1994, ARA&A, 32, 191
- Woods & Willacy (2009) Woods, P. M. & Willacy, K. 2009, ApJ, 693, 1360
- Wootten et al. (1980) Wootten, A., Bozyan, E. P., Garrett, D. B., Loren, R. B., & Snell, R. L. 1980, ApJ, 239, 844
- Young & Sanders (1986) Young, J. S. & Sanders, D. B. 1986, ApJ, 302, 680