On the Populations of Radio Galaxies with Extended Morphology at
Abstract
Extended extragalactic radio sources have traditionally been classified into Fanaroff & Riley (FR) I and II types, based on the ratio of the separation between the brightest regions on either sides of the host galaxy and the total size of the radio source (). In this paper we examine the distribution of various physical properties as a function of of 1,040 luminous () extended radio galaxies (RGs) at selected with well-defined criteria from the SDSS, NVSS, and FIRST surveys. About of the RGs are lobe-dominated (LD), and have prominent jets. If we follow the original definition of the FR types, i.e., a division based solely on , FR I and FR II RGs overlap in their host galaxy properties. However, the rare, LD sources with and [O III] line luminosity are markedly different on average from the rest of the RGs, in the sense that they are hosted in lower mass galaxies, live in relatively sparse environments, and likely have higher accretion rates onto the central supermassive black hole (SMBH). Thus these high emission line luminosity, high LD RGs and the rest of RGs form a well-defined dichotomy. Motivated by the stark differences in the nuclear emission line properties of the RG subsamples, we suggest that the accretion rate onto the SMBH may play the primary role in creating the different morphologies. At relatively high accretion rates, the accretion system may produce powerful jets that create the “classical double” morphology (roughly corresponding to the LD sources with and emission lines); at lower accretion rates the jets from a radiatively inefficient accretion flow generate radio lobes without apparent “hot spots” at the edge (corresponding to the majority of LD sources). At slightly lower accretion rates and in galaxies with dense galactic structure, sources with prominent jets result. It is possible that while the high accretion rate systems could affect sub-Mpc scale environments, the jets from lower accretion rate systems may efficiently suppress activity within the host galaxies.
Subject headings:
galaxies: active – galaxies: elliptical and lenticular, cD – radio continuum: galaxies1. Introduction
Ever since the seminal work by Fanaroff & Riley (1974, hereafter FR), radio galaxies (RGs) have been broadly categorized into two types according to their large-scale radio morphology (e.g., De Young 2002). FR proposed a simple binary classification scheme, based on the ratio of the separation between the brightest regions on either sides of the RG and the total size of the radio source. If , the source was considered type II (“edge-brightened”); otherwise the source belonged to type I (“edge-darkened”). FR found that nearly all 3CR (Mackay, 1971) radio sources with power () at 178 MHz greater than W/Hz were type II, while nearly all of those weaker than this power were type I.
Subsequent studies have found an overlap in radio power (about two orders of magnitude) for the transition from one type to the other (e.g., Baum & Heckman, 1989). In a series of papers, Owen and collaborators suggested this division between type I and II RGs was a function of the optical luminosity () of the host galaxies, in the sense that the division was at higher radio power for more luminous galaxies (; Owen & Laing, 1989; Owen & White, 1991; Owen, 1993; Ledlow & Owen, 1996). A corollary is that, at fixed radio power, type I sources are hosted in more optically luminous galaxies than the type IIs. At a given optical luminosity, Owen et al. suggested that the transition as a function of radio power was quite abrupt.
It was also found that the two types of sources exhibit differences other than the radio power. Type IIs are usually found in less dense environments, and strong emission lines can often be seen in their optical spectra (e.g., Zirbel & Baum, 1995; Zirbel, 1997; Kauffmann et al., 2008); type Is, on the other hand, are usually hosted by giant elliptical galaxies, and on average have weaker or no optical nuclear emission lines, which puts them on a different radio power–emission line luminosity correlation than that of FR IIs (Hine & Longair, 1979; Zirbel & Baum, 1995, see below). The cosmological evolution of the two types may also differ significantly (e.g., Willott et al. 2001; but see Gendre et al. 2010). Collectively, these differences are usually referred to as the FR I/II dichotomy, which has been the focus of numerous studies (e.g., Heckman et al., 1994; Baum et al., 1995; Hardcastle et al., 2007; Kauffmann et al., 2008; Baldi & Capetti, 2010, and references therein).
Larger samples and better observations have led to several proposals for refinement/alternatives of radio source classification schemes (e.g., Owen & Laing, 1989; Leahy, 1993; Laing, 1993). In particular, Owen & Laing (1989, hereafter OL89) categorized RGs into three types based on their radio morphologies: classical double (CD) sources are those with “compact outer hotspots and elongated, diffuse lobes extending from the hotspots back toward the nucleus”; fat double (FD) objects have “bright outer rims of radio emission and roundish diffuse radio lobes”; while twin jet (TJ) RGs “can be described by symmetric jets originating in the nucleus and extending on both sides” of the host. OL89 suggested that the hosts of FD and TJ sources have similar optical properties, and regarded both types, together with the Narrow-Angle Tail (NAT) objects, as FR I (see also Owen & White 1991). The CD objects were considered to be equivalent to FR II.
In addition to the radio morphologies, RGs have been classified based on their nuclear optical narrow emission line properties (e.g., Laing et al. 1994; Hardcastle et al. 2006). Objects with weak emission lines were generally referred to as low-excitation (LE) RGs, while their counterparts with strong lines were known as high-excitation (HE) RGs. Such a scheme is believed to better reflect any differences in the central supermassive black hole (SMBH), or/and the physical conditions of the accretion flow onto the central engine (e.g., Kauffmann et al., 2008). On the other hand, classification based on radio morphology is likely more intimately connected to interactions of the jets with the (large-scale) environments (e.g., De Young, 1993; Kawakatu et al., 2009). As such, the correspondence between HE/LE and FR II/I is not perfect; a large fraction of FR IIs have a LE nucleus (e.g., Laing et al., 1994), while some FR Is are HE RGs (see Heywood et al., 2007). This suggests that a hybrid classification system that incorporates both radio morphology and nuclear emission line activity may perform better in revealing distinct populations of RGs, which in turn would lead to a fuller understanding of the onset of radio activity, as well as the unification of radio-loud active galactic nuclei (AGNs; e.g., Barthel, 1989; Urry & Padovani, 1995; Falcke & Biermann, 1995; Hardcastle et al., 2006).
The samples used by many of the previous studies on the FR I/II dichotomy were limited by the available data at the time, and thus often have heterogeneous origins and did not have well-defined selection criteria (e.g., Owen, 1993; Zirbel & Baum, 1995). Furthermore, it is inevitable that classification of extended radio sources will be subject to the classifiers’ experience and preference. Both factors may make it difficult to uncover the origin of the dichotomy.
Our primary goal is to understand the origin of the different radio morphologies, which drives us to investigate ways to separate RGs into distinct populations, by exploring various classification schemes based on radio morphology or/and nuclear activity. In addition, we will use as a continuous parametrization of the radio morphology to study the transition from FR I to FR II, and to quantify any bimodality in the physical properties of the host galaxies on the radio power–optical luminosity plane. We will mainly use our own terminology to refer to the RG populations identified in this paper; unless specifically noted, we adopt the original definition of FR when we refer to the FR I/II types of extended RGs.
We have constructed a large RG sample with well-defined criteria (see §2), and paid particular attention to the measurements of total size () of a RG, as well as the separation () between the highest surface brightness spots (§3). From these quantities we define the ratio objectively and reproducibly, and present a classification system that is purely based on radio morphologies (§3). In §4 we examine the distribution of RGs on the radio power–optical luminosity plane as a function of , while in §5 we study dependences of various physical properties of host galaxies as a function of . Comparisons between radio loud (RL) and radio quiet (RQ)111We do not use an optical-to-radio luminosity ratio to distinguish between RL and RQ galaxies; by RL we refer to galaxies with 1.4 GHz power W/Hz, while by RQ we mean galaxies not detected by the NVSS survey (i.e., 20cm flux density mJy; see §2). galaxies are made in §5.4. Discussion of the FR dichotomy, a proposal for an improved classification scheme based on both and nuclear emission line strengths, comparison of our scheme with those of FR and OL89, and the possible origin of the morphological differences, are presented in §6. We summarize our main results in §7. Possible systematics due to the limitations of the radio data we use, and the uncertainties in the measurement of , are discussed in the Appendices.
Most of the radio sources in the local Universe are compact or barely resolved at resolution (see §2); this paper concentrates on extended radio sources, and we will study the physical properties of the host galaxies of compact sources in a future publication.
Throughout this paper we adopt a flat CDM cosmological model where and with . As our sources are at , the small differences between the adopted cosmology and the current best concordance model (e.g., Komatsu et al., 2010) have a negligible effect on our results.
2. The Parent Radio Galaxy Sample
We construct the RG sample by cross-matching the Sloan Digital Sky Survey (SDSS; York et al. 2000) main galaxy spectroscopic sample (Strauss et al., 2002) with the NRAO VLA Sky Survey (NVSS; Condon et al. 1998) and FIRST (Faint Images of the Radio Sky at Twenty-Centimeters; Becker et al. 1995) surveys. We start with the DR6 (Adelman-McCarthy et al., 2008) version of the NYU Value-Added Galaxy Catalog222http://sdss.physics.nyu.edu/vagc/ (VAGC; Blanton et al., 2005), selecting from the large-scale structure bbright0 subsample333This subsample is defined by a constant, extinction-corrected Petrosian (1976) magnitude limit of , together with no fiber collision corrections. 229,379 galaxies with and (i.e., more luminous than the characteristic magnitude in the galaxy luminosity function, Blanton et al. 2003. or denotes the SDSS -band shifted blueward by a factor of 1.1 in wavelength. Similarly, and refer to the shifted and bands, respectively). Selecting RGs with a uniform absolute magnitude limit makes it easy to compute the fraction of RL objects in volume-limited galaxy samples. Since the parent VAGC galaxy sample excludes quasars, our sample does not contain radio quasars. Our survey area covers 6008 deg2.
As the first step, automatic matching to the radio source catalogs is carried out following the prescription of Best et al. (2005a). In short, if a galaxy has only one NVSS source projected within , the pair would be matched depending on their angular separation as well as the properties of the FIRST source(s) (if present) in the vicinity of the galaxy. If there are at least two NVSS sources within of a galaxy, the matching depends on the spatial distribution and the fluxes of the NVSS and FIRST sources. We then visually inspect all galaxies with at least one NVSS source within (irrespective of the results of auto-matching), correcting for any mis-match, keeping only RGs with total flux density mJy at 1.4 GHz, and recording their morphological and structural information wherever possible (see §3). The radio flux from the NVSS catalog is in general adopted, as fluxes from extended sources may be resolved out by the FIRST survey. For complicated sources that are blended/unresolved in the NVSS images, we make use of both NVSS and FIRST data to assign proper fluxes to individual RGs. More details on the construction of the RG sample will be presented in a future publication where we study the large scale clustering properties of RGs.
Our RG catalog contains about 10,500 objects. Of these, 1,040 have extended morphology with roughly aligned lobes/jets; this is the RG sample we study in this paper. The details of the selection and morphology measurement are described in §3. Our sample is constructed to be complete in radio flux and optical luminosity, and is not selected against any particular (radio and optical) morphology, which makes it well-suited for investigating the FR I/II dichotomy. The minimum, mean, and maximum redshift of our sample are 0.027, 0.165, and 0.299, respectively. At the resolution of FIRST survey () corresponds to a physical scale of 22 kpc.
Finally, we cross-match all the galaxies in the NYU-VAGC with the DR7 of MPA/JHU-VAGC444http://www.mpa-garching.mpg.de/SDSS/DR7/, which provides continuum-subtracted measurements of emission line strengths (Kauffmann et al., 2003a), star-formation rates (Brinchmann et al., 2004), and stellar mass (Salim et al., 2007), among other physical properties. These auxiliary measurements are used in §5 when we compare these properties among RGs and between RL and RQ galaxies.
3. Quantification of Radio Source Morphology
One of our main goals is to study various properties of RGs and determine if their distribution is bimodal or is continuous. Our first task is therefore to define an objective measure (or measures) that allows us to trace the galaxy population smoothly from FR type I-like sources to type II-like ones (as opposed to a sharp and perhaps arbitrary type I vs type II division). With the aid of such a measure, we hope to reduce the subjectiveness inherited in the traditional ways of classification, thus increasing the repeatability of our results by other researchers.
Let us denote the angular separation between the highest surface brightness (HSB) spots on either sides of the galaxy as , and the total linear size of the radio source as . We follow FR and define as our primary measure of the morphology of the radio sources. We primarily use data from FIRST to measure both and , except for very large, diffuse sources which become invisible at FIRST resolution. The reasons for these choices, and the details of the measurements, are described below.
The quantity depends on the angular resolution of radio maps. It is possible that a single high surface brightness (SB) spot at low resolution can resolve into several spots at higher resolution, and the identification of the HSB spots can thus change. Fifteen of our RGs have been observed by a deep 1.4 GHz VLA survey in the SDSS Stripe 82 region (PI: G. Richards; see Hodge et al. 2010, in preparation), at 3 times higher angular resolution (FWHM ) and twice the sensitivity (rms mJy/beam) than FIRST (FHWM , rms mJy/beam). We find that the high SB spots seen in the deeper maps are also identified by FIRST; on average measured from FIRST and from the deeper survey differ by less than 6%. We thus conclude that the resolution of FIRST is adequate to identify the highest SB spots for our sample, and our results should be applicable to surveys at arcsec resolution for nearby RGs. More details of this comparison are provided in Appendix A.
In addition to the angular resolution, the total size also depends on the surface brightness limit of the survey. Although NVSS is shallower than FIRST, it is more sensitive to emission from extended sources with low spatial frequency, which will be absent in the FIRST maps (Condon et al., 1998). For most of the sources we measure using data from FIRST; for 41 very extended, diffuse sources (representing 3% of all the sources for which we have size measurement), we use NVSS instead. We discuss in Appendix B the effect of using only NVSS data to measure on our results.
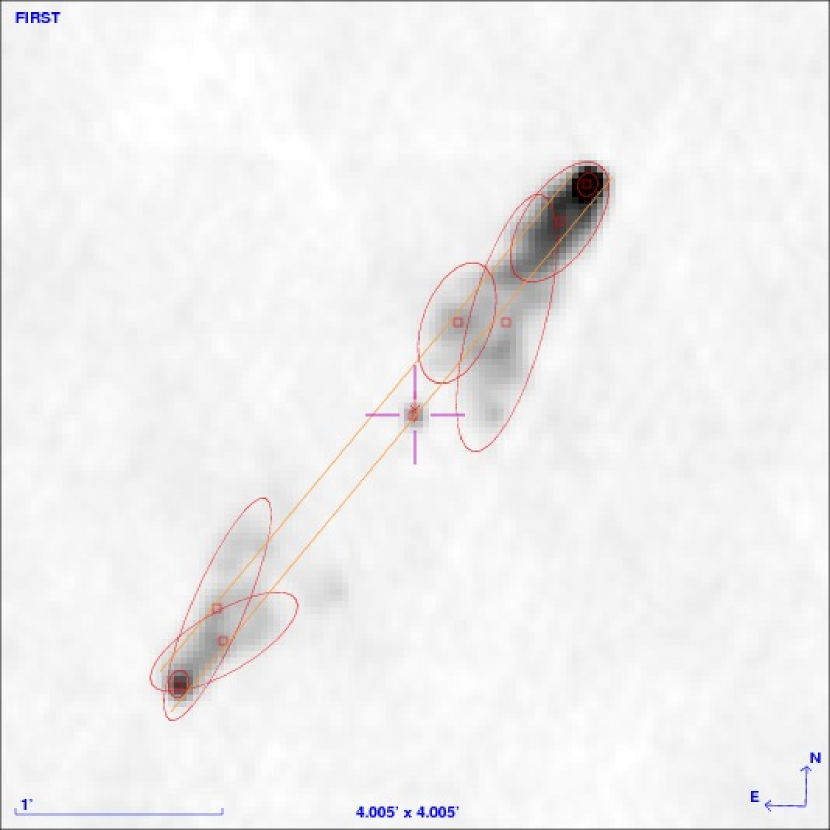
For the identification of the HSB spots and the measurement of and , we rely on the elliptical Gaussian fits to the sources provided by both FIRST and NVSS (when needed) surveys, rather than using the atlas images, for these fitted parameters (deconvolved size of major and minor axes, and the position angle) fully account for the synthesized beam properties and are of high fidelity to the actual intensity distribution in the maps (Condon et al., 1998; Becker et al., 1995). In practice we overlay the FIRST images with ellipses based on the best fit parameters to guide our measurements (see Figures 1 and 2 for details). For each source (i.e., individual components of an RG), the ellipse encloses 95% of the flux, and its semi-major/semi-minor axes are equal to the values of the elliptical Gaussian model.
For galaxies associated with only one radio source (at FIRST resolution), or components of a multi-source RG, we use the fitted parameters from FIRST to determine whether a source is extended. A point source needs to satisfy the following conditions: (1) the integrated flux-to-peak flux ratio and (2) the deconvolved major axis (e.g., Becker et al. 1995; Kimball & Ivezić 2008).
For every extended RG (containing in most cases at least two FIRST sources555In this paper we only consider RGs associated with at least two FIRST sources.) whose lobes/jets are aligned to within (i.e., not strongly bent as in wide/narrow angle tail objects), we measure and as follows:
-
•
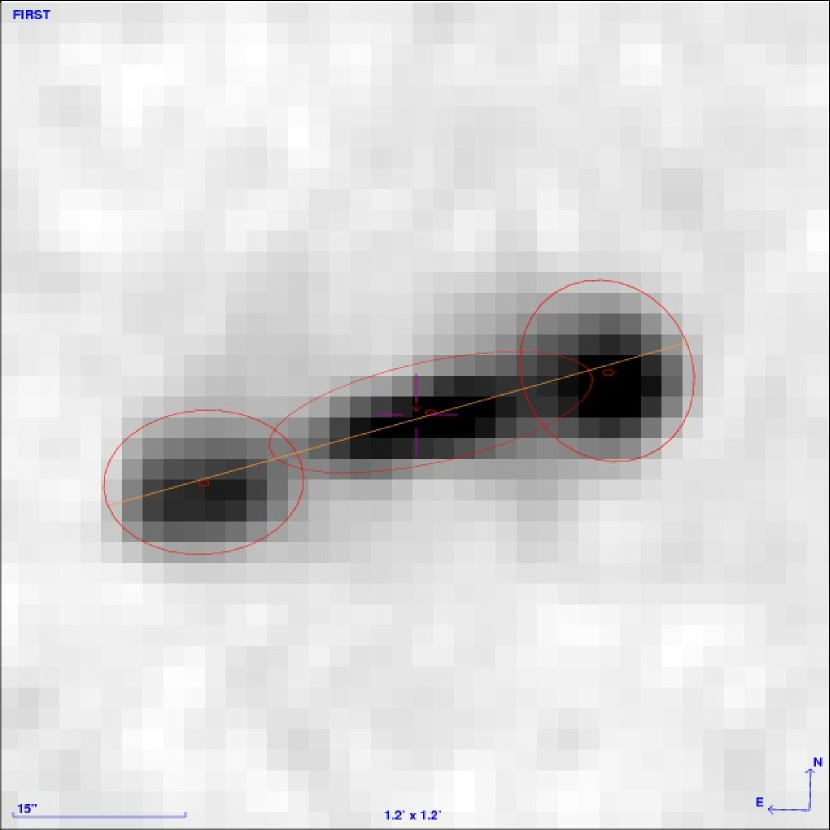
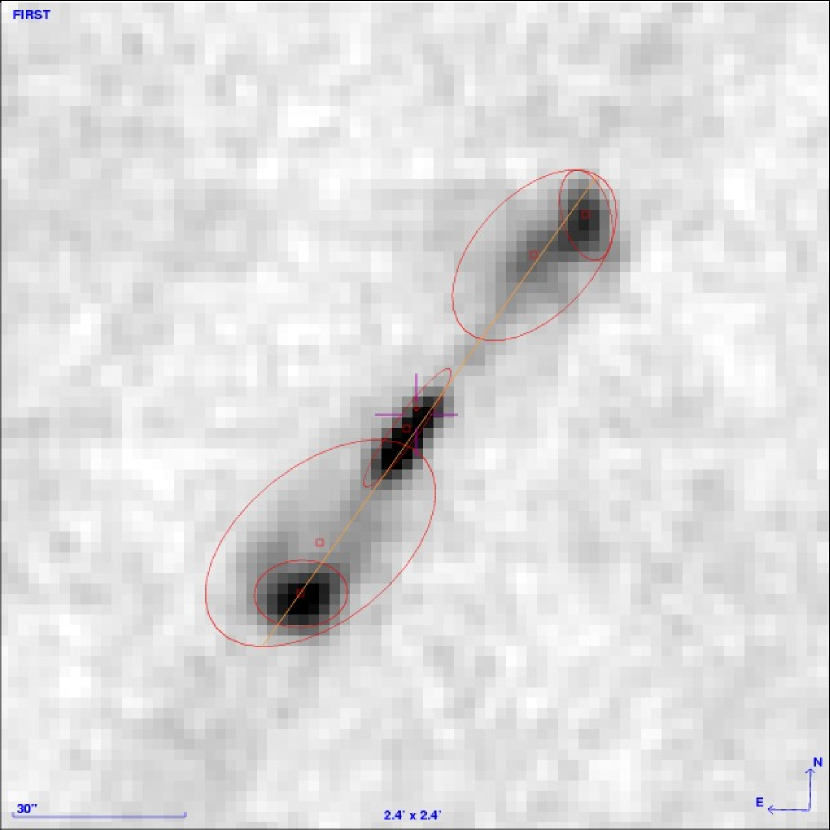
: (i) In most of the cases there are two or more FIRST sources associated with an RG; we use the length of the line that passes through the FIRST source locations and intersects with the outermost FIRST source ellipses as (Fig. 1). (ii) In the cases where we need to use NVSS for the total size measurement, we use the length of the line that passes through the NVSS/FIRST source locations and intersects with the NVSS source ellipses. If the size of the major axis for a NVSS source in either of the above cases is given as a upper limit, we remove the RG from our sample.
-
•
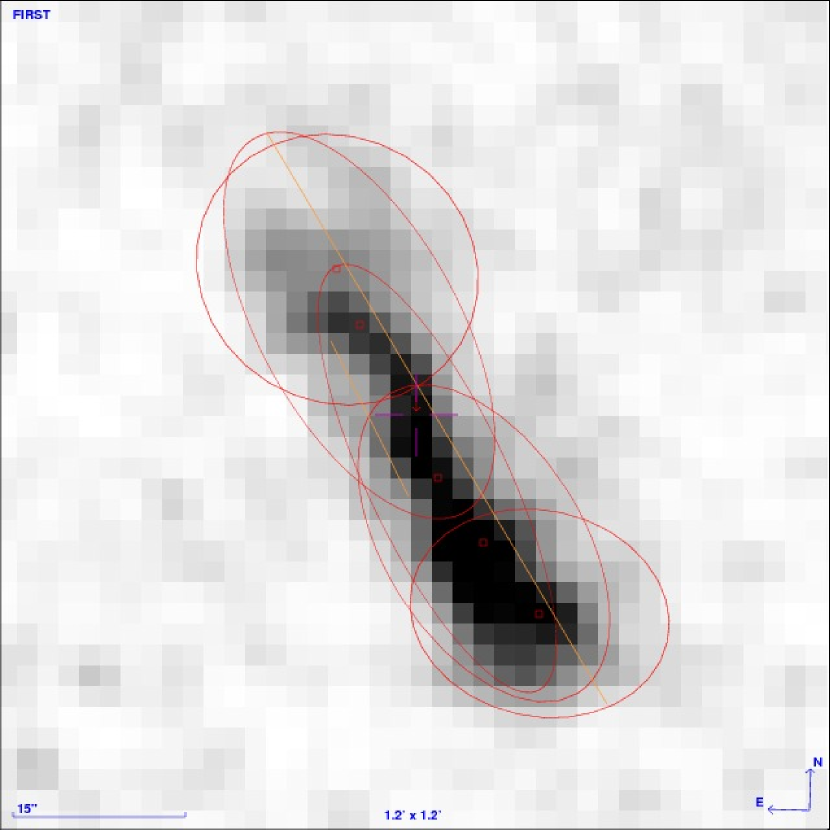
: we use the peak flux of the FIRST sources to determine the position of the HSB spots; the separation between such spots on the two sides of the RG is (e.g., Fig. 1). In some cases where one of the lobes is not well detected and modeled by FIRST, we use the FIRST images directly. For about of the sources the HSB spot coincides with the center of the galaxy (Fig. 2), which is likely due to (unresolved) jets; if the spot is extended and accounts for at least 10% of the total flux, we use the size of the spot as a measure of . Otherwise we use the separation between the other high SB spots on the two sides of the galaxy as .
From visual inspection, 1,244 RGs appear to be extended (with apparent lobes and/or jets). We have measured and by hand for these objects using the Aladin sky atlas tool (Bonnarel et al., 2000). Based on repeated measurements for about fifty sources, we find our procedure is highly repeatable and the resulting sizes usually agree to within , except for very complex sources. To reduce resolution dependence on our classification scheme, and to remove compact sources (e.g., O’Dea 1998), we further select a subset of 1,040 sources that have angular size and physical size kpc for the analysis presented below. Again, our RGs also satisfy , , and mJy.
| class | HSB$\dagger$$\dagger$“highest surface brightness” spot(s) | central source | number | fraction (%) | |
|---|---|---|---|---|---|
| opposite sides of RG | not HSB | distance between two HSB spots | 667 | 64.1 | |
| center | extended, | size of the HSB spot | 289 | 27.8 | |
| center | extended, | distance between secondary HSB spots | 38 | 3.6 | |
| center | compact, | distance between secondary HSB spots | 9 | 0.9 | |
| center | compact, | distance between secondary HSB spots | 37 | 3.6 |
Motivated by the above considerations, and based on the ratio , flux, and location of the HSB spot(s) (extended or point-like; coincident with the host galaxy or not), we group the RGs into five classes: (a) There are two HSB spots on opposite sides of the RG; (b) There is a single extended HSB spot coincident with the galaxy, with flux , where is the total flux from all the components of the RG; (c) The HSB spot coincides with the galaxy, is extended, and its flux is ; (d) The HSB spot coincides with the galaxy, is unresolved, and its flux is ; (e) The HSB spot coincides with the galaxy, is unresolved, and its flux is . For class b, is the size of the HSB spot; for all other classes, is the separation between the other high SB spots on both sides of the galaxy.
This classification scheme is devised primarily for the ease of measuring . We do not mean to suggest there are five distinct types of RGs. In Table 1 we summarize this scheme, and list the number of sources in each of the classes. The first two classes ( and ) account for the majority () of the extended RGs. We will focus exclusively on these two classes in what follows, and will examine if such an artificial classification corresponds to any physically different RG types, that is, if there is any fundamental difference between classes and (§§5, 6).
Does have any physical meaning? A HSB spot represents a region where the jet is highly dissipative, and thus can be thought of as an indicator of the degree of interaction between the jet and the environment, which depends on the strength and nature of the jet as well as the density of the surrounding medium, among other factors. For class sources with (e.g., Fig. 1, left), the jets can reach the edge of the lobes without much impediment, suggesting either a strong jet or tenuous ambient density, or a combination of both (e.g., Kawakatu et al. 2009). The opposite situation would cause a low (Fig. 1, right), or a class object (Fig. 2).
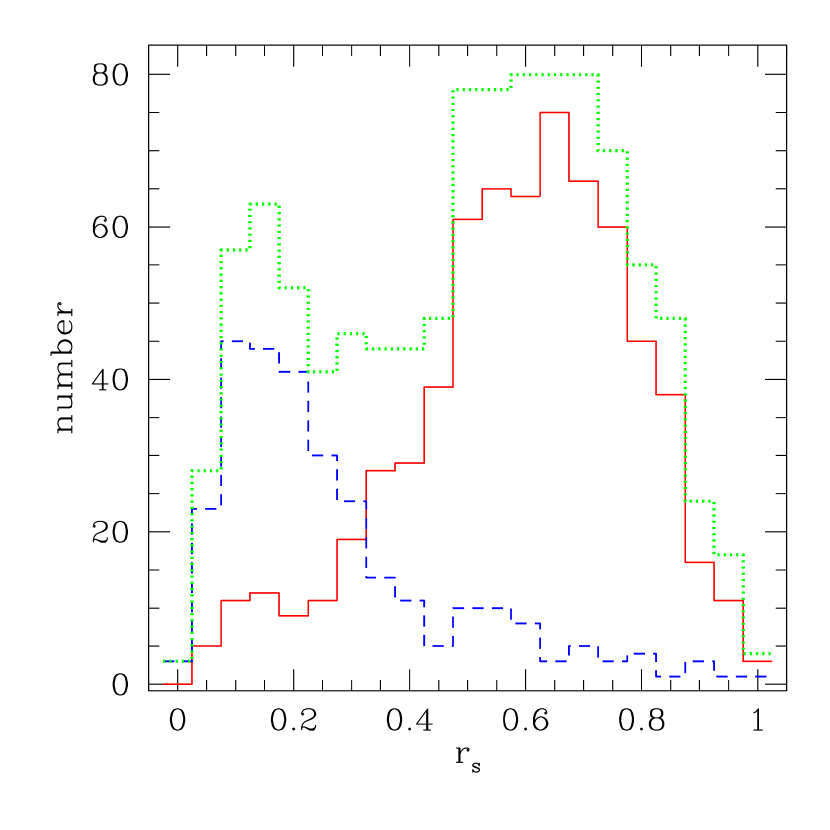
In Fig. 3 we show the distribution of for all 1,040 RGs (green/dotted histogram), and for the classes a (red/solid histogram) and b (blue/dashed histogram) separately. Considered together (green/dotted histogram), the distribution of RGs seems to be bimodal, with peaks at 0.15 and 0.60, and the division roughly at .
In the original FR scheme, the division was set to , although it is not clear if FR’s data showed any bimodality in the distribution of . FR used 1.4 GHz maps with beam size of for their morphology classification. The difference in the division may be due to the resolution of the radio images (see Appendix B), and/or to the sample used (the 3CR catalog that they used was limited to very high radio flux threshold and consisted of sources at much higher redshifts than our RGs). Nevertheless, one might be tempted to make a correspondence between the two distributions in Fig. 3 with the two FR types.
Others have built upon the FR scheme and used more sophisticated criteria to classify the RGs, such as the presence of jets or “hot spots” toward the edge of the lobes (e.g., OL89; Leahy 1993; Gendre & Wall 2008). In the analyses presented below, we will seek the best way to distinguish various populations of RGs; in doing so we will find ourselves defining several subsets of class (, , , and ; see Table 2). We will show that, if one sticks with a simple FR-like classification scheme, a division at (between what we call the and subsets) best separates objects of different physical properties (for radio data at FIRST-resolution; §5). A scheme that works even better is based both on features of the radio morphology () and the nuclear optical emission properties; we will refer to these as the ( and ) and (the rest of class ) subsets. We will argue in §6.1 that the , , and classes represent three populations of extended RGs, which roughly correspond to the CD, FD, and TJ types of OL89, respectively. The correspondence between these and the FR types will be discussed in §6.1.
4. Bimodality in the Radio–Optical Luminosity Plane?
We start by analyzing the distribution of RGs in the radio power–optical magnitude plane (– plane for short). Owen and collaborators suggested that the transition from one FR type to the other is quite abrupt on this plane (§1; OL89; Owen & White 1991; Owen 1993; Ledlow & Owen 1996). If this were true, and if their FR classification was solely based on morphological measures such as , we would expect RGs of different values of to occupy distinct regions in the plane.
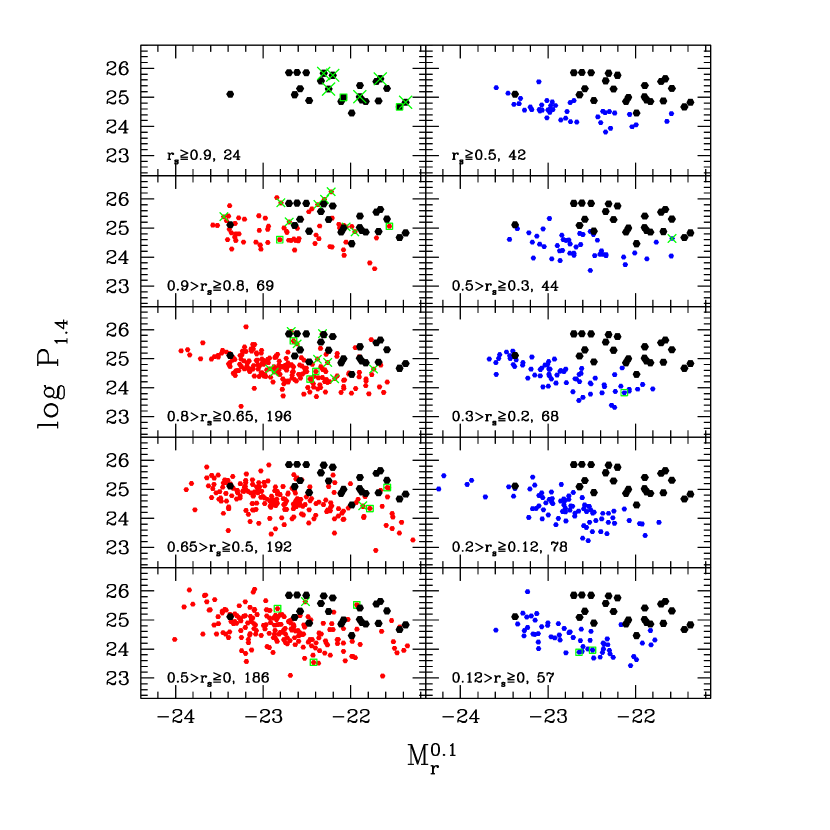
In Fig. 4 we show the distribution of objects in classes (left panels) and (right panels). We have assumed a typical radio spectral index of (with the convention that ) to convert fluxes to power. From top to bottom, we show the distribution for RGs in bins of decreasing . Let us first focus on the class . The black points (upper left panel) are RGs with , and are shown in all other panels for comparison. As we will see below, many of these high objects are distinct from the rest of the population in their host properties and environment. There is a gradual shift of the locus of the RGs towards lower radio power, as decreases. Even so, the region occupied by these high- RGs is still populated by some RGs with (much) lower value of (e.g., ). Thus no particular region on this plane is inhabited solely by a type of object defined by some specific range of .
For class (right panels), the trend of decreasing mean radio power with decreasing is very weak, but they tend to be lower luminosity than the class objects.
These results appear to be in contradiction with those obtained by Owen and co-workers. If we were to assign an value that serves as the FR I/II divide (say ), we would not obtain any clean-cut separation for the RGs. Additional classification criteria, such as special features in the radio source morphology (e.g., hot spots at the edge of the lobes), or/and optical properties of the nuclei, may be required to define two (or maybe more) distinct populations in the – plane (see §6.3).
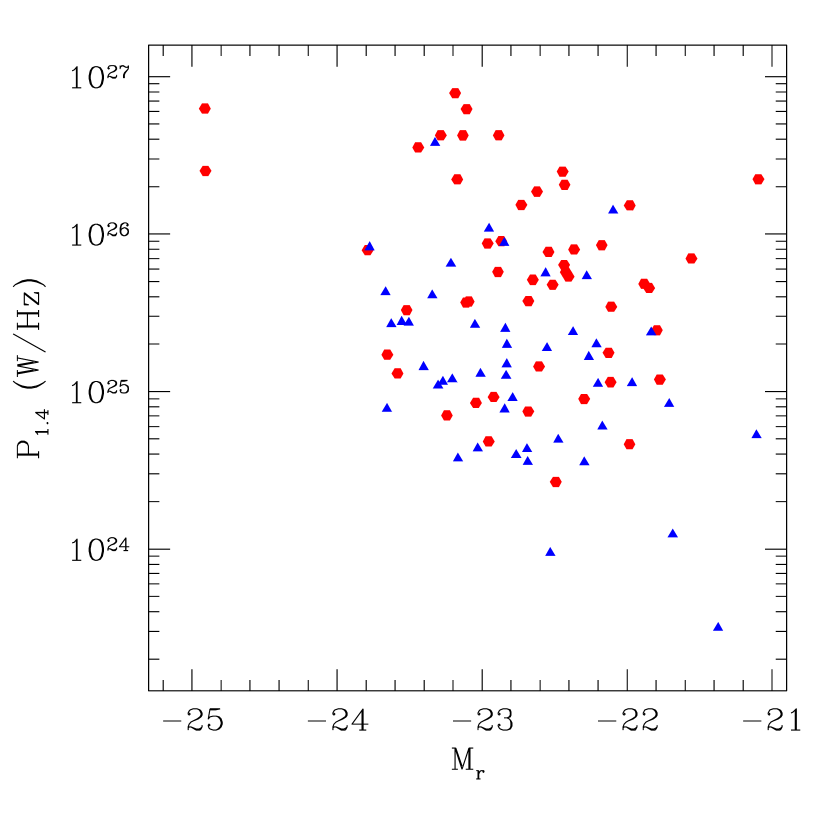
As an independent check, we show in Fig. 5 the distribution of FR I (blue/triangle) and II (red/circle) RGs in the – plane, using about 100 RGs at from the CONFIG sample (Gendre et al., 2010). This is a radio flux-limited sample that was constructed by combining data from both NVSS and FIRST. The morphological classification was carried out by these authors and was based on FIRST and deeper VLA A-array observations. We cross-match the RGs from this sample with the NYU-VAGC DR7 sample to obtain the absolute -band magnitude. Although FR IIs are on average more powerful than FR Is, substantial overlap between the two types is readily seen. This overlap still persists using a volume-limited subsample that consists of 34 FR Is and 28 FR IIs (selected with and ). In addition, Best (2009) and Wing & Blanton (2010) also noted a substantial overlap between the two FR types in the – plane. These results support our notion that in a flux-limited sample, there is not a sharp division among RGs in the – plane when the classification is made solely based on . Possible causes of the discrepancy between our results and those of Owen et al. are discussed in §6.3.
5. Host Galaxy Properties of Extended Radio Sources
We now examine the distribution of various physical properties of the galaxies as a function of for classes and . These include the global properties of the host galaxy, derived quantities of the stellar populations, emission line properties, and properties related to the radio source and environments.
In this section we focus on the observational results, and leave the interpretation to §6. We discuss the properties of classes (§5.1) and (§5.2) separately. We investigate the environments of the RGs in §5.3. A comparison with RQ galaxies whose global properties are matched to the RGs is made in §5.4.
5.1. Class
Throughout this paper we are concerned mainly with the mean behavior of samples, and thus in this section we will examine the medians of various quantities, and their trend with .
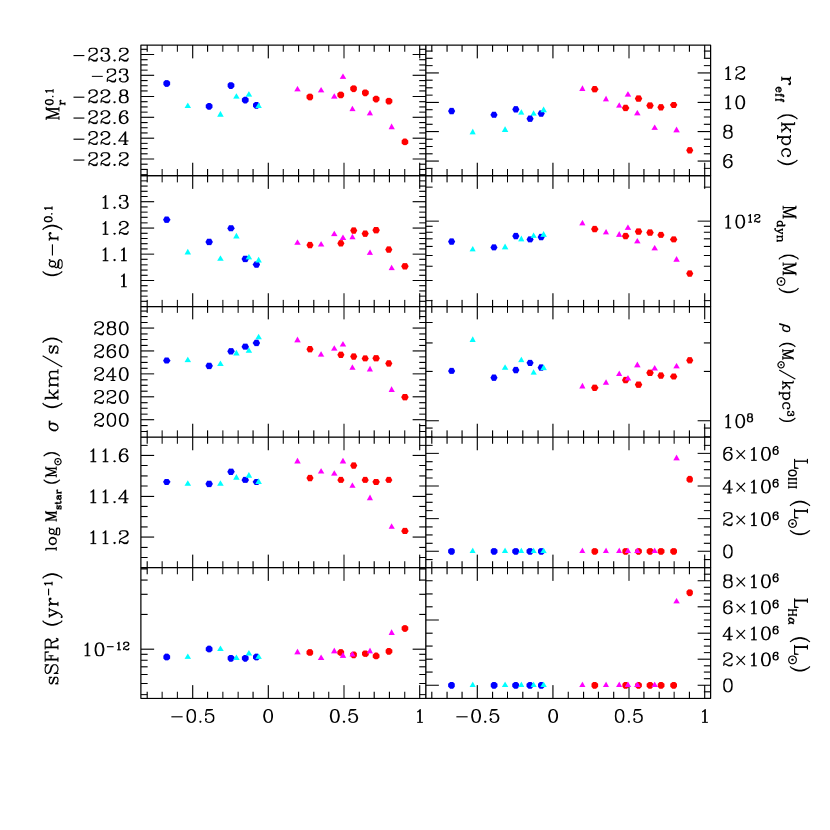
In Fig. 6 we show the median value and its uncertainty666The uncertainty of the median is taken as , where is the standard deviation, and is the number of RGs (e.g., Lupton 1993). for some global properties of the host galaxies as a function of , for classes (red) and (blue). The small data points represent individual RGs, also color coded according to their classes. The left panels, from top to bottom, show the absolute -band magnitude , rest frame color , stellar velocity dispersion , Sersic index , and concentration . The panels on the right show the effective radius , dynamical mass , total mass density , axis ratio for the de Vaucouleurs profile fit to the SB profile, and redshift. Here is the ratio of the radii that enclose 90% and 50% of the Petrosian fluxes, is a crude estimate of the total mass, and represents the (central) mass density. We follow Graham et al. (2005) to estimate from , , and . The -band measurements are used for all these photometric quantities. Using the SMBH – relation (e.g., from Tremaine et al. 2002), we can estimate the SMBH mass ; for our sample the range of is , with a median of .
We have also examined another measure of the galactic structure, the stellar mass surface density, , where is the stellar mass (described below), and found that the trend with is similar to that of .
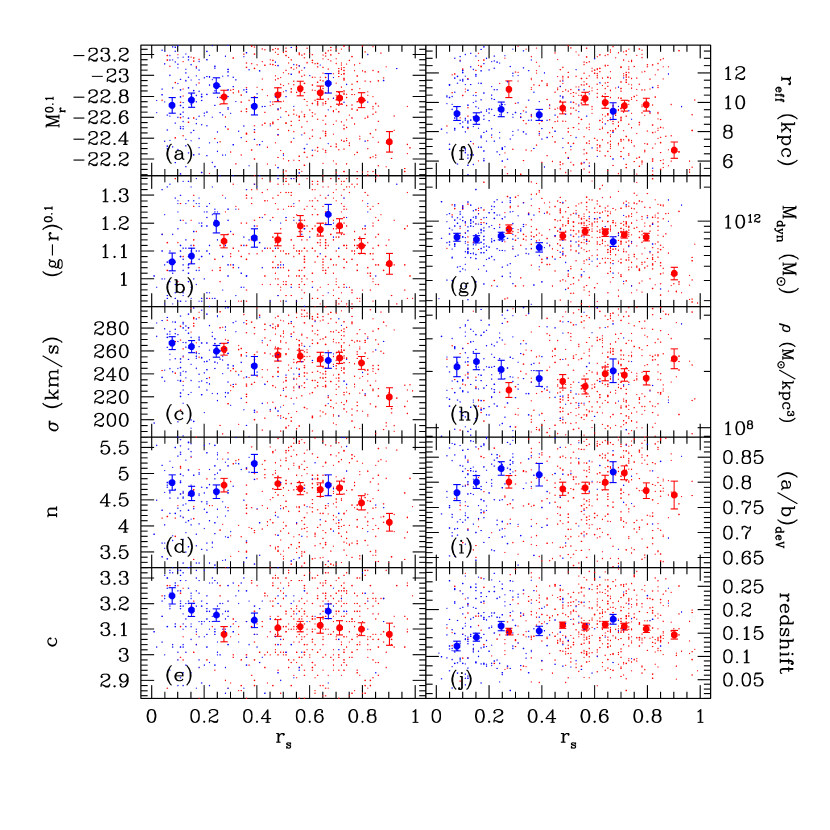
We focus on class in this section. The color, Sersic index, and concentration, and the SB profile (not shown) of the RGs are consistent with those of radio-quiet early type galaxies. The numbers of RGs in the seven bins are (from lowest to highest): 118, 106, 102, 105, 101, 90, and 49. The median redshift is almost constant for different bins (panel j). Trends or changes with are in most cases gradual and mild, with the exception of the highest- bin. Although the distributions of the properties are quite broad (c.f. the small points in Fig. 6), one can identify two populations, roughly separated at : sources with higher (hereafter the subset) are less luminous and massive (and thus likely harboring smaller SMBH), are smaller, and have slightly higher density. For the rest (hereafter the subset), trends with are either weak (e.g., , , ) or absent. However, it is important to bear in mind that there is significant overlap in physical properties of RGs grouped by the value. Some of the objects are as massive (, ) and large () as the ones (see §6.1), and, conversely, some of the latter population share the characteristic properties of the former.
| class | class | ||||||
|---|---|---|---|---|---|---|---|
| range | N$\ddagger$$\ddagger$Number of all RGs with good velocity dispersion and spectral line measurements. | Seyfert$\dagger$$\dagger$The numbers in parentheses are for radio-quiet (RQ) galaxies whose properties are matched to the radio-loud (RL) galaxies in the bin. See §5.4 for more details in the matching between RL and RQ galaxies. | LINER$\dagger$$\dagger$The numbers in parentheses are for radio-quiet (RQ) galaxies whose properties are matched to the radio-loud (RL) galaxies in the bin. See §5.4 for more details in the matching between RL and RQ galaxies. | range | N$\ddagger$$\ddagger$Number of all RGs with good velocity dispersion and spectral line measurements. | Seyfert$\dagger$$\dagger$The numbers in parentheses are for radio-quiet (RQ) galaxies whose properties are matched to the radio-loud (RL) galaxies in the bin. See §5.4 for more details in the matching between RL and RQ galaxies. | LINER$\dagger$$\dagger$The numbers in parentheses are for radio-quiet (RQ) galaxies whose properties are matched to the radio-loud (RL) galaxies in the bin. See §5.4 for more details in the matching between RL and RQ galaxies. |
| 46 | 0.196(0.015) | 0.043(0.049) | 37 | 0(0.005) | 0(0.012) | ||
| 85 | 0.082(0.004) | 0.024(0.021) | 41 | 0.024(0.005) | 0(0.021) | ||
| 91 | 0.033(0.002) | 0.022(0.028) | 58 | 0(0.002) | 0.017(0.046) | ||
| 95 | 0.053(0.008) | 0.011(0.019) | 67 | 0(0.003) | 0(0.030) | ||
| 88 | 0(0.001) | 0.011(0.017) | 53 | 0(0.008) | 0.008(0.040) | ||
| 93 | 0(0.003) | 0.022(0.019) | |||||
| 94 | 0.011(0.004) | 0.021(0.030) | |||||
Four derived properties of the stellar populations (left panels), as well as emission line measurements (right panels), are shown in Fig. 7. All these quantities are taken from the MPA/JHU-VAGC. The stellar mass is derived from broadband photometry (see Salim et al. 2007 for details). The specific star formation rate (sSFR) is derived using the method presented in Brinchmann et al. (2004). The H and indices are measures of the stellar age and star formation history (e.g., Kauffmann et al., 2003b). As in Fig. 6, the and subsets show quite different behavior. While the RGs have roughly the same median stellar masses, sSFR, and stellar ages, and do not have strong emission lines, the majority of objects are quite active, but less massive, and have higher sSFR and younger stellar age. For example, Kauffmann et al. (2003a) suggested the use of [O III] luminosity as an indicator of AGN activity; 26% of the RGs can be regarded as strong AGNs (e.g., ). We do not apply any dust-extinction correction to the line luminosities, as (1) dust content is expected to be low in the early type galaxies of our sample, and (2) any such correction (e.g., that based on the Balmer line ratios) is itself uncertain.
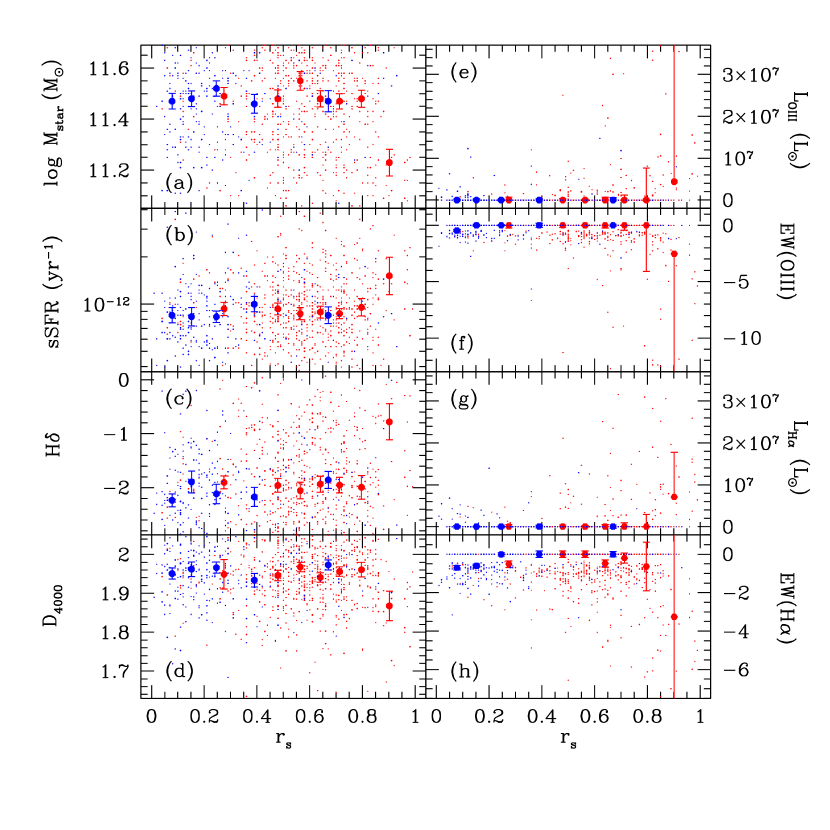
In each panel of Fig. 4 we show as crosses the RGs whose spectra show signatures of Seyfert-type activity, and as squares those with LINER-like spectra. We follow Kauffmann et al. (2003a) to classify the spectra according to the [O III]/H and [N II]/H line ratios on the BPT diagram (Baldwin et al., 1981; Veilleux & Osterbrock, 1987). The class sources with higher values of contain larger fractions of active nuclei. For example, of the sources have a Seyfert-like spectrum777Although there are 24 RGs with (Fig. 4), only 21 have spectra of good enough quality for line measurements., and can be classified as LINERs. In Table 3 we record the fraction of RGs with Seyfert- and LINER-like nuclei as a function of . Note that the binning in the Table is the same as that in Figures 6–8, chosen such that each bin contains roughly equal number of RGs (except for the highest values), and is thus different from that shown in Fig. 4. While the fraction of class RGs with LINER-like spectra is roughly the same for all bins (at about few percent), the fraction of Seyfert-like spectrum is a strong function of . About 20% of the objects in the subset have strong emission lines that are characteristic of active nuclei.
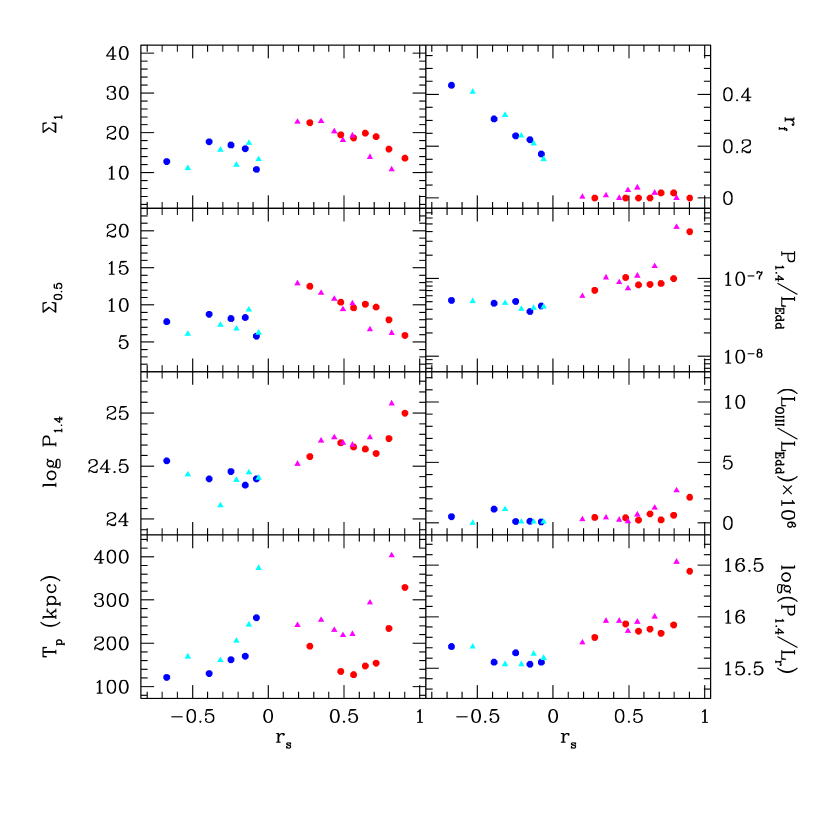
As an indicator of the accretion rate onto the SMBH, we show in Fig. 8 (panel g) the [O III] line Eddington ratio, which is the [O III] luminosity divided by the Eddington luminosity (which is estimated using the – relation). The median accretion rate is quite close to zero for most of the bins, but is higher for the systems. In panel (f), we show the analogous radio Eddington ratio () at 1.4 GHz, which exhibits the same trend as . Note that we do not integrate over the radio spectrum (e.g., from 0.1 to 10 GHz) to obtain the total radio power; but as we are mainly interested in the trend with , this should not be a problem under the assumption that the spectral shape is not a function of . Assuming a mean spectral index of for all RGs and integrating over the frequency range GHz, we would need to scale the 1.4 GHz Eddington ratio by a factor of 74 to obtain the radio Eddington ratio.
The other panels in Fig. 8 are related to the environments and other radio properties of the RGs. As a simple, statistical measure of the number of neighbors, for each RG we count the number of luminous galaxies () within 1 Mpc and 0.5 Mpc in the SDSS photometric catalog, assuming they are at the redshift of the RG, and subtract the expected number of galaxies (from the global galaxy counts) in the same apparent magnitude range. These neighbor counts are denoted as and , respectively, and are shown in panels (a) and (b). These two scales are chosen to reflect the scales of the host group/cluster and of any possible local structure within the group/cluster. On average, class RGs live in dense environments (i.e., in excess with respect to the global background). The median number of neighbors decreases with increasing .
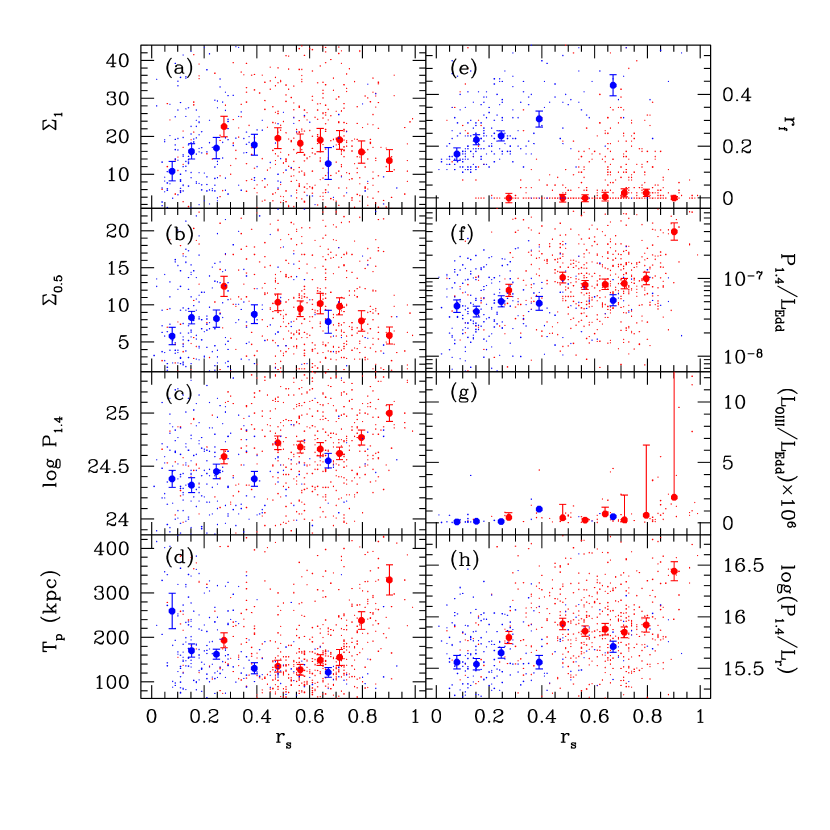
Panel (c) shows the mean 1.4 GHz radio power as a function of . Here objects in the subset have the highest luminosity, while RGs have very similar median radio power. Panel (d) shows the distribution of physical sizes of the RGs. Not surprisingly, the RGs with highest are also largest (median size exceeding 300 kpc), since it is mainly the lobes that contribute to the low-frequency radio fluxes.
Panel (e) is another measure of the radio source morphology: the central-to-total flux ratio . We estimate the central flux by summing fluxes from all components within from the center. For class , the ratio is on average small (). Note that this must be partially a selection effect, for if a strong source is present at the center, it will likely be the HSB spot and the RG would be put in other classes ().
Finally, panel (h) shows the logarithm of the radio-to-optical luminosity ratio (calculated simply as ), which is also almost constant at , and rises sharply at highest bin; this enhancement for is due to the combined effect of it having the lowest median optical luminosity and highest median radio power among the class objects.
All the results from Figures 6–8 indicate that there appear to be two populations of RGs among class : galaxies in the subset have lowest stellar mass, but have the highest star formation rate, AGN activity, and radio power, and live in relatively poorer environments, while the RGs, especially those with , share very similar properties, such as the luminosity, size, dynamical mass, density, indicators of recent star formation history (e.g., and H indices), and neighbor counts within 0.5 and 1 Mpc. We should emphasize that the division in of the two populations is not sharp; we choose to distinguish the two subsets at mainly for simplicity.
Can we identify these two populations with the two FR types? The general properties of these two populations do conform roughly to the characteristics of the two FR types found in the literature (§1). Before making a direct correspondence (see §6.1), however, it is important to investigate where the class objects fit in the context of the FR I/II dichotomy.
5.2. Class
The binning in Figures 6–8 for the class (blue points) is the same as that shown in Fig. 4 (right panels); the numbers of RGs in the five bins are (from lowest to highest): 57, 78, 68, 44, and 42. The median redshift slightly increases with (Fig. 6, panel j; see Appendix A).
Broadly speaking, the class RGs are typical early type galaxies in their optical properties (based on e.g., the color, concentration, and Sersic index). One gets an impression from Figures 6–8 that there is not much variation with for galaxies in class . For example, , , , , and 1.4 GHz Eddington ratio all have median values that do not vary much with . The most notable systematic variations are that color becomes redder as increases, a positive correlation between and , and a negative correlation between the total size of the radio source and .
There is considerable overlap in the distributions of various physical properties between the and class RGs. However, the class objects have slightly higher median , , , , smaller , lower emission line strength, neighbor counts, radio power and Eddington ratio, and radio-to-optical luminosity ratio. That is, they are more compact and are more quiescent in terms of their nuclear and radio activity. Of the 597 class objects for which classification of spectral properties using the BPT diagram is possible, 37 () are Seyferts or LINERs. For class , the fraction is only .
In Table 4 we list the basic properties of the RGs in our sample.
5.3. Environments of Extended Radio Galaxies
From Fig. 8 we see that the subset has the highest neighbor counts (median ), while those of class and are close ( and , respectively). For reference, for the most luminous galaxies ( to , irrespective of radio properties), .
To better understand the environments of these RGs, we further examine their association with galaxy clusters, and calculate their clustering properties. First, we cross-match our RG sample with the clusters found by the maxBCG algorithm (Koester et al., 2007). 704 () of our class and RGs lie in the footprint and the redshift range () of the maxBCG survey. We focus on clusters more massive than , above which the cluster catalog is about complete. The cluster mass and the virial radius are estimated using the weak lensing-calibrated mass–observable scaling relation from Reyes et al. (2008). Only 13%, 24%, and 14% of the RGs in the , , and subsets are associated (i.e., within one virial radius) with these optically-selected clusters888The class and RGs only account for of our full RG sample. The narrow-angle tail objects, whose morphology is believed to be due to the relative motion of the galaxies and the intracluster medium, together with the compact sources (which account for the majority of the sources), are excluded in the current sample. The fraction of all RGs that are cluster members is therefore higher than we have estimated here.. However, of those RGs that are in clusters lie within 20% of the virial radius from the cluster center, consistent with previous findings that RGs are centrally concentrated in clusters (e.g., Ledlow & Owen, 1995; Lin & Mohr, 2007).
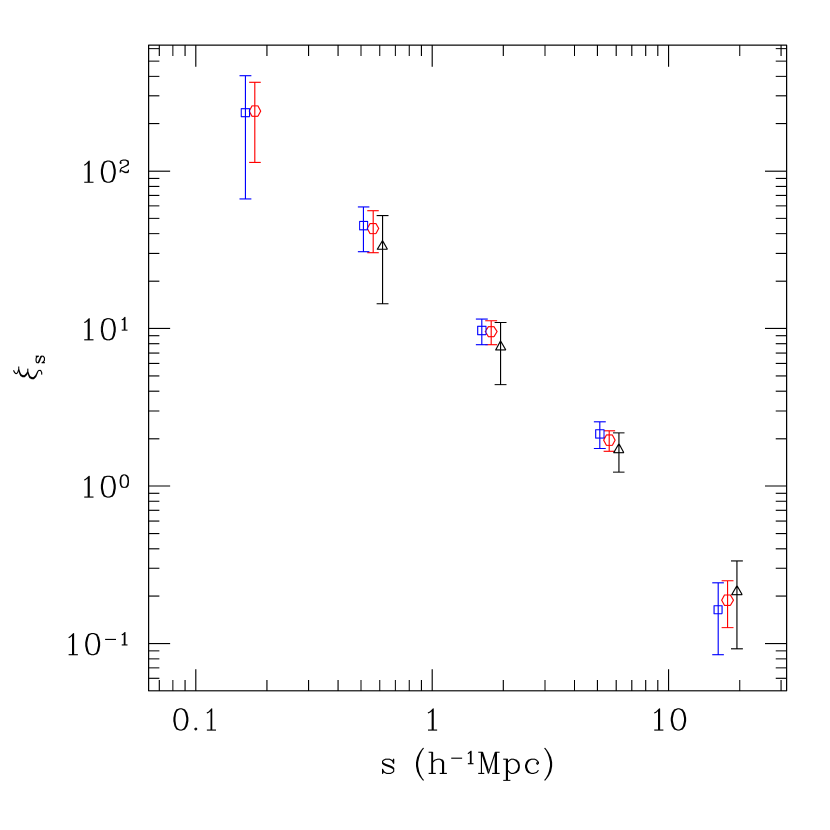
The RGs are mainly hosted in dark matter halos more massive than (Mandelbaum et al., 2009), so the small fraction of RGs associated with maxBCG clusters suggests that the majority of our RGs must be associated with clusters or groups of mass , a range in which the maxBCG catalog is highly incomplete (Koester et al., 2007). We then resort to the clustering properties of the RGs, which provides some insight into the relative mass scales of halos that host these subsets of RGs. We calculate the cross correlation functions between the RG subsets and the general galaxy population, constructed as a volume-limited sample of 73,202 galaxies from the NYU-VAGC DR6 (, ). We select the RGs to satisfy the same redshift and magnitude cuts as well as a lower limit in radio power , which results in 41, 211, and 123 objects for , , and subsets, respectively. The redshift space cross correlation functions are shown in Fig. 9, for (black triangles), (red circles), and class (blue squares). Although all three subsets have similar clustering strengths at scales kpc, there is a slight hint of lower clustering amplitude for the objects; if this is confirmed with larger RG samples, this implies the host halos of the subset are on average less massive than the hosts of the other subsets.
Combining these results, we see that the distributions of host halo mass for the and class subsamples are similar at group mass scale, but that of the former must have a higher tail towards clusters (). For RGs in groups, the objects must be more centrally concentrated than the class .
5.4. Radio-Loud vs Radio-Quiet
So far we have made comparisons among different subsets of RGs. It is important to place them in the context of general massive galaxy populations. Furthermore, some of the correlations between the physical properties and may be due to other fundamental correlations of the early type galaxies that have no physical connection to the radio source. For example, given that optical luminosity and effective radius are tightly correlated in elliptical galaxies (e.g., Shen et al., 2003), an anti-correlation between and would imply a similar anti-correlation between and (Fig. 6). To take out such an effect, for every RG we find up to ten RQ galaxies that have very similar redshift and absolute magnitudes in the , , and bands. For all RGs in a given bin, we calculate the average value of the physical property in question from all the matched RQ galaxies and subtract that value off from the mean obtained for the RGs (or take the ratio of the two, depending on the nature of the properties). Note that some AGNs (Seyferts and LINERs) may be included in the RQ sample, as we do not distinguish truly quiescent galaxies from those that can be regarded as AGNs based on the optical emission line diagnostics.
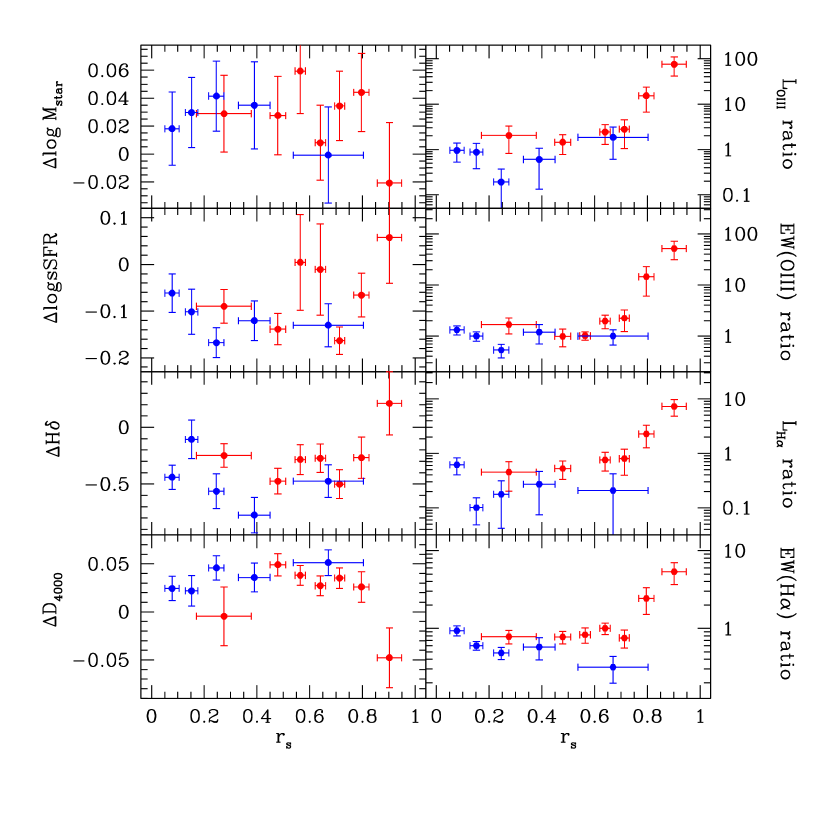
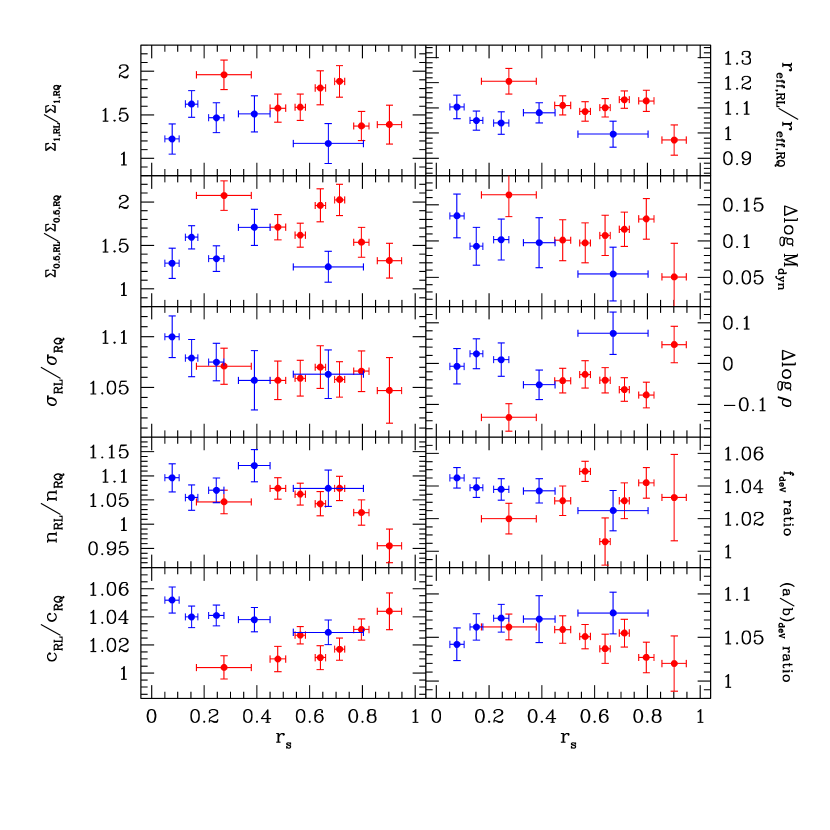
Figures 10 and 11 show the results as a function of . The comparisons presented in these two Figures are between each class and its RQ counterparts, not between the two classes. For most of the properties shown in Fig. 10 (environments and global galaxy properties), RL galaxies have higher mean values than do the RQ ones (e.g., more neighbors, higher mass and velocity dispersion, larger effective radius). The only exception is the central mass density/stellar surface density, for which the subset appears to be less dense than its RQ counterparts, mainly due to their larger scale lengths. Fig. 11 shows comparisons for some derived quantities of the stellar population and the line measurements. The and class RGs on average have slightly higher stellar mass, and older stellar age (), than their respective RQ counterparts.
Among the class objects, galaxies in the subset are closest to their RQ matches in terms of neighbor counts, , , and , but show dramatically stronger emission lines and sSFR. In contrast, emission lines are weaker for class RGs than their RQ counterparts. Class objects also live in environments that are closer to their RQ counterparts than those of class , and their sizes () are also more similar.
Let us examine the spectral properties of the RGs in more detail. In Table 3, in parentheses, we list the fraction of the matched RQ galaxies that show Seyfert- and LINER-like spectrum. This is useful for evaluating whether the active nucleus fraction is elevated in a given bin. For example, for class with , 19.6% of RGs have Seyfert nuclei, while only 1.5% of the matched RQ galaxies exhibit the same level of activity. In the same bin, 4.3% (4.9%) of the RL (RQ) galaxies have LINER nuclei. The LINER fraction for class is roughly independent of , and is fully consistent with what is found in the RQ populations, but the Seyfert activity is enhanced by about a factor of ten in RGs with (see also Ivezić et al. 2002). There is some suggestion that the nuclei of class galaxies are actually more quiescent than the matched RQ galaxies. For example, there are 2659 RQ galaxies matched to the class subsample, out of which 84 are LINERs. We thus expect to find about 8 LINERs in the 256 class RGs, but only detect 3, which is inconsistent with the Poisson expectation at 99% level (Gehrels, 1986).
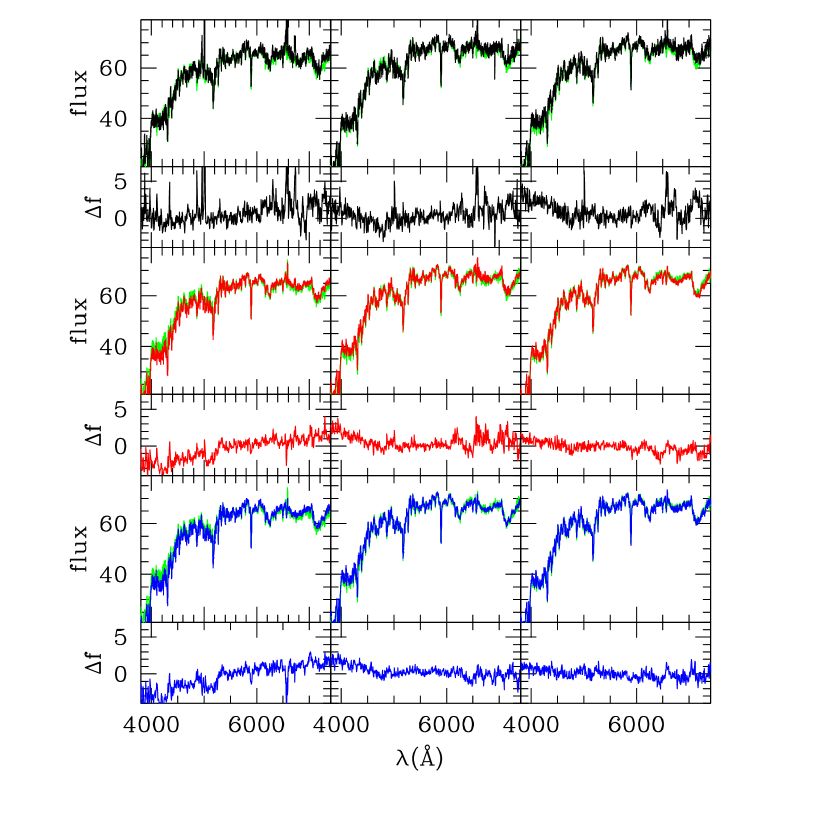
The differences in the optical spectral features are further illustrated in Fig. 12, which shows stacked SDSS spectra of various subsamples of RGs. To make a fair comparison among the three subsets (, , ), as well as between RQ and RL galaxies, we select galaxies in three SMBH mass (stellar velocity dispersion) bins, and limit the ranges of dynamical mass and stellar mass surface density to be within 50% of the locus999For computing the mean spectra, the RQ galaxies are selected to match , , and of the RGs, without any restriction on redshift and restframe , , and magnitudes, as was done earlier in this section.. These properties are chosen to select RGs of similar central engine, fuel supply, and structure. There are (19,46,23) RGs in the lowest mass bin for the , , and subsets, respectively. In the intermediate and high mass bins, the numbers of RGs are (11,99,63) and (11,71,40). In the Figure, the three columns correspond to the three mass bins (in increasing mass order from left to right); three pairs of panels are shown in each column (from top to bottom: , , ). The pair consists of the mean spectra of an RG subsample and the RQ galaxies of similar , , and (upper panel) and the differences between the RL and RQ spectra (lower panel). For each bin, the RQ galaxy mean spectrum is an average over 80 randomly selected galaxies, which are chosen irrespective of their spectral properties, and thus may contain some AGNs (Seyferts and LINERs).
A few points are worth noting from the RLRQ spectral difference panels. (1) Only RGs have statistically significantly stronger emission lines than their RQ counterparts. (2) The emission line (particularly [O III] and H) strength decreases as increases for objects. (3) In the lowest mass bin, and class RGs are redder than their RQ counterparts (based on the difference spectrum); this is not seen in the other bins.101010Recall that in Figures 10 and 11 the optical colors [, ] are used to match the RL and RQ galaxies, and thus we do not examine color differences. In addition, the H line is much weaker than that in the RQ galaxies. (4) In each mass bin, and class have, to first order, similar difference spectra, indicating their spectra are close to each other.
6. Discussion
In this section we build upon the observational results presented in the previous two sections to investigate some intriguing questions related to the physical nature of RGs: What is the correspondence between the FR types and the classes and ? Do class or objects represent evolutionary sequences? What is the physical origin of various morphologies?
6.1. Three Types of RGs?
46 out of 85 objects have no detectable [O III] emission line (i.e., the signal-to-noise ratio of the line is less than three). How do they differ from those objects with emission lines? About of RGs with [O III] line luminosity (roughly corresponding to [O III] Eddington ratio of ) show clear hot spots at the edge of the lobes (giving the impression of a bullet shot into a tenuous medium), while about of the objects without emission lines have HSB spots that show less contrast with the lobes, or have lobes that are not well-aligned. It is plausible that the mechanism that creates the emission lines is physically related to the process responsible for the generation of hot spots.
The distributions of many physical properties for the RGs with and without emission lines are often offset from each other (albeit with substantial overlap). It is the RGs with emission lines (hereafter objects; Table 2) that make this subset stand out from the rest of RGs. On the other hand, the objects without emission lines share very similar properties with the subset; the median values of most physical properties are within of each other. We may regard them as the same population as the subsample, and refer to the combined population, which accounts for the majority of class objects, as (see Table 2).
We emphasize that the objects are still massive galaxies (), and that the distinction of this population from the rest of RGs is far less dramatic than the red–blue galaxy bimodality of the general galaxy population (e.g., Baldry et al. 2004).
Since our proposed classification scheme combines both radio morphology and nuclear emission line strength, while previous ones usually rely on one or the other of these criteria (see §1), a perfect correspondence between the two is not expected. We also emphasize that our scheme is more quantitative, objective, and reproducible, than are either the FR or OL89 classifications.
Broadly speaking, we can identify the objects with HE RGs, and the rest in our sample with LE RGs, with the caveat that some of the objects do have strong emission lines (c.f. Table 3). Regarding the classification scheme of OL89, the subset corresponds to the CD type (mainly because of the high occurrence of hot spots of the former), the subset is consistent with the FD type, and class coincides with the TJ type. Although the average optical properties of class and (or ) RGs are similar, we regard them as distinct populations, mainly based on the differences in their environment, radio, and nuclear activity.
By definition, the objects have , and are thus associated with FR IIs according to the original FR definition. A direct correspondence between the FR types and our and subsets is not possible, however, given that the distributions for both class and objects are quite broad (e.g., Figures 6–8). If we have to adopt a dichotomy classification scheme, as advocated by FR and followed by many others, then we may call the class plus objects type I, and the objects type II. However, referring to these two groups as “FR I” and “FR II” would be mis-leading, as the original FR definition is solely based on .
To summarize, based on the properties of the host galaxies and radio emission, we suggest there are three groups of RGs in our sample: , , and class . There is no single physical property that can be used to cleanly separate one group from the others. For example, the distribution of the group is quite broad (c.f. Fig. 3), almost encompassing that of the objects at the high end. A simple morphological measure such as is thus only of limited use for classifying extended RGs.
In addition to , we have also explored the use of radio power in the classification scheme. Although the of the RGs with highest radio power are reasonably separated from the rest in plots like Figures 6–8 (with abscissa replaced with ), suggesting that selecting via can in principle producing a subsample similar to , we decide to stick with the morphological parameter , as understanding the origin of differences in the radio morphology is one of the main objectives of this paper (see §6.4).
We conclude by estimating the abundances of the three morphological groups, using the same volume-limited sample as in §5.3 ( and ; for RGs an additional requirement is ). The abundances relative to all galaxies are () (0.034%,0.41%,0.20%). Among the RGs (irrespective of morphology/extendedness), the fraction of these types are 0.9%, 11.1%, and 5.5%, respectively (see also Table 2).
6.2. Evolutionary Sequences?
The small dependence of the majority of physical properties we have examined on for the class objects prompts the question: are they the same RGs viewed at different stages of evolution? One could imagine that a young RG starts with large and (and smallest total size ); as the jets/lobes advance, and both decrease, while grows. Such a trend seems to be present in Fig. 8. It is important to realize that, however, many such evolutionary sequences (of different combinations of the host galaxy, central engine, environments, etc) are probably simultaneously present in our sample, and therefore the median behavior of the class (as seen in Figures 6–8) may not reflect any one sequence. To single out an evolutionary sequence, one should therefore only consider RGs of very similar properties (at least those properties that will not change over radio lobe time scales), such as mass, structure, and neighbor counts.
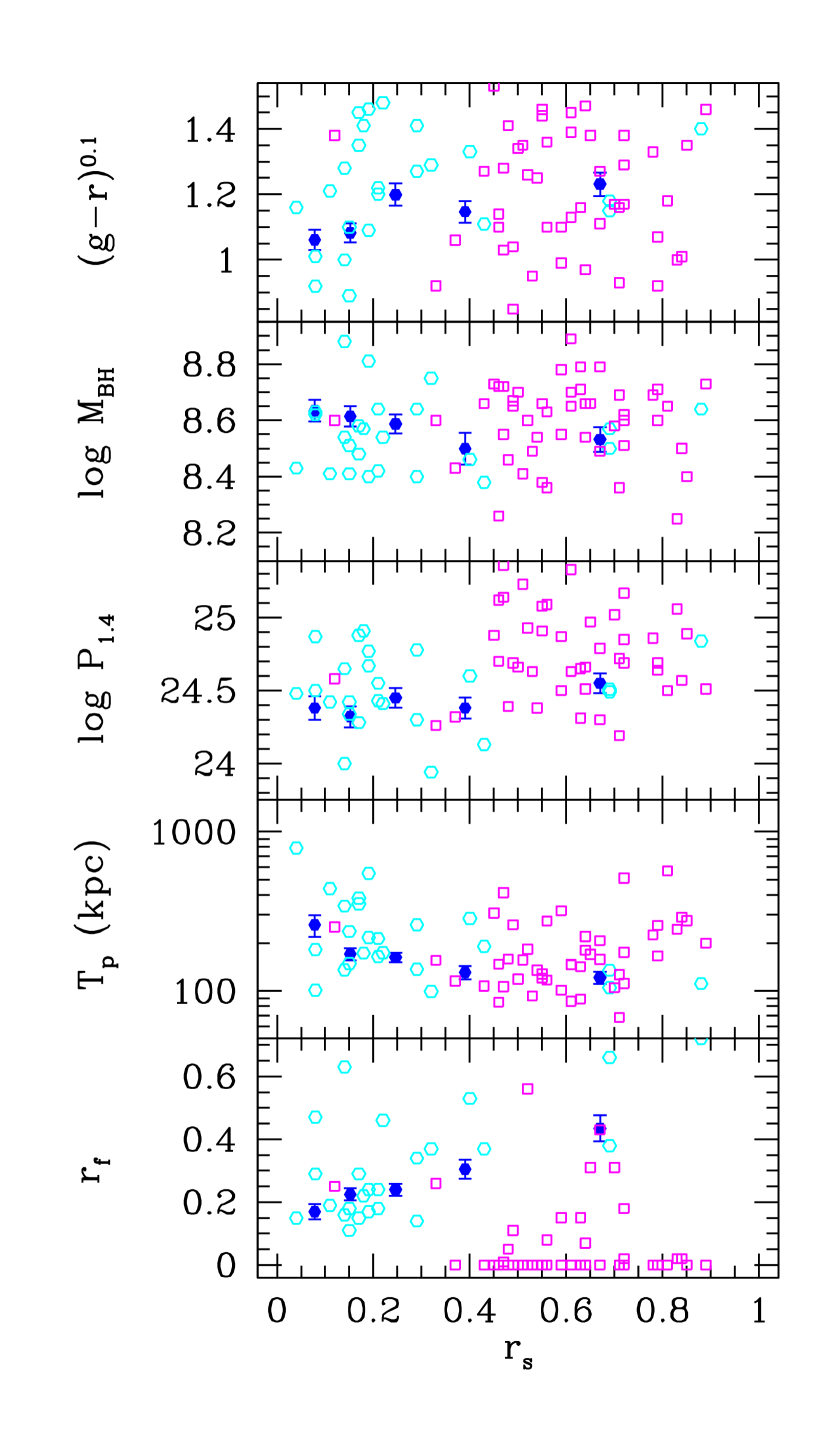
We test this idea in Fig. 13. The cyan open points are a subset of galaxies in class selected to have , , , and similar to the median value of the bin. If they can be regarded as an evolutionary sequence parameterized by decreasing , we would expect to decrease while increases, which is in rough agreement with the observed trends (of the open points), although we caution the trends may be somewhat driven by the few objects at larger .111111Another caveat is that the surface brightness of the class objects may decrease rapidly outwards, producing correlations between , and similar to that due to an evolutionary sequence for sources close to the detection limit. We thank Philip Best for pointing this out. A larger sample, with careful selection criteria, would be needed to assess the contamination due to this effect. Even though their size becomes bigger, their radio power stays about the same, probably due to the fast dissipation of energy in the jets; the outer regions do not contribute much to the luminosity.
We saw in §5.2 that there is significant overlap in the distributions of various properties for class and RGs. It is possible that some of the RGs represent the later phases of evolution of class objects. In Fig. 13 we show as magenta open squares the objects with the same ranges of , , , and as the class objects (cyan points). The most notable trend with is . If these subsets of the two classes were related, needs to increase as the sources age. However, the higher typical radio power of the objects make such an evolutionary scenario implausible.
6.3. The – Plane Revisited
In §4 we noted that RGs in our sample are not separated into two groups in the – plane via a simple division in . With the correspondence between our three subsets and the three morphological groups identified by Owen and co-workers (§6.1), could we better reconcile their results with ours?
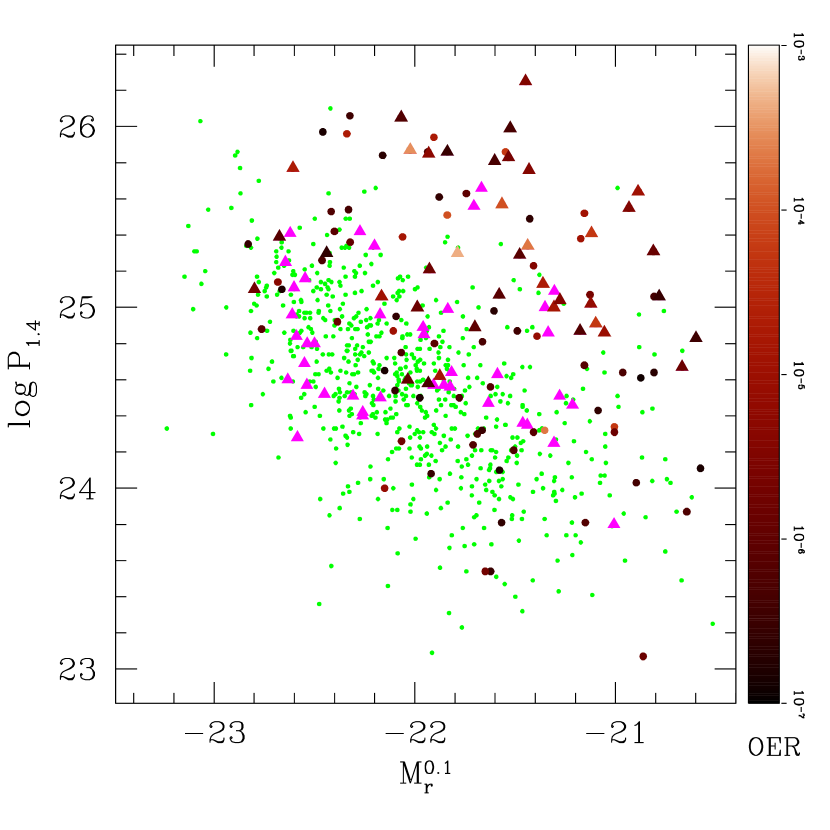
In Fig. 14, the small green dots show all the extended RGs in our sample, and triangles are the subset. The color bar in this Figure represents the [O III] line Eddington ratio (OER). There is a better, although still not complete, separation in the – plane of the RGs with relatively higher level of nuclear activity (e.g., OER , roughly corresponding to ) from the rest of the population.
The significant overlaps among the different classes of RGs in the parameters we have surveyed (e.g., , , mass, structure, environment; Figures 6–8) imply that no simple combination of non-radio observables can be used to determine/predict the morphology of the RGs (which may suggest there are many physical processes that determine the radio morphology). It is also possible that the overlap in properties is due to a mixture of RGs at different stages in their evolution, as we argued above.
We suspect the discrepancy between our finding and that of Owen et al. – who stated that the FR I and II RGs could be separated “cleanly” on the – plane – is due to sample construction. Substantial overlap between the two types is apparent using either our sample or the subsample from Gendre et al. (2010, see Fig. 5), both are radio flux-limited (see also Best 2009; Wing & Blanton 2010). However, sample selection was quite heterogeneous in some of the earlier works (OL89; Owen & White 1991; Owen 1993), where the main criterion for inclusion was to sample the – plane as much as possible. In this sense, FR II objects are over-represented. With samples assembled under better defined criteria (e.g., limited by flux and redshift, restricted to central parts of clusters), some overlap between the two types were seen in Ledlow & Owen (1996).
6.4. Origin of Different Morphologies?
The existence of objects whose two lobes exhibit clearly different FR morphologies from each other (“HYMORS” objects, Gopal-Krishna & Wiita 2000) argues that the immediate surrounding of the host galaxies must play some role in shaping the morphology. In addition, analytic models of radio sources suggest that a key quantity in determining the large scale morphology is the jet power-to-ambient density ratio () of the host galaxies (e.g., Kaiser & Best 2007; Kawakatu et al. 2009, and references therein). Here is measured at the core radius of the host galaxy. Jets from hosts with low values of are more prone to the development of turbulence and become subsonic, resulting in plume-like morphology beyond the deceleration point, while jets from systems with high ratio are strong enough to remain supersonic, leading to the hot spots at the edge of the lobes. Since the jet mechanical power is not directly observable, we assume it is proportional to (e.g., Cavagnolo et al., 2010, and references therein). We also assume can be regarded as a faithful proxy for the local interstellar medium density in the host galaxies. The median mechanical power-to-total mass density ratio () for , , and is roughly , a trend in qualitative agreement with the models. In fact, the median values of for the three subsamples vary only by about 35%, and it is mainly the difference in the radio power that drives the ratio.121212The results are qualitatively the same if we use the ratio instead.
We suspect that the accretion rate onto the SMBH is more important than the structure of the galaxy in determining the different radio morphologies (see also Baum et al. 1995; Ho 2008; for discussions on the modes of accretion, see e.g., Best et al. 2005b; Hardcastle et al. 2007; Kauffmann et al. 2008). At high accretion rates, the primary accretion flow is likely a geometrically thin, optically thick disk, which may launch jets that are very well-collimated over hundreds of kpc scale. As the accretion rate decreases, the thin disk moves away from the SMBH, and the inner region is occupied by a radiatively inefficient accretion flow (RIAF; see Esin et al. 1997; Narayan 2005), with diminished emission line luminosity. Such an accretion flow is known to create outflows (e.g., Narayan & Yi 1995; Blandford & Begelman 1999), and it is likely that jets so created will not be well-collimated (e.g., beyond hundreds of kpc), or are collimated initially, but suffer entrainment and deceleration very early on due to their lower intrinsic power.
If this picture is correct, we may understand the three subsets as follows. First, objects have highest SMBH accretion rates (e.g., OER ), are powered by classical thin accretion disks with strong, well-collimated jets that can produce strong hot spots, and are usually associated with lower mass galaxies living in less dense environments (with respect to the other subsamples considered here). The RGs are massive, found in dense environments, and their central engines are likely fed by lower accretion rates (e.g., OER ), probably in a RIAF. Finally, those galaxies with low accretion rates and with relatively low ratio will likely show jet-dominated morphology, making them class RGs.
To some degree the accretion rate correlates with ; variations in the SMBH spin, magnetic fields, the structure of the galaxy, and the density of the intergalactic/intracluster medium, however, may all cause spreads in at a given accretion rate. It is possible that uncertainties in (inferred from the – relation) also smear the correlation. About 12% (9%) of the (class ) RGs have OER ; while these high accretion rate class objects may represent earlier phases in evolution of CDs, the active class RGs with may be manifestations of the variations in at a given accretion rate mentioned above.
The difference in the accretion rate (and in turn the jet-launching mechanisms) may also explain the spectral properties of the host galaxies (see Figures 7 and 12). For jets created by a thin disk, the “zone of influence” within the host galaxy is quite small (e.g., the jets may only punch two small “holes” in the galaxy), and thus any feedback due to the jets cannot suppress efficiently the star formation activity that may be linked to the onset of the AGN activity. On the other hand, if the jets launched by a RIAF are not well-collimated, they may influence a much larger volume of the host galaxy and thus terminate star formation more easily. The most efficient feedback mode (for the host galaxy itself) may be a combination of a RIAF and a dense interstellar medium (or immediate surrounding of the host galaxy), which slows down the jets quickly and creates the class morphology.
7. Conclusion
Extended radio galaxies (RGs) have been classified based on their radio morphology or nuclear emission line activity. In this paper we have proposed a hybrid classification scheme that combines both features, and presented a comprehensive study of the host galaxy properties of RGs. Our main objectives are to detect and define distinct populations of RGs, to understand the traditional Fanaroff-Riley (FR) type I/II dichotomy in the context of our new scheme, and to unravel the origin of different radio morphologies. Our RG sample consists of 1,040 objects selected with 1.4 GHz radio flux density mJy, -band absolute magnitude (i.e., more luminous than , the characteristic magnitude of the galaxy luminosity function), radio angular diameter , physical size kpc, and at . All of the RGs in our sample appear to be massive early type galaxies.
We use the [O III] line luminosity as an indicator of the nuclear emission strength, and use a parameter as a continuous parameterization of the RG radio morphology. Here is the total size of the radio sources, and is the separation between the highest surface brightness (HSB) spots on either sides of the galaxies. Roughly 60% of our objects show HSB spots on both sides of the host galaxy; we refer to these as class RGs. About 30% of the sources appear to have prominent jets, with HSB spot coincident with the host galaxy. We call this population class (see Figures 1 and 2; Table 1).
Our main results are as follows:
- •
-
•
Among the class objects, a small population with high values of () and high [O III] line luminosity () seems to be distinguished from the rest, in the sense that on average they are hosted by lower mass galaxies, live in relatively sparse environments, and have higher accretion rates onto the central supermassive black hole (SMBH), as manifested by the [O III] line Eddington ratio (§5.1; Figures 6–8). We refer to these RGs as the subset, and the rest, the majority of class , as the subset (Table 2). The distribution of for the objects is quite broad, encompassing the range occupied by the RGs at the high end. A simple morphological measure such as is thus only of limited use for classifying extended RGs.
-
•
The average properties of and class RGs, such as the optical luminosity, stellar mass, 4000Å break strength, and velocity dispersion, differ by 20% or less from one another. However, because of the differences in the environments (e.g., characterized by the neighbor counts within 0.5 Mpc; Fig. 8, panel b) and the (nuclear) emission line properties (Fig. 8, panels g & h; Table 3), we regard them as distinct populations (§§5.2,5.4).
- •
-
•
Different researchers usually have adopted somewhat different definitions for the FR I/II types. As our proposed classification scheme is based on both radio morphology and nuclear emission line strength, and the original FR scheme is purely morphology-based, there is no one-to-one correspondence between the two. Nevertheless, given the similarities of class and class objects with , and the large difference between these subsamples and the class RGs with (§5.1), we can broadly identify the FR I type with the former and FR II with the latter sources (see the discussion in §6.1). However, there is considerable overlap in the distributions of physical properties for the three subsamples, and the transition from one FR type to the other is far from sharp (§§4,6.3). In particular, our findings do not support the previous claim that the two FR types occupy distinct regions in the radio luminosity-optical magnitude plane.
-
•
Although on average the objects are less massive than the other RG subsamples, they are still hosted by massive galaxies (). The distinction of this subset from the other RGs is far less dramatic than the blue–red bimodality of the general galaxy population.
-
•
To single out from the rest of the population in a statistically complete, low redshift RG sample for which optical emission line measurements are not available, a possible approach is to select sources with ranked in the top 10% of the distribution.
-
•
Some of the objects in class may form an evolutionary sequence, that is, they can be regarded as RGs seen at different stages of evolution, as evidenced by an anti-correlation between size and (§6.2; Fig. 13). A larger sample is needed to evaluate the effect of systematic uncertainties in the sample selection, however.
-
•
Many different mechanisms must be at work for the generation of radio jets, but we suggest that the accretion rate onto the SMBH is the main driver for the different radio morphologies, with host galaxy structure and/or density of the surrounding environment playing a secondary role. This is primarily motivated by the stark differences in the nuclear emission properties of the RG subsets. At high accretion rates (e.g., [O III] line Eddington ratio ), the accretion mode is likely dominated by a geometrically thin, optically thick disk which could generate powerful, well-collimated jets that create strong hot spots at the edge of the lobes (i.e., the “classical double” morphology). At lower accretion rates, a radiatively inefficient accretion flow (RIAF) takes over; the outflows/jets from such accretion flows may not be as well-collimated beyond the galactic nucleus scale, resulting in the “fat double” morphology (i.e., without obvious hot spots at the edge of the lobes). At slightly lower accretion rates (e.g., [O III] Eddington ratio ) and for galaxies with sufficiently high galactic density, a jet-dominated morphology is created (§6.4).
-
•
Based on the spectral properties of the galaxies, we suggest that outflows/jets from a RIAF may be more efficient in suppressing processes that cause star formation and/or nuclear activity than the jets from thin accretion disks. The latter could affect the large scale surroundings of the RGs, however (§6.4, Fig. 8).
The advent of wide-field, uniform radio and optical surveys such as NVSS, FIRST, and SDSS makes it possible to produce the large RG sample used here, and the classification scheme we propose. Although it is not clear if our scheme is more physically motivated than the existing ones (e.g., those of FR and OL89), our classification should be among the most objective and quantitative, and easily reproducible by other researchers.
In this study we have only concerned ourselves with the extended sources with relatively “straight” lobes, that is, we have excluded wide-angle tail and narrow-angle tail objects. We have also left out the compact/point-like sources and radio quasars in the analysis. In a future publication we will compare the host properties of RGs of these other morphologies, which may provide further insights into the generation of the radio emission in galactic nuclei.
Appendix A Resolution of FIRST Images
Part of the SDSS Stripe 82 has been observed with the VLA in the A configuration ( FWHM) at 1.4 GHz, reaching rms mJy/beam. 15 RGs in our sample lie in the region covered by this deep survey131313http://www.physics.drexel.edu/$∼$gtr/vla/stripe82/ (PI: G. Richards; Hodge et al. 2010, in preparation). Their redshifts range from 0.04 to 0.25, which is representative of our sample (Fig. 6, panel j). We compare the and measurements from these data with those from FIRST (hereafter with the subscripts and , respectively). Among the 15 objects, five are in class . For the ten class RGs, the ratio has a mean of 0.95 and a scatter of 0.15. We also find that the total size measurements are very close, which suggests that the value derived from FIRST is robust against resolution issues.
For four of the class RGs, the HSB coincides with prominent jets in the host galaxy in the deep VLA images, and are classified as class or , depending on the central-to-total flux ratio (§3). We note, however, that some of the flux from the lobes is resolved out in these A-array maps, and therefore ideally one should combine both the high and low resolution data to measure the proportion of flux that is in the jet component which only shows up in high resolution maps. These objects tend to have values higher than the majority of the class RGs, based on FIRST data; that is, FIRST does detect the central component. Because of the poorer angular resolution of FIRST, the jets are not as prominent as in the A-array maps.
For the current analysis, we acknowledge the possibility that some of our objects which we have put into class may in fact belong to class if measured with better data. Using the distribution of (FIRST-based) and of the above four class RGs, we estimate that 13% of class objects may be subject to this misclassification.
Although the redshift distribution for class is quite consistent across the bins, class RGs with higher are on average at slightly higher redshift (Fig. 6, panel j). Given the inherent sensitivity of the classification on the resolution, this is perhaps not surprising. For the five class objects with deeper, higher-resolution VLA data, two have based on FIRST, and have redshift of 0.224 and 0.252, respectively. At three times finer resolution than FIRST, these RGs remain jet-dominated (i.e., class ), although their decreases. Given that the properties of class objects do not vary much with respect to , we conclude that our results for class should be robust (except for the possible addition of class RGs with better measurements).
Appendix B Measurement of Total Size
We have the option of using either NVSS or FIRST data to measure the total size of the radio sources, and have chosen to use the latter as the default (except for the 41 cases where the FIRST-based sizes are much less than those from NVSS, presumably due to the insensitivity of FIRST to diffuse emission; see §3). We have repeated our analysis with NVSS-based measurements. If the fitted size of the major axis of radio sources from NVSS is only an upper limit, we exclude the sources from the sample; in addition, a minimal size of (rather than as adopted in §3) is imposed, and therefore the sample size (797 RGs) with NVSS-based measurement is smaller.
Variations of physical properties as a function of , analogous to Figures 6–8, are shown in Figures 15 and 16, for both FIRST-based and NVSS-based results. The main difference is in the total size of the sources (Fig. 16, lower left panel): those derived from NVSS are larger than the ones based on FIRST, as expected. Since is still measured using FIRST data and thus remains unchanged, the NVSS-based values are systematically lower than the FIRST-based ones; any trends with seen in Figures 6–8 would therefore appear “stretched” horizontally and shifted towards low a bit.
Using NVSS-based measurements, we still find that class objects with the highest stand out from the rest of the sample, although the division is now at . The subtle difference in properties between class and class RGs with also remains.
A possible concern of using either NVSS or FIRST to measure is the relatively high SB limits of these surveys. One could imagine that a FD source with HSB spots far from the edge of the lobes would appear as high objects if observed with insufficient depth. We have checked against the NASA/IPAC Extragalactic Database (NED) to look for archival radio images for our objects. Only 8 RGs () have been imaged with decent data from the literature, and all of them would still have high in those deeper maps. Even if such a bias due to the depth of the surveys exists, we suspect the difference in morphology between a bona fide hot spot at the edge of a lobe and a HSB region within a lobe for lower- RGs would be obvious enough in FIRST images so that a visual inspection would be able to pick up such cases.
We noted in §6.1 that the combination of the presence of hot spots at the edge of the lobes and the high accretion rate as indicated by the presence of emission lines seems to be a pretty robust indicator for the type of RGs corresponding to FR II, or the CDs. Since is unfortunately somewhat resolution-dependent, and emission line properties in the optical are not always easily available, perhaps a more objective approach to single out CDs from the rest of the population in a statistically complete, low redshift RG sample (so that our results are fully applicable) is to select sources with ranked in the top 10% of the distribution.
| SDSS ID | VAGC IDaaNYU VAGC DR6 object ID. | Class | RA | Dec | |||||||||
|---|---|---|---|---|---|---|---|---|---|---|---|---|---|
| (J2000) | (J2000) | (W/Hz) | (km/s) | (kpc) | (kpc) | () | |||||||
| 587731186743967908 | 1659866 | 7.247278 | 0.2222 | 24.44 | 331 | 11.5 | 111 | 0.48 | |||||
| 588015510345613463 | 1699168 | 5.794018 | 0.2270 | 24.68 | 266 | 9.2 | 120 | 0.24 | |||||
| 587724232636498080 | 354077 | 7.205604 | 0.0977 | 24.96 | 177 | 6.8 | 368 | 0.56 | |||||
| 587731185132503151 | 1652016 | 5.281742 | 0.1082 | 24.52 | 268 | 9.5 | 117 | 0.69 |
Note. — The full table is available and kept up-to-date at http://member.ipmu.jp/yen-ting.lin/RG/index.html
References
- Adelman-McCarthy et al. (2008) Adelman-McCarthy, J. K., et al. 2008, ApJS, 175, 297
- Baldry et al. (2004) Baldry, I. K., Glazebrook, K., Brinkmann, J., Ivezić, Ž., Lupton, R. H., Nichol, R. C., & Szalay, A. S. 2004, ApJ, 600, 681
- Baldi & Capetti (2010) Baldi, R. D. & Capetti, A. 2010, A&A, accepted (arXiv:1005.3223)
- Baldwin et al. (1981) Baldwin, J. A., Phillips, M. M., & Terlevich, R. 1981, PASP, 93, 5
- Barthel (1989) Barthel, P. D. 1989, ApJ, 336, 606
- Baum & Heckman (1989) Baum, S. A., & Heckman, T. 1989, ApJ, 336, 681
- Baum et al. (1995) Baum, S. A., Zirbel, E. L., & O’Dea, C. P. 1995, ApJ, 451, 88
- Becker et al. (1995) Becker, R. H., White, R. L., & Helfand, D. J. 1995, ApJ, 450, 559
- Best et al. (2005a) Best, P. N., Kauffmann, G., Heckman, T. M., & Ivezić, Ž. 2005a, MNRAS, 362, 9
- Best et al. (2005b) Best, P. N., Kauffmann, G., Heckman, T. M., Brinchmann, J., Charlot, S., Ivezić, Ž., & White, S. D. M. 2005b, MNRAS, 362, 25
- Best (2009) Best, P. N. 2009, Astronomische Nachrichten, 330, 184
- Blandford & Begelman (1999) Blandford, R. D. & Begelman, M. C. 1999, MNRAS, 303, L1
- Blanton et al. (2003) Blanton, M. R., Hogg, D. W., Bahcall, N. A., Brinkmann, J., Britton, M., Connolly, A. J., Csabai, I., Fukugita, M., Loveday, J., Meiksin, A., Munn, J. A., Nichol, R. C., Okamura, S., Quinn, T., Schneider, D. P., Shimasaku, K., Strauss, M. A., Tegmark, M., Vogeley, M. S., & Weinberg, D. H. 2003, ApJ, 592, 819
- Blanton et al. (2005) Blanton, M. R., Schlegel, D. J., Strauss, M. A., Brinkmann, J., Finkbeiner, D., Fukugita, M., Gunn, J. E., Hogg, D. W., Ivezić, Ž., Knapp, G. R., Lupton, R. H., Munn, J. A., Schneider, D. P., Tegmark, M., & Zehavi, I. 2005, AJ, 129, 2562
- Bonnarel et al. (2000) Bonnarel, F., Fernique, P., Bienaymé, O., Egret, D., Genova, F., Louys, M., Ochsenbein, F., Wenger, M., & Bartlett, J. G. 2000, A&AS, 143, 33
- Brinchmann et al. (2004) Brinchmann, J., Charlot, S., White, S. D. M., Tremonti, C., Kauffmann, G., Heckman, T., & Brinkmann, J. 2004, MNRAS, 351, 1151
- Cavagnolo et al. (2010) Cavagnolo, K. W., McNamara, B. R., Nulsen, P. E. J., Carilli, C. L., Jones, C., & Birzan, L. 2010, ApJ, in press (arXiv:1006.5699)
- Condon et al. (1998) Condon, J. J., Cotton, W. D., Greisen, E. W., Yin, Q. F., Perley, R. A., Taylor, G. B., & Broderick, J. J. 1998, AJ, 115, 1693
- De Young (1993) De Young, D. S. 1993, ApJ, 405, L13
- De Young (2002) De Young, D. S. 2002, The physics of extragalactic radio sources (University of Chicago Press)
- Esin et al. (1997) Esin, A. A., McClintock, J. E., & Narayan, R. 1997, ApJ, 489, 865
- Falcke & Biermann (1995) Falcke, H. & Biermann, P. L. 1995, A&A, 293, 665
- Fanaroff & Riley (1974) Fanaroff, B. L. & Riley, J. M. 1974, MNRAS, 167, 31P
- Gehrels (1986) Gehrels, N. 1986, ApJ, 303, 336
- Gendre et al. (2010) Gendre, M. A., Best, P. N., & Wall, J. V. 2010, MNRAS, 404, 1719
- Gendre & Wall (2008) Gendre, M. A. & Wall, J. V. 2008, MNRAS, 390, 819
- Gopal-Krishna & Wiita (2000) Gopal-Krishna & Wiita, P. J. 2000, A&A, 363, 507
- Graham et al. (2005) Graham, A. W., Driver, S. P., Petrosian, V., Conselice, C. J., Bershady, M. A., Crawford, S. M., & Goto, T. 2005, AJ, 130, 1535
- Hardcastle et al. (2006) Hardcastle, M. J., Evans, D. A., & Croston, J. H. 2006, MNRAS, 370, 1893
- Hardcastle et al. (2007) Hardcastle, M. J., Evans, D. A., & Croston, J. H. 2007, MNRAS, 376, 1849
- Heckman et al. (1994) Heckman, T. M., O’Dea, C. P., Baum, S. A., & Laurikainen, E. 1994, ApJ, 428, 65
- Heywood et al. (2007) Heywood, I., Blundell, K. M., & Rawlings, S. 2007, MNRAS, 381, 1093
- Hine & Longair (1979) Hine, R. G. & Longair, M. S. 1979, MNRAS, 188, 111
- Ho (2008) Ho, L. C. 2008, ARA&A, 46, 475
- Ivezić et al. (2002) Ivezić, Ž., et al. 2002, AJ, 124, 2364
- Kaiser & Best (2007) Kaiser, C. R. & Best, P. N. 2007, MNRAS, 381, 1548
- Kauffmann et al. (2008) Kauffmann, G., Heckman, T. M., & Best, P. N. 2008, MNRAS, 384, 953
- Kauffmann et al. (2003a) Kauffmann, G., Heckman, T. M., Tremonti, C., Brinchmann, J., Charlot, S., White, S. D. M., Ridgway, S. E., Brinkmann, J., Fukugita, M., Hall, P. B., Ivezić, Ž., Richards, G. T., & Schneider, D. P. 2003a, MNRAS, 346, 1055
- Kauffmann et al. (2003b) Kauffmann, G., Heckman, T. M., White, S. D. M., Charlot, S., Tremonti, C., Peng, E. W., Seibert, M., Brinkmann, J., Nichol, R. C., SubbaRao, M., & York, D. 2003b, MNRAS, 341, 54
- Kawakatu et al. (2009) Kawakatu, N., Kino, M., & Nagai, H. 2009, ApJ, 697, L173
- Kimball & Ivezić (2008) Kimball, A. E. & Ivezić, Ž. 2008, AJ, 136, 684
- Koester et al. (2007) Koester, B. P., McKay, T. A., Annis, J., Wechsler, R. H., Evrard, A., Bleem, L., Becker, M., Johnston, D., Sheldon, E., Nichol, R., Miller, C., Scranton, R., Bahcall, N., Barentine, J., Brewington, H., Brinkmann, J., Harvanek, M., Kleinman, S., Krzesinski, J., Long, D., Nitta, A., Schneider, D. P., Sneddin, S., Voges, W., & York, D. 2007, ApJ, 660, 239
- Komatsu et al. (2010) Komatsu, E., Smith, K. M., Dunkley, J., Bennett, C. L., Gold, B., Hinshaw, G., Jarosik, N., Larson, D., Nolta, M. R., Page, L., Spergel, D. N., Halpern, M., Hill, R. S., Kogut, A., Limon, M., Meyer, S. S., Odegard, N., Tucker, G. S., Weiland, J. L., Wollack, E., & Wright, E. L. 2010, ApJS, submitted (arXiv:1001.4538)
- Laing (1993) Laing, R. A. 1993, Astrophysics and Space Science Library, 103, 95
- Laing et al. (1994) Laing, R. A., Jenkins, C. R., Wall, J. V., & Unger, S. W. 1994, The Physics of Active Galaxies, 54, 201
- Leahy (1993) Leahy, J. P. 1993, in Lecture Notes in Physics, Berlin Springer Verlag, Vol. 421, Jets in Extragalactic Radio Sources, ed. H.-J. Röser & K. Meisenheimer, 1
- Ledlow & Owen (1995) Ledlow, M. J. & Owen, F. N. 1995, AJ, 109, 853
- Ledlow & Owen (1996) Ledlow, M. J. & Owen, F. N. 1996, AJ, 112, 9
- Lin & Mohr (2007) Lin, Y.-T. & Mohr, J. J. 2007, ApJS, 170, 71
- Lupton (1993) Lupton, R. H. 1993, Statistics in theory and practice (Princeton University Press)
- Mackay (1971) Mackay, C. D. 1971, MNRAS, 154, 209
- Mandelbaum et al. (2009) Mandelbaum, R., Li, C., Kauffmann, G., & White, S. D. M. 2009, MNRAS, 393, 377
- Narayan (2005) Narayan, R. 2005, Ap&SS, 300, 177
- Narayan & Yi (1995) Narayan, R. & Yi, I. 1995, ApJ, 444, 231
- O’Dea (1998) O’Dea, C. P. 1998, PASP, 110, 493
- Owen (1993) Owen, F. N. 1993, Lecture Notes in Physics, Berlin Springer Verlag, 421, 273
- Owen & Laing (1989) Owen, F. N. & Laing, R. A. 1989, MNRAS, 238, 357
- Owen & White (1991) Owen, F. N. & White, R. A. 1991, MNRAS, 249, 164
- Petrosian (1976) Petrosian, V. 1976, ApJ, 209, L1
- Reyes et al. (2008) Reyes, R., Mandelbaum, R., Hirata, C., Bahcall, N., & Seljak, U. 2008, MNRAS, 390, 1157
- Salim et al. (2007) Salim, S., Rich, R. M., Charlot, S., Brinchmann, J., Johnson, B. D., Schiminovich, D., Seibert, M., Mallery, R., Heckman, T. M., Forster, K., Friedman, P. G., Martin, D. C., Morrissey, P., Neff, S. G., Small, T., Wyder, T. K., Bianchi, L., Donas, J., Lee, Y., Madore, B. F., Milliard, B., Szalay, A. S., Welsh, B. Y., & Yi, S. K. 2007, ApJS, 173, 267
- Shen et al. (2003) Shen, S., Mo, H. J., White, S. D. M., Blanton, M. R., Kauffmann, G., Voges, W., Brinkmann, J., & Csabai, I. 2003, MNRAS, 343, 978
- Strauss et al. (2002) Strauss, M. A., et al. 2002, AJ, 124, 1810
- Tremaine et al. (2002) Tremaine, S., Gebhardt, K., Bender, R., Bower, G., Dressler, A., Faber, S. M., Filippenko, A. V., Green, R., Grillmair, C., Ho, L. C., Kormendy, J., Lauer, T. R., Magorrian, J., Pinkney, J., & Richstone, D. 2002, ApJ, 574, 740
- Urry & Padovani (1995) Urry, C. M. & Padovani, P. 1995, PASP, 107, 803
- Veilleux & Osterbrock (1987) Veilleux, S. & Osterbrock, D. E. 1987, ApJS, 63, 295
- Willott et al. (2001) Willott, C. J., Rawlings, S., Blundell, K. M., Lacy, M., & Eales, S. A. 2001, MNRAS, 322, 536
- Wing & Blanton (2010) Wing, J. D., & Blanton, E. L. 2010, AJ, submitted (arXiv:1008.1099)
- York et al. (2000) York, D. G., et al. 2000, AJ, 120, 1579
- Zirbel (1997) Zirbel, E. L. 1997, ApJ, 476, 489
- Zirbel & Baum (1995) Zirbel, E. L. & Baum, S. A. 1995, ApJ, 448, 521