UNDERSTANDING AGN-HOST CONNECTION IN PARTIALLY OBSCURED ACTIVE GALACTIC NUCLEI.
Part III: PROPERTIES OF ROSAT-SELECTED SDSS AGNs
Abstract
As the third paper of our serial studies that are aim at examining the AGN-host coevolution by using partially obscured AGNs, we extend the broad-line composite galaxies (composite AGNs) into ROSAT-selected Seyfert 1.8/1.9 galaxies basing upon the RASS/SDSS-DR5 catalog given by Anderson et al.. The SDSS spectra of in total 92 objects are analyzed by the same method used in our previous studies, after requiring the signal-to-noise ratio in the SDSS band is larger than 20. Combing the ROSAT-selected Seyfert galaxies with the composite AGNs reinforces the tight correlation between the line ratio [O I]/H vs. , and establishes a new tight correlation between [S II]/H vs. . Both correlations suggest the two line ratios are plausible age indicators of the circumnuclear stellar population for typical type I AGNs in which the stellar populations are difficult to be derived from their optical spectra. The ROSAT-selected Seyfert galaxies show that the two correlations depend on the soft X-ray spectral slope that is roughly estimated from the hardness ratios by requiring the X-ray count rates within 0.1-2.4 keV are larger than . However, we fail to establish a relationship between and , which is likely caused by the relatively large uncertainties of both parameters (especially for because of the AGN intrinsic obscuration). The previously established evolutionary sequence is reinforced again by the extension to the ROSAT-selected Seyfert galaxies. These X-ray-selected Seyfert galaxies are, however, biased against the two ends of the sequence, which implies that the X-ray Seyfert galaxies present a population at middle evolutionary stage.
1 INTRODUCTION
Active Galactic Nuclei (AGNs) are now widely believed to co-evolve with their host galaxies. The co-evolution scenario is based upon the two observational facts. One is the firmly established tight Magorrian relationship (i.e., the or relationship, e.g., Magorrian et al. 1998; Tremaine et al. 2002; Ferrarese & Merritt 2000; Greene & Ho 2006; Greene et al. 2008; Haring & Rix 2004). Another one is the fact that the global evolutionary history of growth of central supermassive black hole (SMBH) and star formation history trace each other closely from present to redshift (e.g., Nandra et al. 2005; Silverman et al. 2008; Shankar et al. 2009; Hasinger et al. 2005). A lot of efforts in both theoretical and observational grounds have been made to understand the elusive evolutionary connection between AGNs and their host galaxies over the past decades. For example, young stellar populations and enhanced ongoing star formation activities are prevalently identified in host galaxies of many Seyfert galaxies and quasars (e.g., Gonzalez Delgado 2002; Silverman et al. 2009; White & Nelson 2003; Zuther et al. 2007; Canalizo & Stockton 2001; Stockton et al. 2007; Riffel et al. 2008; Cid Fernandes et al. 2001, 2005; Davies et al. 2007; Canalizo et al. 2007; Wang & Wei 2006; Zhou et al. 2005; Mao et al. 2009; Heckman & Kauffmann 2006). In addition, many authors established a relationship between the black hole accretion properties (e.g., ) and properties (e.g., age and star formation rate) of stellar population of bulge of AGN host galaxies (e.g., Kewley et al. 2006; Wild et al. 2007; Wang et al. 2006; Wang & Wei 2008; Watabe et al. 2008; Davies et al. 2007). Theoretical simulations indicated that a major merger between two gas-rich disk galaxies is a plausible model for the co-evolution (e.g., Di Matto et al. 2007; Hopkins et al. 2005, 2007; Granato et al. 2004). Finally, there are accumulating evidence supporting that the detectable AGN activity delays for Myr after the onset of the star formation activity (e.g., Hopkins et al. 2005; Wang & Wei 2006; Wang et al. 2009b; Schawinski et al. 2009; Reichard et al. 2008; Li et al. 2007).
Nevertheless, the details of the co-evolution issue are still far from fully understood at the current stage. The main difficulty in understanding the coevolution is the orientation effect caused by the AGN’s torus (see reviews in Antonucci 1993; Elitzur 2007). We refer the readers to Wang & Wei (2008, and references therein, hereafter Paper I) for a brief comment on the several approaches that were adopted to overcome the difficulty. In Paper I, the spectra of partially obscured AGNs were used to simultaneously measure the properties of both AGN and stellar population in an individual object. By examining the spectral properties of the 85 composite AGNs111These composite AGNs with broad H emission lines are selected from the composite galaxies that are located in the [O III]/H vs. [N II]/H diagnostic diagram between the empirical and theoretical demarcation lines that separate AGNs from starforming galaxies. selected from the SDSS DR4 MPA/JHU catalog (see Heckman & Kauffmann 2006 for a review), we identified a evolutionary sequence and a tight correlation between the spectral break at 4000Å () and line flux ratio [O I]/H.
The study in Paper I is, however, far from a complete understanding of the co-evolution issue. At first, Paper I only focused on the composite galaxies whose narrow emission lines are believed to contain significant contributions from both star formation and AGN. The stellar populations in the composite galaxies are found to be systematically young (e.g., Kewley et al. 2006; Wang & Wei 2008; Schawinski et al. 2009), which naturally causes the composite AGNs studied in Paper tend to cluster around the small end in the two relationships. Basing upon the narrow emission-line galaxies from the MPA/JHU catalog, Kewley et al. (2006) suggested that the composite galaxies might evolve to Seyfert galaxies222The Seyfert galaxies are defined as the emission-line galaxies whose location in the [O III]/H vs. [N II]/H diagram is above the theoretical demarcation lines that separate AGNs from starforming galaxies (see Section 3.2 for details). (see also in Constantin et al. 2009). An inclusion of the Seyfert galaxies (and also LINERs) is therefore necessary for obtaining a complete understanding of the co-evolution issue.
Secondly, the X-ray emission of AGNs that are not examined in Paper I might play an important role in the co-evolution. The theoretical calculations suggested that the line ratio [O I]/H is sensitive to the hardness of the ionizing field (Kewley et al. 2006). The tight correlation between [O I]/H and therefore implies an evolutionary significance of X-ray emission of AGNs. The evolutionary role of X-ray emission is also indirectly suggested by the study of the Eigenvector I (EI) space of AGNs. The EI space was first introduced by Boroson & Green (1992) who analyzed the optical spectra of 87 bright PG quasars, and was subsequently extended to soft X-ray spectral slope (e.g., Wang et al. 1996; Grupe 2004; Xu et al. 2003, and see Sulentic et al. 2000 for a review). By examining the optical spectra of a sample of IRAS-selected Seyfert 1.5 galaxies, Wang et al. (2006) first extended the EI space into middle-far infrared colors , which implies a relation between the essential EI space and age of circumnuclear stellar population.
A sample of X-ray selected Seyfert galaxies is therefore not only appropriate to the extension of the two relationships (i.e., the sequence and [O I]/H vs. correlation) to Seyfert galaxies, but also required by the study of the speculated evolutionary role of X-ray emission. It is widely accepted that luminous X-ray emission is a common property for typical AGNs. Typically, X-ray luminosity in AGNs contributes a fraction of about 5-40% bolometric luminosity. A large fraction of the counterparts of the X-ray sources are optically spectroscopically identified as AGNs (e.g., Stocke et al. 1991; Obric et al. 2006; Anderson et al. 2007; Kollatschny et al. 2008; Mahoney et al. 2010; Wei et al. 1999). Obric et al. (2006) found the number of AGNs is six times more than starforming galaxies for SDSS-ROSAT narrow emission-line galaxies according to the [O III]/H vs. [N II]/H diagnostic diagram. Because the properties of stellar populations are required in our study, we focus on partially obscured AGNs again by following the same approach used in Paper I since their spectra have an advantage of balance of contribution of AGN and starlight.
With these motivations, we extend the study in Paper I to soft X-ray selected partially obscured Seyfert galaxies by selecting these galaxies from the combination of the SDSS DR5 spectroscopic survey and ROSAT All Sky Survey (hereafter ROSAT -selected Seyfert galaxies). The cross-match was originally done by Anderson et al. (2007). The selected sample is combined with the composite AGNs studied in Paper I to provide a complete understanding of the co-evolutionary issue, except for the analysis in which the X-ray properties are required. The paper is structured as follows. §2 describes the sample selection and data reduction. The physical properties of both AGNs and stellar populations are obtained in §3. §4 and §5 present our analysis and discussion, respectively. The cold dark matter (CDM) cosmology with parameter , , and (Spergel et al. 2003) is adopted throughout the paper.
2 SAMPLE AND DATA REDUCTION
2.1 The Sample of SDSS DR5/RASS Seyfert 1.8/1.9 Galaxies
Anderson et al. (2007 and references therein) recently carried out a RASS/SDSS program to identify the optical counter parts of the ROSAT X-ray sources from the SDSS Data Release 5 catalog, simply because the depth of the two surveys are well matched. The updated catalog contains about 7,000 quasars/broad-line AGNs and 500 narrow-line AGNs (including Seyfert 1.5-1.9 galaxies) with plausible X-ray emission. These AGNs were classified by Anderson et al. (2007) through visual examination of their SDSS spectra. We only focus on the Seyfert 1.8/1.9 galaxies in this paper. Among these Seyfert 1.8/1.9 galaxies, we further require the redshifts range from 0.03 to 0.3, which is comparable with the study in Paper I. In order to ensure that our results are not affected by the spectra with poor quality, the objects with signal-to-noise ratio in band image larger than 20 are only considered in our subsequent analysis. There are finally a total of 93 ROSAT-selected Seyfert galaxies that are listed in our final sample.
RASS surveyed nearly all sky down to a limiting sensitivity . The sensitivity limit therefore results in a selection effect that leads us to miss the AGNs with low X-ray emission (both intrinsic and obscured, see Section 4.2 for details).
The position error circles are about 10˝-30˝ for RASS. The probability of true match between SDSS and RASS strongly depends not only on the angular distance between SDSS main galaxy sample and RASS sources, but also on the spectral types of galaxies. The simulation in Parejko et al. (2008) indicates that a) the probability of a reliable cross-match between SDSS galaxies and RASS sources is larger than 40% when the seperation is within ˝; b) this probability is greatly enhanced to % if the galaxies can be classified as AGNs with broad emission lines (see also Anderson et al. 2007); c) a X-ray counterpart could be always reliably identified for LINERs, Seyfert 2s, transitions and unclassified galaxies, except for starforming galaxies. The cross-match radius adopted in Anderson et al. (2007) is 27.5˝ away from each of the bright X-ray source. Our spectral analysis shows that none of the ROSAT-selected galaxies used in the current study is classified as a starforming galaxy. The redshifts are displayed per spectral type in Figure 1 for the ROSAT-selected Seyfert galaxies. The mean and median values are marked by the open triangle and square, respectively, for each of the spectral type. We classified these galaxies as transitions (T), Seyfert galaxies (S), LINERs (L) and unclassified galaxies (U) following the recent classification scheme proposed in Kewley et al. (2006) using the Baldwin-Phillips-Terlevich (BPT) diagrams (see Section 3.2). All four types of galaxy show similar both mean and median redshifts at around .
2.2 Spectral Analysis
The SDSS spectra are reduced by following the identical method that was described in detail in Paper I. Briefly, the Galactic extinction is first corrected for each spectrum by using the color excess taken from the Schlegel, Finkbeiner and Davis Galactic reddening map (Schlegel et al. 1998). The extinction law with is adopted for the correction (Cardelli et al. 1989). Each extinction-corrected spectrum is then transformed to the rest frame, along with the -correction, given the redshift measured by the SDSS pipelines (Glazebrook et al. 1998; Bromley et al. 1998).
Among the whole sample, the continuum of a majority of the spectra (90%=83 objects) is dominated by the stellar absorption features. For each of these objects, a pipeline based on the principal component analysis (PCA) method has been developed by us to separate the starlight from the observed spectrum. We refer the readers to Paper I for the details of the PCA method. The modeling and removing of the starlight component is illustrated for one typical object in the upper panel of the left column of Figure 2. However, the starlight component can not be correctly separated from the observed spectra for the remaining 13 objects, because their continuum is dominated by the featureless emission from central AGNs. In these cases, the continuum is instead modeled by a powerlaw through a minimization. The minimization is carried out in the rest-frame wavelength ranging from 4000Å to 7000Å, except for the regions around the strong AGN emission lines: e.g., Balmer lines, [O III]4959, 5007, He II4686, [N II]6583, 6548, [S II]6716, 6731, [O III]4363, and possible Fe II complex from 4200Å to 4500Å. In fact, the Fe II blends are not included in the continuum modeling and in the subsequent analysis, because the Fe II blends are too weak to be detectable in these spectra. The lower panel in the left column in Figure 2 shows an illustration for the powerlaw continuum modeling.
The emission lines are modeled and measured by the SPECFIT task (Kriss 1994) in the IRAF package333IRAF is distributed by the National Optical Astronomical Observatories, which is operated by the Association of Universities for Research in Astronomy, Inc., under cooperative agreement with the National Science Foundation. at the H and H regions, after the starlight/powerlaw continuum is removed from the observed spectra. In each spectrum, the observed profile of each emission line is modeled by a set of Gaussian components through their linear combination. The emission-line modelings in the H and H regions are schemed in the middle and right columns in Figure 2, respectively. The flux of [O I]6300 emission line is measured by a direct integration in each spectrum through the SPLOT task in the IRAF. Although the broad H emission can be usually well modeled by a single Gaussian component in most objects, an additional very broad H (with FWHM) is required to adequately model the broad H emission in five objects (see Paper I and references therein, and recently in Zhu et al. 2008). We determine the FWHM of the broad H emission in these particular cases as follows. We first model the observed H profile by a set of Gaussian components including the additional very broad component. A residual profile is then produced by subtracting the modeled H narrow component from the observed profile. The line width of the broad H emission is finally measured on the residual profile through the SPLOT task. The starlight around H is usually over-subtracted, especially for the objects associated with old stellar populations, which results in a 2%-7% underestimate in the H flux (see Paper I and Asari et al. 2007). The over-subtraction is probably caused by the calibration in the STELIB library (Asari et al. 2007). In this paper, we slightly enhance the continuum level around the H emission line from zero by acquiring all the H emission is above the zero level to account for the small underestimation. Although the small underestimation is corrected here, the results given in this paper are still comparable with our study in Paper I where the small underestimation is ignored, both because the correction is too small to affect the main results and because the composite AGNs are mainly associated with relatively young stellar populations.
The results of the emission-line measurements are tabulated in Table 1 and 2 for the objects whose continuum is dominated by starlight and by powerlaw emission, respectively. For each object in Table 1, Column (1) lists the SDSS identification, and Column (2) the corresponding redshift. The line ratios in logarithm of [N II]/H, [S II]/H, [O I]/H and [O III]/H are listed from Column (3) to Column (6). Column (7) and (8) show the FWHM of the H broad component and intrinsic luminosity (), respectively. The luminosity is corrected for the local extinction. The extinction is inferred from the narrow-line ratio H/H for each object, assuming the Balmer decrement for standard case B recombination and Galactic extinction curve with . For the objects whose continuum is modeled by a powerlaw instead of starlight, Table 2 only lists their line ratios of [N II]/H, [S II]/H, [O I]/H and [O III]/H, since the broad H components will not be used in our subsequent analysis.
3 ANALYSIS AND RESULTS
Basing upon the spectral measurements given above, the multiwavelength properties of the ROSAT-selected Seyfert galaxies are derived and analyzed in this section. The ROSAT-selected galaxies are then combined and compared with the composite AGNs previously studied in Paper I to give us a complete understanding of the coevolution of AGNs and their host galaxies.
3.1 Deriving Physical Properties
The black hole mass (), Eddington ratio (), soft X-ray spectral slope and spectral indices being sensitive to age of stellar population are calculated basing upon the spectral analysis mentioned above. The calculation is briefly described as follows, because some methods that are adopted here are the same as that used in Paper I. We refer the readers to Paper I for the details of the calculation and discussion about the uncertainties.
3.1.1 and
Two arguments allow us to believe that the detected emission of the H broad components is mainly contributed from central AGNs. At first, the detectable X-ray emission strongly supports the presence of an AGN in the center of the galaxies. Moreover, the minimal value of the measured luminosity of the broad H components is . The average and median values are and , respectively, which is far larger than the values that could be produced by the other mechanisms (e.g., WRs and luminous blue variables with , see Izotov et al. 2007; Izotov & Thuan 2008 and references therein; and discussions in Paper I).
Following the study in Paper I, the two basic parameters of black hole accretion (i.e., and ) are directly estimated from the AGN broad H emission lines, because the continuum of these objects is highly contaminated by the emission from their host galaxies. Basing upon the revised luminosity-radius relation provided by Bentz et al. (2009), Greene & Ho (2007) derived an updated estimator of mass of central SMBH. In order to compare the results given in the current paper with that reported in Paper I, we estimate and by using the same equations used in Paper I, i.e., the calibrations provided in Greene & Ho (2005). The estimated values of and are listed in the Column (11) and (12) in Table 1 for each object, respectively. and are not available for 14 objects in which the very weak broad H components prevent us from estimating the values. As stated in Paper I, the estimated and are likely systemically underestimated in the partially obscured AGNs. The upper limit of the underestimation is roughly for and for .
3.1.2 and H
As done in Paper I, we use the 4000Å break () and equivalent width of H absorption of A-type stars (H) as indicators of the ages of stellar populations of AGN host galaxies (e.g., Heckman et al. 2004; Kauffmann et al. 2003a; Kewley et al. 2006). The two indices are measured in the removed starlight spectrum for each object. The measured values of both indices are tabulated in Column (9) and (10) in Table 1. Figure 3 compares the number distribution of the measured of the ROSAT-selected Seyfert galaxies with that of the composite AGNs. The stellar populations of the ROSAT-selected Seyfert galaxies are systematically older than that of the composite AGNs, which agrees with the previous studies (e.g., Kewley et al. 2006). The Gehan’s generalized Wilcoxon two-sample statistical test shows the two distributions are drawn from the same parent population at the confidence level of 1.2%. This conclusion is further confirmed by a two-side Kolmogorov-Smirnov test that yields a maximum discrepancy of 0.21 with a corresponding probability 5.6% that the two distributions match.
3.1.3 Soft X-ray spectral slope
The X-ray spectral properties are estimated from the ROSAT hardness ratios HR1 and HR2444 The ROSAT hardness ratios HR1 and HR2 are defined as and , where , , , and are the count rates in the energy bands 0.1-0.4, 0.5-2.0,0.5-0.9 and 0.9-2.0 keV, respectively. (Voges et al. 1999) by assuming a single powerlaw (i.e., ) modified by the foreground absorption resulted from our own galaxy only (e.g., Xu et al. 2003; Yuan et al. 2008; Grupe et al. 1998). The Galactic hydrogen column density is transformed from the color excess through the calibration (Bohlin et al. 1978) for each object, where is adopted from the Schlegel, Finkbeiner and Davis Galactic reddening map (Schlegel et al. 1998) again. The soft X-ray opacity is calculated from the effective absorption cross sections given in Morrison & McCammon (1983) by assuming a solar abundance.
Previous studies suggested that this method is reliable and robust if the intrinsic X-ray spectra can indeed be described as a simple powerlaw (e.g., Brinkmann & Siebert 1994; Schartel et al. 1996). The X-ray spectral slope is estimated for the objects whose X-ray count rates within the 0.1-2.4 keV band are larger than . We list the estimated in Column (13) in Table 1 and Column (7) in Table 2. The estimated ranges from 0.1 to 5, which statistically agrees with the previous studies that focused on typical Type I AGNs (e.g., Xu et al. 2003; Grupe 2004). Although it is the best approach for a large AGN sample at present, strictly speaking, local absorption (and obscuration) from AGNs and their host galaxies should be involved in the spectral model for these partially obscured AGNs, because X-ray and optical absorptions are statistically correlated in AGNs (e.g., Garcet et al. 2007; Silverman et al. 2005). In fact, one can see from below that such simple approach greatly degrades our results.
3.2 BPT Diagnostic Diagrams
The refined BPT diagrams (Baldwin et al. 1981; Vellieux & Osterbrock 1987) are commonly used to diagnose the central energy sources in narrow-line emission galaxies (see recent review in Groves et al. 2006). According to the classification scheme recently suggested in Kewley et al. (2006), we classified the 80 ROSAT-selected Seyfert galaxies for which all the four line ratios are measured. There are totally 13 transitions, 38 Seyfert galaxies, 1 LINERs, and 28 unclassified galaxies. The unclassified galaxies means they are differently classified in the three diagrams.
Recent studies indicated that the BPT diagrams reflect not only the dominant central energy sources, but also an evolutionary sequence of AGNs. Using the large spectral database of narrow-line emission galaxies selected from the SDSS, Kewley et al. (2006) found that the properties (e.g., ) of AGN host galaxies changes with the distance from the starforming sequence. Wang et al. (2009b) recently pointed out that the traditionally classified LINERs are consist of two populations likely at different evolutionary stages, with different power sources (see also in Stasinska et al. 2008).
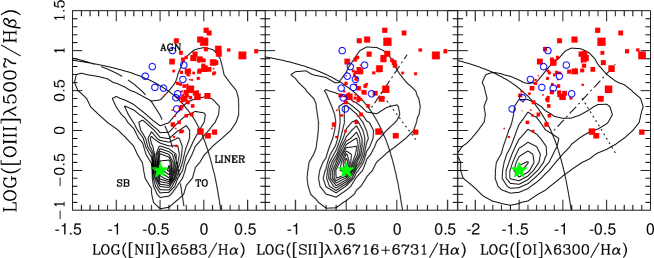
The distributions on the three traditional BPT diagrams are shown in Figure 4 and 6 for the ROSAT-selected Seyfert galaxies. In each figure, the three panels correspond to the three different methods for classifying emission-line galaxies using two pairs of line ratios. The galaxies with measured are shown by the red open squares, and the galaxies whose spectra are dominated by AGN continuum by the blue open circles. At first glance, as compared with the composite AGNs studied in Paper I, a majority of the ROSAT-selected Seyfert galaxies are located above the theoretical curves discriminating between AGNs and star-forming galaxies in all the three BPT diagrams (Kewley et al. 2001). In Figure 4, the size of each point is scaled to be proportional to the value of , if possible. All the three panels indicate a trend that the stellar populations evolve as the Seyfert galaxies deviate from the star-forming sequence, which confirms the conclusion that are drawn in Paper I and Kewley et al. (2006) by the X-ray selected broad-line AGNs. Figure 5 shows the index as a function of the distance from the starforming sequence for the ROSAT-selected Seyfert galaxies. The distance in each diagnostic diagram is measured from an empirical base point that is marked by a green star in Figure 4. All the three panels in Figure 5 show a correlation between and the defined distance555Similar correlations can be found in the case of H instead of . The corresponding Spearman rank-order correlation coefficients are -0.471, -0.490, -0.623. All the correlations are significant at a level . . From left to right, Spearman rank-ordered tests yield correlation coefficients , 0.367, and 0.482. The corresponding significance levels are derived to be 0.0006, 0.0021, and , where is the probability of null correlation.
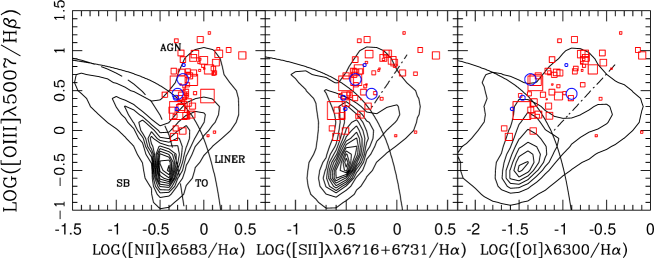
In Figure 6, we scale the size of each of the point to be proportional to the value of instead of . We can not identify a clear trends in the three panels as compared with Figure 4. Unlike the cases with , we furthermore fail to identify any significant correlation between and the defined distance. We suspect that the lack of any correlation could be probably caused by the large uncertainty of that is resulted from the relatively heavy local absorptions in soft X-ray in the partially obscured AGNs.
3.3 [O I]/H vs. and [S II]/H vs. correlations
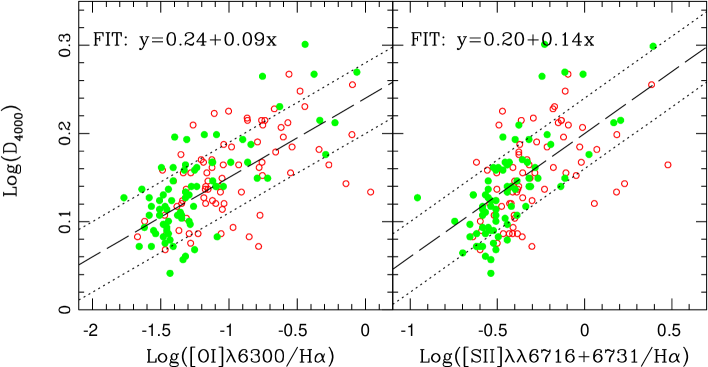
We found a tight correlation between the line ratio [O I]/H and in Paper I for the first time. Here, we re-examine the correlation by extending the sample to ROSAT-selected Seyfert galaxies (typically with older stellar populations compared with the composite AGNs, see Section 3.1). Figure 7 shows the [O I]/H vs. correlation in the left panel, along with the [S II]/H vs. correlation in the right panel. The ROSAT-selected Seyfert galaxies are shown by the red open circles, and the composite AGNs by the green solid circles. The two tight correlations between the two line ratios and can be clearly identified not only for either the ROSAT-selected Seyfert galaxies or the composite AGNs, but also for the combination of the two samples. Taking the ROSAT-selected Seyfert galaxies into account only, Spearman rank-ordered tests yield a correlation coefficient at a significance level for the [O I]/H vs. correlation, and with for the [S II]/H vs. correlation. After combining the two samples, similar tests provide better statistics with the corresponding correlation coefficients () and ()666 Similar significant correlations can be still identified for the cases with : , for [S II]/H, and , for [O I]/H.. An unweighted least-square fitting results in two calibrations:
| (1) |
and
| (2) |
with a value of standard deviation for both fittings. The best fitted calibrations are shown by the dashed lines in both panels in Figure 7. The 1 deviation is marked by the dotted lines in each panel.
3.4 sequence
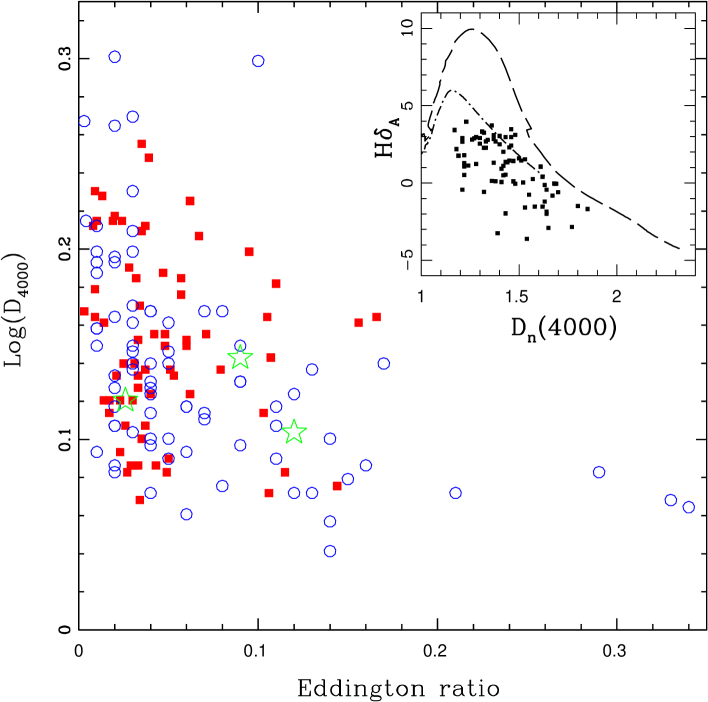
One of the aims of this third paper is to extend the sequence established in Paper I to ROSAT-selected Seyfert galaxies. is plotted against in Figure 8 by the red solid squares for the ROSAT-selected Seyfert galaxies. The composite AGNs studied in Paper I are presented by the blue open circles. The three green open stars mark the position of the three intermediate- hybrid QSOs studied recently in Wang & Wei (2009). The ROSAT-selected Seyfert galaxies follow the evolutionary sequence that was established previously in the composite AGNs. The correlation coefficient is () for the combination of the two samples, although the statistics is poor () when the ROSAT-selected Seyfert galaxies are considered only. The poor statistics is most likely caused by the relatively narrow dynamic range (see discussion below).
The insert panel in Figure 8 shows the diagram for the ROSAT-selected Seyfert galaxies. Again, we find a consistence with that reported in Paper I. The mass building in the ROSAT-selected Seyfert galaxies could be described by a continuous star formation history with an exponentially declining star formation rate.
4 Discussion
4.1 Evolutionary significance of ?
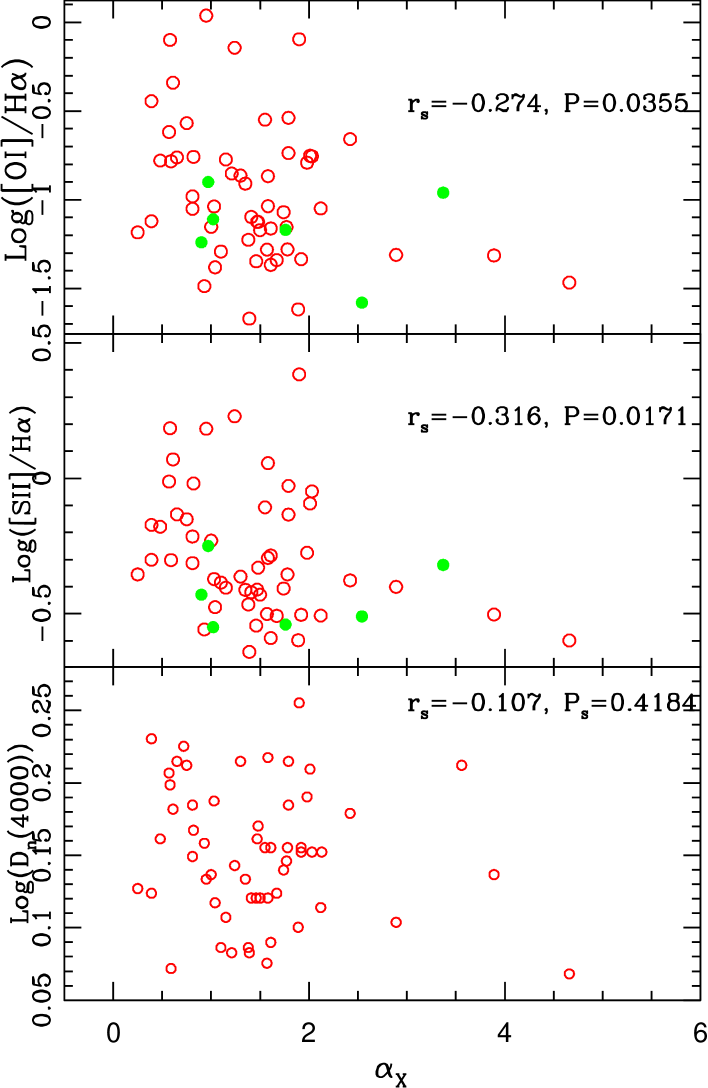
The sample of the ROSAT-selected Seyfert galaxies allows us to examine the evolutionary significance of the properties of soft X-ray emission of AGNs. We directly plot the two line ratios ([O I]/H and [S II]/H) and as a function of in Figure 9. The top and middle panels show two marginal anti-correlations between the two line ratios and . According to the Spearman rank-ordered tests, the correlation coefficients are with for [O I]/H vs. , and with for [S II]/H vs. . We argue that these dependencies agree with the theoretical photoionization models. The photoionization calculations in Kewley et al (2006) suggested that a hard ionizing field with a power-law index is required to produce the strong [O I] line emission (). This scenario seems to be plausible since various high energy instruments have observed hard X-ray spectra in dozens of LINERs that are typical of high [O I]/H ratios and old stellar populations (e.g., Flohic et al. 2006; Gliozzi et al. 2008; Rinn et al. 2005).
Given the strong correlation between the two line ratios and , is expected to be related with . However, no correlation can be identified between and in the current sample from the bottom panel in Figure 9 ()777The Spearman correlation coefficient for the correlation between and H is .. The non-detection of the expected correlation might be caused by the uncertainties of both parameters. At first, we ignore the local soft X-ray absorption in our estimation of . Secondly, the measurements of is model dependent, and highly depends on the sing-to-noise ratios of the spectra at the blue end. By contrast, the two line ratios can be accurately determined from the observed spectra.
In summary, we fail to find direct evidence supporting the evolutionary significance of from the sample the of ROSAT-selected Seyfert galaxies, albeit the evolutionary significance could be indirectly supported by the combination of the strong [O I]/H ([S II]/H) vs. correlation and identified marginal dependence of [O I]/H ([S II]/H) on : AGNs with soft X-ray spectrum might evolve to ones with hard X-ray spectrum as the circumnuclear stellar population continually ages.
4.2 vs.
Although the physical origin of the soft excess is still uncertain (e.g., Walter & Fink 1993; Kawaguchi et al. 2001; Schurch & Done 2007; Turner & Miller 2009 for a review), it was known for a long time that there is a strong dependence between soft X-ray emission and optical spectroscopic properties (and also ). Brandt et al. (1997) found a strong anti-correlation between the photon index (, i.e., ) in soft X-ray regime and FWHM of AGN broad H emission line (see also in Leighly 1999; Reeves & Turner 2000). Direct correlation analysis and PCA analysis indicated that is related with the optical spectroscopic properties (e.g., [O III] emission and ) that define the EI space (e.g., Grupe 2004; Xu et al. 2003; Laor et al. 1997; Vaughan et al. 1999). Briefly, larger the , stronger the Fe II blends and [O III] emission.
As suggested early in Pounds et al. (1995), a high state tends to produce a steep soft X-ray spectrum. Thanks to the great progress made in the reverberation mapping technique (e.g., Kaspi et al 2000, 2005; Peterson & Bentze 2006), Boroson (2002) indicated the EI space is mainly physically derived by . With these progress in estimation, Grupe (2004) subsequently found a direct correlation between and in a sample of ROSAT soft X-ray selected type I AGNs. This correlation was recently confirmed in Desroches et al. (2009) for the AGNs with intermediate .
We fail to identify a correlation between and () in the current sample, however. In fact, this is not a surprising result taking into account that both parameters are of relatively large uncertainties. In addition to the large uncertainties in the estimation of (see discussion above), the estimation of is still affected by the orientation effect of AGN. Paper I stated that the upper limit of the underestimate of is due to both intrinsic extinction in BLR and torus obscuration. In fact, Grupe (2004) found a direct correlation between and in a sample of ROSAT soft X-ray selected type I AGNs whose spectra are predominated by the AGN emission, which was recently confirmed in Desroches et al. (2009) for AGNs with intermediate . To avoid the strong absorption in soft X-ray band, we need to extend our future study into hard X-ray (2keV) regime. At present, the relationship between hard X-ray photon index and is still a controversial issue (e.g., Shemmer et al. 2008; Constantin et al. 2009). Current available hard X-ray surveys seem to be strongly biased towards bright type I AGNs due to their limited sensitivity (e.g., Wang et al. 2009a). A deep, well defined hard X-ray survey is therefore necessary in the future for establishing a better understanding of the evolutionary significance of high energy emission of AGNs.
4.3 sequence
There are accumulating observational evidence supporting that plays an important role in the evolution of AGNs. By combining the current sample with the composite AGNs studied in Paper I, we reinforce the sequence in which and age of stellar population are estimated directly from the H broad emission lines and starlight components, respectively. Similar relationships were found by other authors who used as a proxy of (e.g., Kewley et al. 2006; Wild et al. 2007; Kauffmann et al. 2007). Chen et al. (2009) found a tight correlation between and specific star formation rate obtained through modeling the continuum and absorption lines by the single stellar population models. Watabe et al. (2008) evaluated circumnuclear starburst luminosity in AGNs by the near-infrared polycyclic aromatic hydrocarbon (PAH) emission, which establishes a close correlation between the circumnuclear star formation rate and .
The ROSAT-selected Seyfert galaxies studied here are clustered at the middle range of the sequence, which is likely caused by a selection effect due to the sensitivity limit of RASS . The sensitivity limit therefore leads us to miss some X-ray less-luminous AGNs. On the one hand, the less-luminous X-ray emission is intrinsic in some AGNs that are typically associated with relatively old stellar populations and with low (e.g., Shemmer et al. 2008; Panessa et al. 2006; Hickox et al. 2009). On the other hand, there is accumulating evidence that AGNs with both young stellar populations and high tend to be heavily obscured by the plentiful surrounding gas at the beginning of their lives. The gas is required to not only fuel the central AGN activity, but also form circumnuclear stars rapidly. The heavy obscuration causes the AGNs are faint in X-ray and optical bands, but typically luminous in infrared (e.g., Sanders & Mirabel 1996). Numerical simulations of merger of two gas rich galaxies including SMBH indicated that the central AGN activities are likely obscured heavily by the surrounding gas for most time of the starburst (e.g., Di Matteo et al. 2005; Springel et al. 2005; Hopkins et al. 2005). Mao et al. (2009) recently identified three H II-buried Seyfert galaxies from the SDSS MPA/JHU DR4 catalog by analyzing their optical spectral properties. Despite the broad Balmer emission lines, the narrow emission lines of the three Seyfert galaxies are found to be mainly ionized by the power from hot stars. Daddi et al. (2007) studied the X-ray spectral properties of X-ray undetected IR luminous galaxies at using the X-ray stacking analysis. The complex X-ray analysis suggested that there are heavily obscured AGNs in these galaxies with intensive star formation activities.
In fact, soft X-ray survey is an efficient way to select narrow-line Seyfert galaxies (NLS1s) that are characterized by high , small , and the steepest X-ray spectra (e.g., Boroson & Green 1992; Boroson 2002; Sulentic et al. 2000; Boller et al. 1996; Brandt et al. 1997). Mathur (2000) argued that NLS1s might be young AGNs that are in the growth phase of their central SMBH (see also in e.g., Mathur et al. 2001; Grupe & Mathur 2004). Recent studies found that post-starburst stellar populations are frequently identified in NLS1s (e.g., Wang & Wei 2006; Zhou et al. 2005). In addition to the young stellar populations, Sani et al. (2009) recently pointed out that NLS1s are associated with higher ongoing star formation activities (using 6.2m PAH emission as a tracer) as compared with typical broad-line AGNs.
Comparing the sequence defined by the ROSAT-selected AGNs with that defined by the optically selected AGNs implies that AGNs with strong X-ray emission represent a population at a particular evolutionary stage (see also in Hickox et al. 2009). The central SMBH is required to be active at the stage to produce amount of high energy emission. Meanwhile, in order to detect the X-ray emission, the central activity can not be heavily obscured by the surrounding bugle star formation. The similar evolutionary scenario was recently proposed in Hickox et al. (2009) through a comprehensive comparison between radio-, X-ray-, and IR-selected AGNs. Compared to the radio-selected AGNs with extreme low , the X-ray-selected AGNs have higher . Although we can not exclude selection effects totally, Wang et al. (2009a) indicated that the RXTE/INTEGRAL hard X-ray selected AGNs have a narrow distribution of , and low column densities (). Moreover, the Galex/SDSS NUV-optical color-magnitude diagram shows that the distribution of X-ray-selected AGNs prefer to distribute in the “green valley” located between the red sequence and the blue cloud (e.g., Shawinski et al. 2009; Hickox et al. 2009; Treister et al. 2009).
5 Summary
As the third paper of the series, we examine the coevolutionary issue of AGNs and their host galaxies by extending the studies in Paper I into ROSAT-selected Seyfert 1.8/1.9 galaxies. These galaxies are selected from the ROSAT All Sky Survey/SDSS DR5 catalog that was originally done by Anderson et al. (2007). Using the similar analysis method adopted in Paper I allows us to draw following two main conclusions.
-
•
Two tight correlations, [O I]/H vs. and [S II]/H vs. , are firmly established not only in the ROSAT-selected Seyfert galaxies, but also in the combination of the current soft X-ray sample with the composite AGNs studied in Paper I. The ROSAT-selected Seyfert galaxies show that the two line ratios depend on the soft X-ray spectra slopes estimated from the hardness ratios.
-
•
The ROSAT-selected Seyfert galaxies are well consistent with the sequence established in the composite AGNs studied in Paper I. The ROSAT-selected galaxies are, however, not uniformly distributed along the sequence. They are clustered at the middle range of the sequence, which could be explained by an observational bias. Because of the X-ray count rate threshold of RASS, the sample is biased against not only the objects with heave absorptions (at the end with high and young stellar population), but also the ones with intrinsic low high energy emission (at the end with low and old stellar population).
References
- Anderson et al. (2007) Anderson, S. F., Margon, B., Voges, W., et al. 2007, AJ, 133, 313
- Antonucci (1993) Antonucci, R. R. J. 1993, ARA&A, 31, 473
- Asari et al. (2007) Asari, N. V., et al. 2007, MNRAS, 381, 263
- Baldwin et al. (1981) Baldwin, J. A., Phillips, M. M., & Terlevich, R. 1981, PASP, 93, 5
- Bentz et al. (2009) Bentz, M. C., Peterson, B. M., Netzer, H., et al. 2009, ApJ, 697, 160
- Bohlin et al. (1978) Bohlin, R. C., Savage, B. D., & Drake, J. F. 1978, ApJ, 224, 132
- Boller et al. (1996) Boller, T., Brandt, W. N., & Fink, H. 1996, A&A, 305, 53
- (8) Boroson, T. A. 2002, ApJ, 565, 78
- Boroson & Green (1992) Boroson, T. A., & Green, R. F. 1992, ApJS, 80, 109
- Brandt et al. (1997) Brandt, W. N., Mathur, S., Reynolds, C. S., et al. 1997, MNRAS, 292, 407
- Brinkmann & Seibert (1994) Brinkmann, W., & Siebert, J. 1994, A&A, 285, 812
- Bromley et al. (1998) Bromley, B. C., et al. 1998, ApJ, 505, 25
- Bruzal & Charlot (2003) Bruzal. G., & Charlot. S. 2003, MNRAS, 344, 1000
- Canalizo & Stockton (2001) Canalizo, G. & Stockton, A. 2001, AJ, 555, 719
- Canolizo et al. (2007) Canalizo, G., Bennert, N., Jungwiert, B., et al. 2007, ApJ, 669, 801
- Cardelli et al. (1989) Cardelli, J. A., Clayton, G. C., & Mathis, J. S. 1989, ApJ, 345, 245
- Chen et al. (2009) Chen, Y. M., Wild, V., Kauffmann, G., et al. 2009, MNRAS, 393, 406
- Cid Fernandes et al. (2001) Cid Fernandes, R., Heckman, T., Schmitt, H., et al. 2001, ApJ, 588, 81
- Cid Fernandes et al. (2005) Cid Fernandes, R., Gonzalez Delgado, R. M., Storchi-Bergmann, T., et al. 2005, MNRAS, 356, 270
- Constantin et al. (2009) Constantin, A., Green, P., Aldcroft, T., et al. 2009, ApJ, 705, 1336
- Daddi et al. (2007) Daddi, E., et al. 2007, ApJ, 670, 173
- Davies et al. (2007) Davies, R., Mueller Sanchez, F., Genzel, R., Tacconi, L., Hicks, E., Friedrich, S., & Sternberg, A. 2007, ApJ, 671, 1388
- Desroches et al. (2009) Desroches, L., Greene, J, E., & Ho, L. C. 2009, ApJ, 698, 1515
- Di Matteo e tal. (2005) Di Matteo, T., Springel, V., & Hernquist, L. 2005, Nature, 433, 604
- Elitzur (2007) Elitzur, M. 2007, ASPC, 373, 415
- Ferrarese & Merritt (2000) Ferrarese, L., & Merritt, D. 2000, ApJ, 539, 9
- Flohic et al., (2006) Flohic, H. M. L. G., et al. 2006, ApJ, 647, 140
- Garcet et al. (2007) Garcet, O., et al. 2007, A&A, 474, 473
- Glazebrook et al. (1998) Glazebrook, K., Offer, A., R., & Deeley, K. 1998, ApJ, 492, 98
- Gliozzi et al. (2008) Gliozzi, M., et al. 2008, A&A, 478, 723
- Gonzalez Delgado (2002) Gonzalez Delgado, R. 2002, ASPC, 258, 101
- Granato et al. (2004) Granato, G. L., et al. 2004, ApJ, 600, 580
- Greene & Ho (2005) Greene, J. E., & Ho, L. C. 2005, ApJ, 630, 122
- Greene & Ho (2006) Greene, J. E., & Ho, L. C. 2006, ApJ, 641, L21
- Greene & Ho (2007) Greene, J. E., & Ho, L. C. 2007, ApJ, 670, 92
- Greene et al. (2008) Greene, J. E., Ho, L. C., & Barth, A. J. 2008, ApJ, 688, 159
- Groves et al. (2006) Groves, B., Kewley, L., Kauffmann, G., et al. 2006, NewAR, 50, 743
- Grupe (2004) Grupe, D. 2004, AJ, 127, 1799
- Grupe et al. (1998) Grupe, D., Beuermann, K., Thomas, H.-C., et al. 1998, A&A, 330, 25
- Grupe & Mathur (2004) Grupe, D., & Mathur, S. 2004, ApJ, 606, 41
- Haring & Rix (2004) Haring, N., & Rix, H. 2004, ApJ, 604, 89
- Hasinger et al. (2005) Hasinger, G., Miyaji, T., & Schmidt, M. 2005, A&A, 441, 417
- Heckman et al. (2004) Heckman, T. M., Kauffmann, G., Brinchmann, J., et al. 2004. ApJ, 613, 109
- Heckman & Kauffman (2006) Heckman, T. M., & Kauffmann, G. 2006, NewAR, 50, 677
- Hickox et al. (2009) Hickox, R. C., Jones, C., Forman, W. R., et al. 2009, ApJ, 696, 891
- Hopkins et al. (2005) Hopkins, P. F., Hernquist, L., Cox, T. J., et al. 2005, ApJ, 630, 705
- Hopkins et al. (2007) Hopkins, P. F., Bundy, K., Hernquist, L., et al. 2007, ApJ, 659, 976
- Izotov & Thuan (2008) Izotov, Y. I., & Thuan, T. X. 2008, ApJ, 687, 1331
- Izotov et al. (2007) Izotov, Y. I., Thuan, T. X., & Guseva, N. G. 2007, ApJ, 671, 1297
- Kaspi et al. (2005) Kaspi, S., Maoz, D., Netzer, H., Peterson, B. M., Vestergaard, M., & Jannuzi, B. T. 2005, ApJ, 629, 61
- Kaspi et al. (2000) Kaspi, S., Smith, P. S., Netzer, H., Maoz, D., Jannuzi, B. T., & Giveon, U. 2000, ApJ, 533, 631
- Kauffmann et al. (2007) Kauffmann, G., Heckman, T. M., Budavári, T., et al. 2007, ApJS, 173, 357
- (53) Kauffmann, G., Heckman, T. M., Tremonti, C., et al. 2003a, MNRAS, 346, 1055
- Kawaguchi et al. (2001) Kawaguchi, T., Shimura, T., & Mineshige, S. 2001, ApJ, 546, 966
- Kewley et al. (2001) Kewley, L. J., et al. 2001, ApJ, 556, 121
- Kewley et al. (2006) Kewley, L. J., Groves, B., Kauffmann, G., & Heckman, T. 2006, MNRAS, 372, 961
- Kollatschny et al. (2008) Kollatschny, W., Kotulla, R., Pietsch, W., et al. 2008, A&A, 484, 897
- (58) Kriss, G. 1996, Adass, 3, 437
- Laor et al. (1997) Laor, A., Fiore, F., Elvis, M., et al. 1997, ApJ, 477, 93
- Leighly (1999) Leighly, K. M. 1999, ApJS, 125, 317
- Li et al. (2008) Li, C., Kauffmann, G., Heckman, T. M., et al. 2008, MNRAS, 385, 1915
- Magorrian et al. (1998) Magorrian, J., et al. 1998, AJ, 115, 2285
- Mahoney et al. (2009) Mahoney, E. K., Croom, S. M., Boyle, B. J., et al. 2009, astro-ph/arXiv:0909.3677, MNRAS, submitted
- Mao et al. (2009) Mao, Y. F., Wang, J., & Wei, J. Y. 2009, ApJ, 698, 859
- Mathur (2000) Mathur, S. 2000, MNRAS, 314, L17
- Mathur et al. (2001) Mathur, S., Kuraszkiewicz, J., & Czerny, B. 2001, NewA, 6, 321
- Morrison & McCammon (1983) Morrison, R., & McCammon, D. 1983, ApJ, 270, 119
- Nandra et al. (2005) Nandra, K., Laird, E. S., & Steidel, C. C. 2005, MNRAS, 360, L39
- Obric et al. (2006) Obric, M., et al. 2006, MNRAS, 370, 1677
- Panessa et al. (2006) Panessa, F., Bassani, L., Cappi, M., et al. 2006, A&A, 445, 173
- Parejko et al. (2008) Parejko, J. K., Constantin, A., Vogeley, M., et al. 2008, ApJ, 135, 10
- Perterson & Bentz (2006) Peterson, B. M., & Bentz, M. C. 2006, NewAR, 50 796
- Pounds etal. (1995) Pounds, K. A., Done, C., & Osborne, J. P. 1995, MNRAS, 277, L5
- Reeves & Turner (2000) Reeves, J. N., & Turner, M. J. L. 2000, MNRAS, 316, 234
- Reichard et al. (2008) Reichard, T. A., Heckman, T. M., Rudnick, G., et al. 2008, ApJ, 691, 1005
- Rinn et al. (2005) Rinn, A. S., Sambruna, R. M., & Gliozzi, M. 2005, ApJ, 621, 167
- Riffel et al. (2008) Riffel, R., Pastoriza, M. G., Rodriguez-Ardila, A., et al. 2008, MNRAS, 388, 803
- Sanders & Mirabel (1996) Sanders, D. B., & Mirabel, I. F. 1996, ARA&A, 34, 749
- Sani et al. (2009) Sani, E., Lutz, D., Risaliti, G., et al. 2009, astro-ph/arXiv:0908.0280
- Schartel et al. (1996) Schartel, N., Green, P. J., Anderson, S. F., et al. 1996, MNRAS, 283, 1015
- Schawinski et al. (2009) Schawinski, K., Virani, S., Simmons, B., et al. 2009, ApJ, 629, 19
- Schlegel et al. (1988) Schlegel, D., Finkbeiner, D. P., Davis, M. 1998, ApJ, 500, 525
- Shankar et al. (2009) Shankar, F., Bernardi, M., & Haiman, Z. 2009, ApJS, 694, 867
- Shemmer et al. (2008) Shemmer, O., Brandt, W. N., Netzer, H., et al. 2008, ApJ, 682, 81
- Silverman et al. (2005) Silverman, J. D., et al. 2005, ApJ, 618, 123
- Silverman et al. (2008) Silverman, J. D., Green, P. J., Barkhouse, W. A., et al. 2008, ApJS, 679, 118
- Silverman et al. (2009) Silverman, J. D., Lamareille, F., Maier, C., et al. 2009, ApJ, 696, 396
- Schurch & Done (2007) Schurch, N. J., & Done, C. 2007, MNRAS, 381, 1413
- Spergel et al. (2003) Spergel, D. N. 2003, ApJS, 148, 175
- Springel et al. (2005) Springel, V., White, S. D. M., Jenkins, A., et al. 2005, Nature, 435, 629
- Stasinska et al. (2008) Stasinska, G., Vale Asari, N., Cid Fernandes, R., et al. 2008, MNRAS, 391, L29
- Stocke et al. (1991) Stocke, J. T., Morris, S. L., Gioia, I. M., et al. 1991, ApJS, 76, 813
- Stockton et al. (2007) Stockton, A., Canalizo, G., Fu, H., et al. 2007, ApJ, 659, 195
- Sulentic et al. (2000) Sulentic, J. W., Marziani, P., & Dultzin-Hacyan, D. 2000, ARA&A, 38, 521
- Treister et al. (2009) Treister, E., et al. 2009, ApJ, 693, 1713
- Tremaine et al. (2002) Tremaine, S., Gebhardt, K., Bender, R., et al. 2002, ApJ, 574, 740
- Turner & Millier (2009) Turner, T. J. & Miller, L. 2009, A&ARv, 17, 37
- Vaughan et al. (1999) Vaughan, S., Reeves, J., Warwick, R., et al. 1999, MNRAS, 309, 113
- (99) Veilleux, S., & Osterbrock, D. E. 1987, ApJS, 63, 259
- Voges et al. (1999) Voges, W., et al. 1999, A&A, 349, 389
- Walter & Fink (1993) Walter, R., & Fink, H. H. 1993, A&A, 274, 105
- Wang et al. (1996) Wang, T., Brinkmann, W., & Bergeron, J. 1996, A&A, 309, 81
- Wang et al. (2006) Wang, J., Wei, J. Y., & He, X. T. 2006, ApJ, 638, 106
- Wang & Wei (2006) Wang, J., & Wei, J. Y. 2006, ApJ, 648, 158
- Wang & Wei (2008) Wang, J., & Wei, J. Y. 2008, ApJ, 679, 86
- Wang & Wei (2009) Wang, J., & Wei, J. Y. 2009, ApJ, 696, 741
- (107) Wang, J., Mao, Y. F., & Wei, J. Y. 2009, AJ, 137, 3388
- (108) Wang, J., Wei, J. Y., & Xiao, P. F. 2009b, ApJ, 693, 66
- Watabe et al. (2008) Watabe, Y., Kawakatu, N., & Imanishi, M. 2008, ApJ, 677, 895
- Wei et al. (1999) Wei, J. Y., Xu, D. W., Dong, X. Y., et al. 1999, A&AS, 139, 575
- Wild et al. (2007) Wild, V., et al. 2007, MNRAS, 381, 543
- Xu et al. (2003) Xu, D. W., Komossa, S., Wei, J. Y., Qian, Y., & Zheng, X. Z. 2003, ApJ, 590, 73
- Yuan et al. (2008) Yuan, W., Zhou, H. Y., Komossa, S., et al. 2008, ApJ, 685, 801
- Zhou et al. (2005) Zhou, H. Y., Wang, T. G., Dong, X. B., Wang, J., & Lu, H. 2005, Mem. Soc. Astron. Italiana, 76, 93
- Zhu et al. (2009) Zhu, L., Zhang, S. N., & Tang, S. 2009, ApJ, 700, 1173
- Zuther et al. (2007) Zuther, J., et al. 2007, A&A, 466, 451


| SDSS name | z | [N II]/H | [S II]/H | [O I]/H | [O III]/H | FWHM(H) | L(H) | H | ||||
|---|---|---|---|---|---|---|---|---|---|---|---|---|
| () | Å | |||||||||||
| (1) | (2) | (3) | (4) | (5) | (6) | (7) | (8) | (9) | (10) | (11) | (12) | (13) |
| 000202.95-103038.0 | 0.103 | -0.162 | -0.501 | -1.281 | 0.685 | 2342.0 | 2.69 | 1.10 | 1.77 | 0.14 | 7.43 | 1.57 |
| 001056.25-090109.9 | 0.081 | -0.244 | -0.383 | -1.174 | 0.375 | 3092.0 | 0.39 | 1.27 | 3.10 | 0.04 | 7.30 | |
| 002848.77+145216.3 | 0.089 | -0.299 | -0.503 | -1.314 | 0.590 | 1952.2 | 0.25 | 1.27 | 1.31 | 0.08 | 6.80 | 3.89 |
| 003843.06+003451.8 | 0.043 | -0.002 | -0.048 | -0.755 | 0.878 | 1.32 | 2.03 | 2.03 | ||||
| 010629.30+151449.4 | 0.168 | -0.202 | -0.389 | -1.063 | 0.916 | 5474.1 | 1.78 | 1.27 | 0.13 | 0.02 | 8.11 | |
| 011535.54+010839.6 | 0.064 | -0.074 | -0.471 | -1.003 | 0.424 | 1.56 | -0.05 | |||||
| 015610.90+140934.2 | 0.082 | -0.183 | -0.421 | -1.097 | 0.697 | 3802.2 | 0.35 | 1.23 | 3.26 | 0.02 | 7.46 | 1.41 |
| 014911.00+130406.9 | 0.073 | 0.122 | -0.230 | -1.153 | 0.722 | 2506.1 | 0.31 | 1.27 | 2.86 | 0.05 | 7.07 | 1.00 |
| 032525.35-060837.9 | 0.034 | -0.057 | -0.302 | -0.783 | 0.852 | 2021.9 | 0.61 | 1.09 | 2.19 | 0.11 | 7.01 | 0.59 |
| 073646.65+393255.3 | 0.107 | 0.006 | -0.172 | -0.444 | 0.775 | 5112.9 | 0.18 | 1.57 | -0.59 | 0.01 | 7.60 | 0.39 |
| 080752.27+383211.0 | 0.067 | -0.242 | -0.508 | -1.340 | -0.008 | 2955.4 | 0.38 | 1.23 | 2.69 | 0.04 | 7.26 | 1.67 |
| 082209.55+470552.8 | 0.127 | 0.122 | 0.185 | -0.099 | -0.020 | 1889.2 | 0.33 | 1.46 | -1.53 | 0.10 | 6.83 | 0.58 |
| 083552.35+295716.0 | 0.076 | -0.167 | -0.413 | -1.058 | 0.636 | 3951.0 | 0.89 | 1.13 | 1.29 | 0.03 | 7.58 | |
| 084257.45+030841.4 | 0.064 | -0.344 | -0.430 | -1.171 | 0.744 | 4117.6 | 0.24 | 1.23 | -0.58 | 0.02 | 7.46 | 1.50 |
| 084919.70+531730.0 | 0.111 | -0.201 | -0.476 | -1.381 | 0.460 | 1.21 | 3.33 | 1.04 | ||||
| 085824.22+520541.1 | 0.090 | -0.201 | -1.154 | 0.185 | 1.30 | 2.50 | 1.77 | |||||
| 085922.63+100132.2 | 0.167 | 0.164 | 1.023 | 2189.5 | 0.25 | 1.55 | -0.02 | 0.06 | 6.91 | 0.72 | ||
| 092740.77+262701.0 | 0.048 | -0.224 | -0.313 | -1.051 | 0.555 | 1660.4 | 0.06 | 1.30 | 0.06 | 0.06 | 6.37 | 0.81 |
| 094149.83+611158.8 | 0.123 | -0.189 | -0.404 | -0.773 | 0.572 | 4332.3 | 0.87 | 1.19 | 1.23 | 0.03 | 7.76 | 1.15 |
| 094252.55+122443.6 | 0.130 | -1.204 | 1.021 | 3436.8 | 0.56 | 1.37 | -0.04 | 0.03 | 7.47 | |||
| 094525.90+352103.5 | 0.208 | -0.005 | -0.358 | 0.818 | 3457.6 | 1.37 | 1.12 | 2.68 | 0.05 | 7.65 | ||
| 094554.48+423818.6 | 0.075 | -0.136 | -0.401 | -1.311 | 0.634 | 1.18 | 2.90 | 2.89 | ||||
| 095623.68+564806.3 | 0.075 | -0.176 | -0.377 | -1.352 | 0.530 | 1510.5 | 0.03 | 1.39 | 1.59 | 0.06 | 6.17 | |
| 100151.40+490859.8 | 0.071 | -0.265 | -0.432 | -1.457 | 0.360 | 2706.4 | 0.11 | 1.13 | 0.52 | 0.03 | 6.93 | |
| 100634.28+315900.4 | 0.093 | -0.100 | -0.215 | -0.981 | 0.467 | 1642.2 | 0.05 | 1.41 | 1.53 | 0.06 | 6.32 | 0.81 |
| 100710.35+113146.1 | 0.082 | -0.207 | -0.544 | -1.347 | 0.188 | 4844.6 | 0.37 | 1.22 | 2.29 | 0.01 | 7.69 | 1.46 |
| 100958.85+470943.9 | 0.106 | 0.283 | 0.229 | -0.143 | 1.010 | 1872.5 | 0.42 | 1.29 | -3.25 | 0.11 | 6.87 | 1.24 |
| 101234.42+062014.9 | 0.079 | -0.048 | -0.179 | -0.779 | 0.753 | 5969.9 | 1.01 | 1.35 | 1.46 | 0.01 | 8.08 | 0.48 |
| 101248.93+555918.5 | 0.126 | 0.104 | -1.108 | 0.853 | 1.55 | -0.81 | ||||||
| 101454.23+003420.6 | 0.086 | 0.170 | -0.093 | -0.752 | 0.960 | 1.50 | -1.52 | 2.01 | ||||
| 101846.09+345001.6 | 0.035 | -0.266 | -0.301 | -1.121 | 0.577 | 1674.8 | 0.06 | 1.24 | 2.28 | 0.06 | 6.40 | 0.39 |
| 101942.53+372828.2 | 0.094 | -0.341 | -0.598 | -1.618 | -0.080 | 2882.2 | 0.24 | 1.17 | 2.81 | 0.04 | 7.15 | 1.89 |
| 102039.81+642435.8 | 0.122 | -0.101 | -0.275 | -0.791 | 0.957 | 3303.5 | 0.28 | 1.44 | -0.76 | 0.03 | 7.30 | 1.98 |
| 103250.04+545656.8 | 0.119 | -0.205 | -0.330 | -1.125 | 0.480 | 1.37 | 3.12 | 1.48 | ||||
| 103519.76+312843.0 | 0.075 | 0.041 | 0.433 | 2208.6 | 0.07 | 1.51 | -1.20 | 0.04 | 6.67 | 3.56 | ||
| 104500.41-001554.0 | 0.091 | -0.262 | -0.107 | -0.549 | 0.972 | 2306.6 | 0.45 | 1.33 | -1.96 | 0.07 | 7.07 | 1.55 |
| 111100.55+491942.9 | 0.232 | 0.110 | -0.852 | 0.775 | 2721.5 | 3.31 | 1.12 | -0.44 | 0.12 | 7.61 | 1.21 | |
| 111419.24+342843.6 | 0.069 | -0.116 | 0.056 | -1.036 | 0.720 | 3605.4 | 0.51 | 1.23 | 2.29 | 0.03 | 7.49 | 1.58 |
| 112852.59-032130.5 | 0.198 | -0.292 | -0.599 | -1.467 | 0.249 | 4880.4 | 3.22 | 1.08 | 3.43 | 0.03 | 8.12 | 4.66 |
| 113255.96+051539.6 | 0.101 | 0.440 | 0.384 | -0.095 | 0.941 | 2463.8 | 0.11 | 1.67 | -1.49 | 0.04 | 6.85 | 1.9 |
| 115906.90+101001.7 | 0.116 | -0.322 | -0.641 | -1.670 | 0.025 | 4078.9 | 0.73 | 1.12 | 2.91 | 0.03 | 7.67 | 1.39 |
| 121600.04+124114.3 | 0.066 | -0.243 | -0.507 | -1.049 | 0.432 | 4690.2 | 0.46 | 1.20 | 2.91 | 0.02 | 7.71 | 2.12 |
| 122131.04+000512.8 | 0.107 | -0.446 | -0.466 | -1.226 | 0.447 | 3531.9 | 0.58 | 1.13 | 1.80 | 0.03 | 7.50 | 1.38 |
| 122602.46+004640.0 | 0.083 | -0.233 | -0.410 | -0.970 | 0.447 | 3322.9 | 0.18 | 1.15 | 1.12 | 0.02 | 7.21 | |
| 123155.13+323240.2 | 0.065 | -0.278 | -0.412 | -0.909 | 0.404 | 2654.3 | 0.14 | 1.26 | 3.73 | 0.03 | 6.97 | 1.35 |
| 123942.53+342456.3 | 0.098 | -0.141 | -0.355 | -1.280 | 0.200 | 2827.8 | 0.34 | 1.32 | 1.37 | 0.04 | 7.20 | 1.78 |
| 124307.02+421231.0 | 0.072 | -0.254 | -0.407 | -1.070 | 0.728 | 2553.5 | 0.10 | 1.28 | 0.12 | 0.03 | 6.87 | 1.74 |
| 125055.53-021345.4 | 0.086 | -0.078 | -0.318 | -1.042 | 0.475 | 4524.9 | 0.10 | 1.36 | 2.42 | 0.01 | 7.37 | |
| 131235.16+494224.6 | 0.129 | 0.025 | -0.121 | -0.602 | 1.257 | 1.46 | 0.26 | |||||
| 132047.79+320720.4 | 0.071 | -0.282 | -0.401 | -1.406 | 0.101 | 1.30 | 3.04 | |||||
| 132201.77-001814.4 | 0.075 | -0.182 | -0.363 | -0.864 | 0.740 | 3003.4 | 0.13 | 1.52 | -1.86 | 0.02 | 7.05 | 1.30 |
| 134243.62+050432.2 | 0.136 | 0.137 | -0.028 | -0.538 | 0.850 | 2979.3 | 0.24 | 1.41 | -1.58 | 0.03 | 7.17 | 1.79 |
| 134419.60+512624.6 | 0.063 | -0.121 | -0.134 | -0.737 | 0.909 | 5537.1 | 0.31 | 1.52 | -0.43 | 0.01 | 7.78 | 1.79 |
| 135244.63-001526.2 | 0.124 | 0.059 | -0.377 | -0.658 | 0.767 | 6331.4 | 0.46 | 1.40 | 1.46 | 0.01 | 7.98 | 2.42 |
| 140844.49+535128.4 | 0.083 | -0.255 | 0.296 | 1857.0 | 0.10 | 1.31 | 1.11 | 0.06 | 6.58 | 1.92 | ||
| 141231.64+435536.1 | 0.094 | -0.252 | -0.519 | -1.471 | 0.490 | 2604.6 | 0.17 | 1.18 | 2.97 | 0.04 | 6.99 | |
| 141611.95+631128.0 | 0.077 | -0.364 | -0.491 | -1.263 | 0.864 | 3564.7 | 0.71 | 1.50 | 0.41 | 0.04 | 7.55 | |
| 143937.48+514045.9 | 0.078 | -0.194 | -0.558 | -1.487 | 0.439 | 1.34 | 1.34 | 0.93 | ||||
| 144242.62+011911.0 | 0.034 | -0.041 | -0.181 | -0.668 | -0.014 | 2736.6 | 0.02 | 1.56 | -0.05 | 0.01 | 6.57 | |
| 144248.94+550910.7 | 0.107 | 0.002 | -0.095 | -0.560 | 1.113 | 1.71 | -1.68 | |||||
| 144750.45+051752.0 | 0.086 | -0.041 | -0.294 | -0.867 | 1.139 | 4232.6 | 0.43 | 1.53 | -2.90 | 0.02 | 7.60 | 1.58 |
| 144921.57+631613.9 | 0.042 | 0.597 | 0.478 | -0.268 | 0.994 | 1607.6 | 0.19 | 1.35 | 3.48 | 0.11 | 6.57 | |
| 150801.34+462200.6 | 0.094 | -0.314 | -0.372 | -1.038 | 1.125 | 2807.3 | 0.43 | 1.43 | -3.61 | 0.05 | 7.23 | 1.03 |
| 151640.21+001501.8 | 0.052 | 0.112 | 0.183 | 0.038 | 0.712 | 2274.9 | 0.20 | 1.26 | -2.38 | 0.05 | 6.90 | 0.95 |
| 152158.52+540151.5 | 0.056 | -0.243 | -0.355 | -1.184 | 0.390 | 2239.4 | 0.06 | 1.25 | 2.80 | 0.03 | 6.64 | 0.25 |
| 153015.55+531035.1 | 0.174 | -0.364 | -0.590 | -1.367 | 0.255 | 3789.0 | 2.34 | 1.14 | 3.97 | 0.05 | 7.84 | 1.61 |
| 153446.62+423536.8 | 0.073 | -0.329 | -0.385 | -1.292 | 0.178 | 2764.5 | 0.33 | 1.13 | 1.08 | 0.04 | 7.17 | 1.1 |
| 153822.79+551618.8 | 0.165 | -0.053 | -0.929 | 0.738 | 1778.8 | 0.95 | 1.35 | 2.97 | 0.17 | 6.98 | ||
| 154724.51+001938.8 | 0.212 | -0.267 | 0.274 | 5395.3 | 4.87 | 1.32 | 0.51 | 0.03 | 8.29 | 2.13 | ||
| 162039.49+260305.0 | 0.096 | -0.129 | -0.285 | -1.162 | 0.307 | 1.32 | 2.97 | 1.61 | ||||
| 163348.87+355318.5 | 0.038 | -0.007 | -0.019 | -0.758 | 0.812 | 7155.0 | 0.06 | 1.37 | 0.11 | 0.003 | 7.69 | 0.82 |
| 164430.26+245728.3 | 0.102 | -0.238 | -0.411 | -1.124 | 0.888 | 2093.6 | 1.87 | 1.34 | 2.30 | 0.16 | 7.26 | 1.47 |
| 164520.62+424528.0 | 0.049 | -0.222 | -0.151 | -0.568 | 0.398 | 4116.1 | 0.04 | 1.51 | -0.12 | 0.01 | 7.12 | 0.75 |
| 171009.86+642256.6 | 0.256 | -0.320 | -0.193 | 2619.8 | 2.09 | 1.20 | 2.55 | 0.10 | 7.48 | |||
| 171414.70+650626.1 | 0.079 | -0.046 | -0.133 | -0.761 | 0.892 | 3881.2 | 0.26 | 1.52 | -1.99 | 0.02 | 7.42 | 0.65 |
| 171657.25+643312.9 | 0.081 | -0.353 | -0.620 | -1.187 | 0.075 | 1.37 | 1.42 | |||||
| 171811.93+563956.1 | 0.114 | 0.047 | -0.012 | -0.618 | -0.066 | 1760.2 | 0.10 | 1.5 | 1.06 | 0.07 | 6.53 | 0.57 |
| 172350.14+653404.2 | 0.170 | -0.264 | -0.015 | 2898.2 | 0.53 | 1.31 | 0.93 | 0.05 | 7.30 | |||
| 172643.83+600238.7 | 0.080 | -0.154 | -0.377 | -1.170 | 0.412 | 3085.3 | 0.15 | 1.28 | 2.70 | 0.03 | 7.12 | |
| 173207.20+542640.5 | 0.115 | -0.183 | -0.504 | -1.335 | 0.351 | 2817.9 | 0.46 | 1.33 | 0.54 | 0.05 | 7.25 | 1.92 |
| 222852.76-090452.5 | 0.070 | -0.153 | -0.111 | -0.479 | 0.516 | 3446.5 | 0.79 | 1.64 | -2.85 | 0.03 | 7.54 | |
| 230417.31-081646.3 | 0.080 | 0.061 | 0.070 | -0.340 | 1.222 | 1743.1 | 0.32 | 1.41 | 0.04 | 0.11 | 6.75 | 0.61 |
| SDSS name | z | [N II]/H | [S II]/H | [O I]/H | [O III]/H | |
|---|---|---|---|---|---|---|
| (1) | (2) | (3) | (4) | (5) | (6) | (7) |
| 113520.76+632042.5 | 0.179 | -0.36 | -0.54 | -1.17 | 1.00 | 1.76 |
| 004551.46+155547.6 | 0.115 | -0.56 | -0.43 | -1.24 | 0.54 | 0.90 |
| 011932.86+000837.2 | 0.181 | -0.24 | -0.41 | -1.37 | 0.64 | |
| 082236.85+541836.5 | 0.086 | -0.23 | -0.32 | -0.96 | 0.82 | 3.37 |
| 110157.90+101739.3 | 0.034 | -0.46 | -0.55 | -1.11 | 0.53 | 1.02 |
| 121651.75+375438.0 | 0.063 | -0.32 | -0.53 | -1.46 | 0.41 | |
| 123429.85+621806.2 | 0.135 | -0.31 | -0.51 | -1.58 | 0.27 | 2.54 |
| 142119.12+631300.1 | 0.134 | -0.67 | -0.49 | -1.04 | 0.68 | |
| 162952.88+242638.3 | 0.038 | -0.30 | -0.25 | -0.90 | 0.46 | 0.97 |
| 165601.60+211241.1 | 0.049 | -0.59 | -0.46 | -1.22 | 0.80 |