Theoretical and experimental study of ion flux formation in an asymmetric high-frequency capacitive discharge
Abstract
Parameters of a high frequency capacitive discharge in argon in axially symmetric chambers of different geometries are studied in experiments and by means of two-dimensional kinetic modeling by the Particle-in-Cell method. It is demonstrated that a change in the ratio of the areas of the driven and grounded electrodes can substantially increase the ion energy on the electrode practically without disturbing the plasma parameters. Particular attention is paid to studying the self-bias voltage and the ion distribution function on the electrode for gas pressures ranging from 15 to 70 mTorr. The results of self-consistent calculations are in good agreement with experimental data.
pacs:
52.27.Lw, 52.25.-bI Introduction
Ion fluxes in sheaths adjacent to the electrodes generated by a high-frequency discharge are widely used in various plasma technologies. Ion bombardment results in anisotropy of etching processes and affects the growth rate and the structure of films grown in the discharge. The applied voltage drop in the sheaths is substantial, and a considerable part of energy imparted to the discharge can be spent on accelerating ions.
Processes affecting the sheath formation were studied in detail by many researchers (see, e.g., (Lieberman & Lichtenberg, 1994)). The majority of theoretical and numerical works, however, are restricted to studying a one-dimensional problem, whereas real discharge geometry is usually asymmetric. In this case, the current density and, correspondingly, the drop of voltage near one electrode is greater than the corresponding values in the vicinity of the opposite electrode. Thus, there appears a constant self-bias voltage, which appreciably increases the energy of ions bombarding the electrode with the higher current density (Coburn & Kay, 1972).
The discharge is asymmetric because one of the electrode is connected to the grounded walls of the discharge chamber, and some portion of the discharge current is spent there. As such a discharge has a complicated two-dimensional geometry, the distribution of currents can be calculated only with two-dimensional numerical simulations. The use of the simple ratio of the electrode areas (sheath capacities) in analyzing the experimental data (Coburn & Kay, 1972) is based on the assumption that the structure and size of the sheaths near different surfaces are identical. This assumption is not substantiated. Moreover, the sheath thickness and the distribution of the charged particle concentrations in the sheath depends on the discharge operation mode determined, among other parameters, by the current density (Lieberman & Lichtenberg, 1994; Orlov & Smirnov, 1999). The purpose of the present work is a numerical and experimental study of the ion flux formation in a low-pressure asymmetric high-frequency capacitive (HFC) discharge.
The paper is arranged as follows. The setup used in the experiments is described in Sec. II. The kinetic model for the two-dimensional description of the HFC discharge is given in Sec. III. The plasma parameters in chambers with different geometries are compared in Sec. IV. The ion flux onto the electrode is analyzed in Sec. V. The calculated results for the self-bias voltage and plasma potential, and also the distribution function of the ion fluxfor different gas pressures are discussed in Sec. VI. The conclusions are formulated in Sec. VII.
II Experimental setup
The electric parameters of a 13.56-MHz capacitive discharge in argon were measured in the experiments performed in two chambers with different configurations of the driven electrode. The gas-discharge chambers used are schematically shown in Fig. 1.

Voltage is applied to the top electrode with an area , while the bottom electrode with an area is grounded. In chamber A (see Fig. 1(a)), the effective area of the driven electrode is substantially smaller than the grounded electrode area (), because the side surface of the discharge chamber is also subjected to a zero potential. With this ratio of the electrode areas , the discharge is visibly asymmetric at low gas pressures, and the potential drop in the sheath adjacent to the driven electrode prevails. The potential drop at the grounded electrode sheath is small and depends only weakly on the gas pressure and on the input power. This configuration does not allow the flux of high-energy ions from the discharge plasma to be studied, because the ion energy analyzer is usually mounted in the high-vacuum chamber behind the grounded electrode. Such a configuration of the driven electrode, however, allows measurements of the radial distribution of the plasma concentration and also the electron temperature by a moving Langmuir probe.
In chamber B, the driven electrode is supplemented with a cylindrical side part, which is shielded to prevent the breakdown on the side walls of the chamber (see Fig. 1(b)). In this configuration, it is only the bottom electrode surface that is grounded, and the ratio of the areas of the driven and grounded electrodes is . In chamber B, in asymmetric HFC discharge with a prevailing potential drop in the grounded electrode sheath is formed, and it is possible to study the high-energy ion flux with the use of an energy analyzer.
The gas pressure in the experiments was varied from 6 to 70 mTorr. The radius of chamber A is =15 cm, and its height is =13 cm. The discharge glows between the electrodes with a radius of 11 cm; the distance between the electrodes is =3.8 cm. The radius of chamber B =11 cm is equal to the electrode radius.
To measure the ion flux distribution function over energy, there is an orifice 0.1 cm in diameter at the center of the grounded bottom electrode; this orifice connects the discharge chamber with the diagnostic chamber located below. The diagnostic chamber is evacuated independent of discharge chamber evacuation, and the pressure in the diagnostic chamber is lower than 1 mTorr. The diagnostic chamber contains a four-grid electrostatic energy analyzer of the confining field. We used this analyzer to register the energy distribution function of the ion flux moving from the discharge plasma toward the grounded electrode.
III Kinetic model
The system of equations in a two-dimensional model of an HFC discharge with cylindrical symmetry includes the kinetic equations for electrons and ions (which are three-dimensional in terms of velocity and two-dimensional in space) and Poisson’s equation. The energy distribution function for electrons and ions are found from the Boltzmann equations
| (1) |
| (2) |
where , , , , , and are the electron and ion velocities, concentrations, and masses, respectively; and are the collisional integrals for electrons and ions.
Knowing the energy distribution functions for electrons and ions, we can calculate the mean energy of electrons and ions:
| (3) |
Poisson’s equation describes the electric potential distribution
| (4) |
The boundary conditions for Poisson’s equation are the voltage on the grounded electrode and on the driven electrode. The self-bias voltage is calculated from the condition of a zero total current onto the grounded surfaces and surfaces with applied voltage.
System (1)-(4) is solved self-consistently by the Particle-in-Cell method with sampling of collisions by the Monte Carlo method (PIC MCC) (Birdsall & Langdon, 1985). The HFC discharge operates in argon. The kinetics of electrons includes elastic scattering of electrons on atoms, excitation of metastable states, and ionization. Emission of secondary electrons from the electrodes due to bombardment by ions with the secondary emission coefficient is also considered.
IV Comparison of discharge parameters in chambers of different geometries
Let us consider the plasma parameters obtained in the experiment and in the self-consistent numerical solution of system (1)-(4). The discharge operates in chambers of different geometries (see Fig. 1) with a fixed power of 10 W, P=5, 30, and 70 mTorr, and =0.1. In chamber A, the electrode radius is =11 cm, and the chamber radius is =15 cm. In chamber B, the bottom electrode radius is =10.5 cm, and the chamber radius is =11 cm. These chambers have different ratios of the areas of the driven and grounded electrodes , because the voltage is applied only to the top electrode in chamber A () and to the top electrode and the side walls of the chamber () in chamber B. The calculated distributions of the electron concentration in the chambers is shown in Fig. 2 for mTorr.
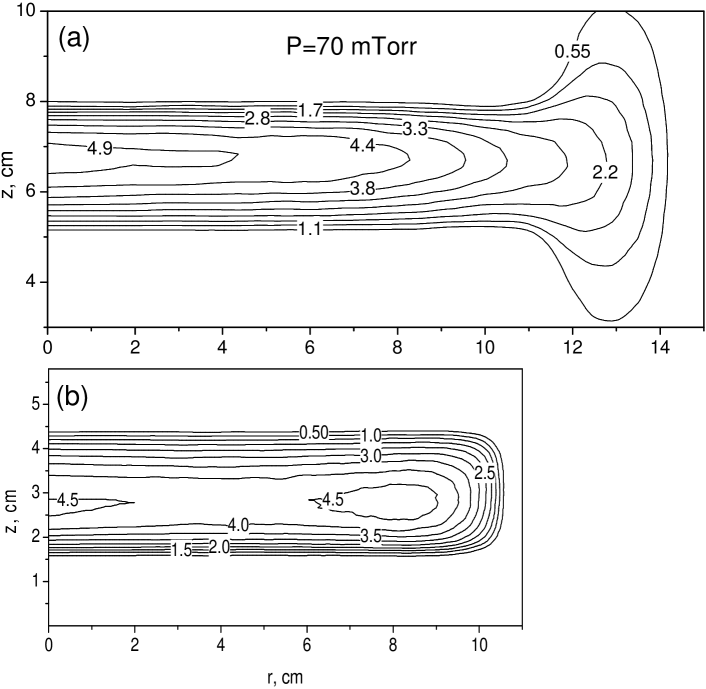
The electron concentration at the center of the discharge gap is cm-3 in chamber A and cm-3 in chamber B. In chamber A, the concentration decreases with distance from the axis of symmetry toward the side wall. In chamber B, there is a second peak of the plasma concentration near the electrode edge owing to enhanced ionization.
Figure 3 shows the distribution of the electron energy .
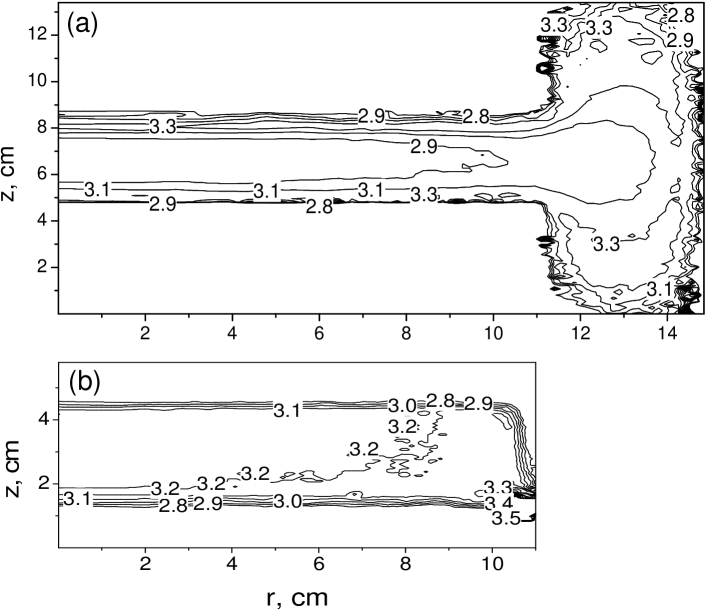
The energy of the electrons changes from 2.9 to 3.5 eV over the volume of chambers A and B. Note that the maximum energy of the electrons in chamber B is observed between the grounded bottom electrode and the side walls, which is under voltage. The ionization rate here, however, is not too high, because the gap length is smaller than the characteristic length of ionization by electrons.
The distribution of the electric potential in Fig. 4 demonstrates the appearance of the self-bias voltage induced by the difference in the areas of the driven and grounded electrodes.
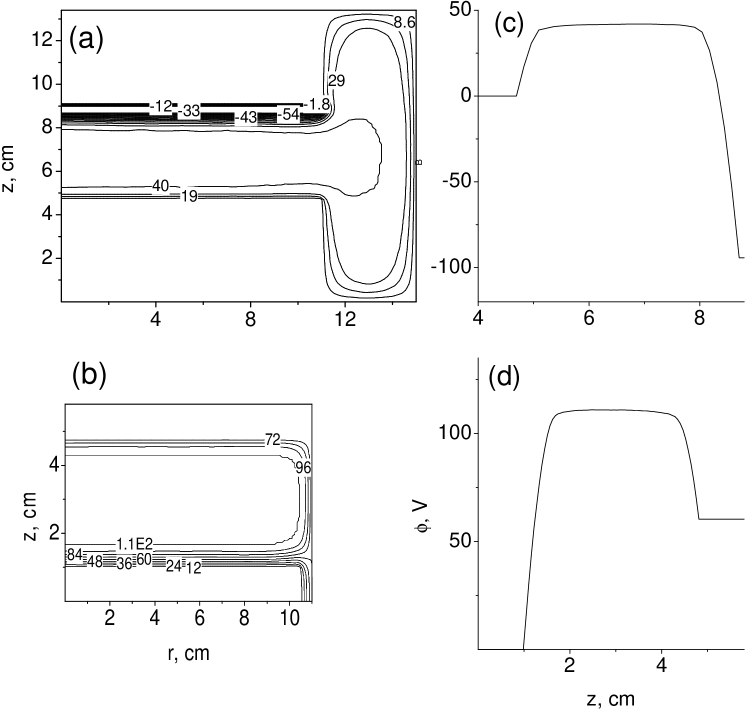
Figures 4(a),(c) show the distribution of for chamber A, where the voltage is applied to the top electrode with a smaller area; in this case, the self-bias voltage is -100 V. Figures 4(b),(d) refer to chamber B where the grounded bottom electrode has a smaller area; the potential drop here is 110 V.
Let us compare the measured and calculated radial distributions of the electron concentration and energy at the discharge gap center. Figure 5( ) shows the measured and calculated concentrations of electrons in chamber A for different gas pressures.
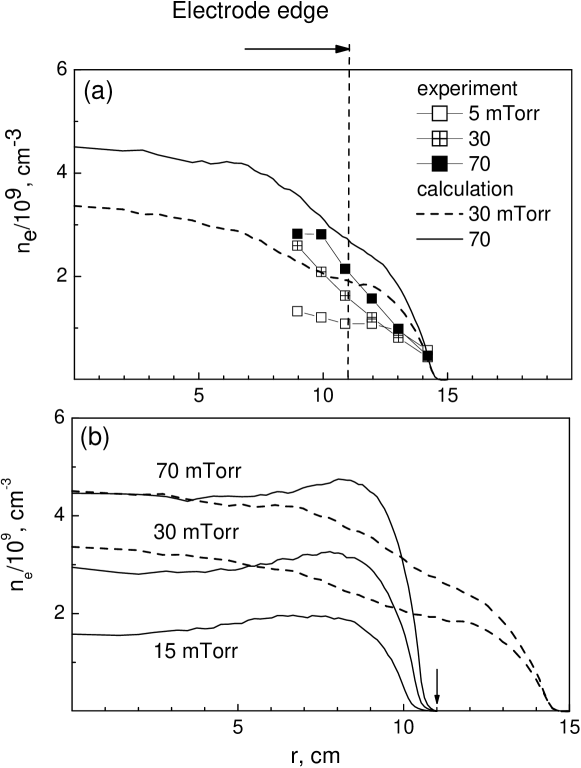
The calculated profiles of in chambers A and B are plotted in Fig. 5(b). In chamber A, which has a greater radius, the plasma concentration monotonically decreases toward the side wall. An increase in the electron concentration near the edge of the bottom electrode is observed in chamber B. As a whole, the change in the chamber geometry has a weak effect on the plasma concentration for gas pressures ranging from 15 to 70 mTorr. With increasing pressure, the plasma concentration increases in both chambers from 1.8cm-3 to 4.5cm-3.
Figure 6 shows the radial profiles of the electron temperature =2/3 at the center of the discharge gap for different gas pressures.

The mean electron temperature at mTorr, which was measured near the electrode edge, agrees well with the numerical data.
The numerical and experimental data in Figs. 5 and 6 are in good agreement and show that the discharge mode and its parameters remain almost the same in both chambers. Because of the discharge asymmetry, however, the potential drop in chamber B is substantially greater near the grounded electrode, which makes it possible to form a high-energy ion flux to the electrode and to control the distribution function of the ions.
V Ion flux to the electrode
The experiment in chamber B was aimed at measuring the maximum energy of ions on the electrode and the energy of ions corresponding to the maximum value of the ion distribution function (IDF) in terms of energy. As the value of the applied voltage cannot be accurately determined in the experiment, we varied the applied voltage in our calculations to obtain an IDF close to the experimental curve. Figure 7 shows the measured and calculated dimensionless IDFs at the center of the bottom electrode for and 30 mTorr in chamber B.

The measured and calculated plasma parameters for the variants shown in Fig. 7 are summarized in Table 1. The input power in the experiment was 14 W for mTorr and 19.2 W for mTorr.
At gas pressures of 15 and 30 mTorr, the ions experience several collisions as they cross the sheath; therefore, the ion energy corresponding to the IDF peak is . The maximum energy of the ions obtained in the experiment is =189 eV at mTorr and =191 eV at mTorr. It is seen from Fig. 7 that the experimental and calculated IDFs are in good agreement at the voltage =285 V for 15 mTorr and at =260 V for 30 mTorr. The inset in Fig. 7 shows the calculated distribution of the potential at . The self-bias voltage is =108 V for both values of the gas pressure. The maximum value of the plasma potential is =191 V for mTorr and 170 V for mTorr. The maximum ion energy is approximately equal to the averaged over 10 rf cycles plasma potential with respect to the grounded electrode, because the characteristic time of the ion crossing the sheath is much greater than the discharge period.
The distribution of the charge characterizing the sheath width near the electrodes and chamber walls is shown in Fig. 8.
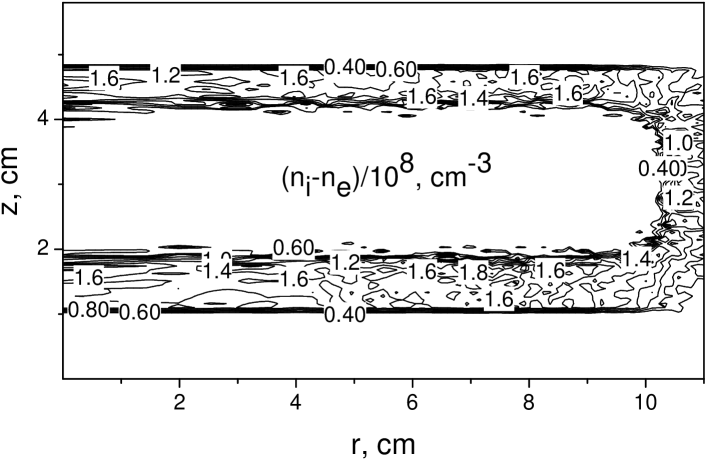
In the case considered, the sheath width is 1 cm for the grounded electrode and approximately 0.5 cm for the surface with applied voltage. At the pressure of 30 mTorr, the mean free path of ions with respect to the charge exchange collisions with neutral atoms is approximately 2 mm; therefore, the ions participate in several collisions when crossing the electrode sheath.
Let us consider the ion flux distribution along the electrode surface. Figure 9 shows the distribution of the ion flux along the surface of the bottom electrode and between the electrodes at .

The ion flux along the bottom electrode remains almost unchanged at cm and then decreases as the electrode edge is approached (see Fig. 9(a)). It is of interest to note that the ion flux onto the top electrode is little different from the ion flux onto the bottom electrode, though the ion energy on the top electrode is considerably lower.
VI Self-bias voltage for various discharge geometries
Let us consider the self-bias voltage in chambers of different geometries. Figure 10 shows the calculated plasma potential relative to the grounded electrode and the self-bias voltage as a function of the ratio of the areas of the driven and grounded electrodes .
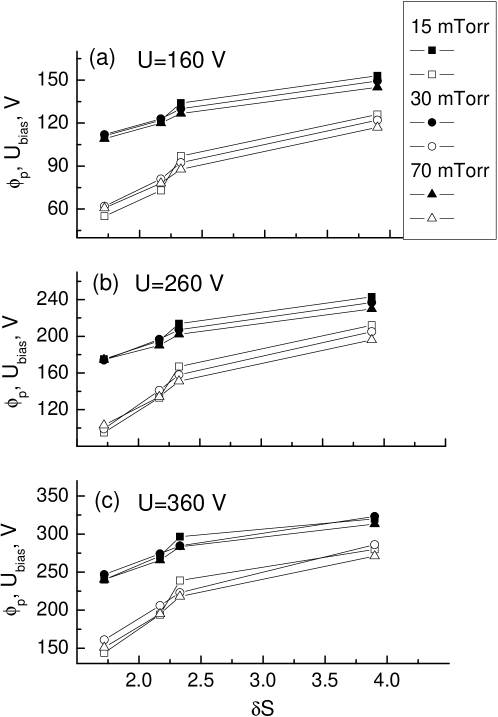
The HFC discharge was calculated for chamber B with different parameters: 1) R=11 cm, d=3.8 cm, and =1.72; 2) R=7 cm, d=3.8 cm, and =2.17; 3) R=11 cm, d=7 cm, and =2.33; 4) R=6 cm, d=8 cm, and =3.9. The bottom electrode and the chamber wall are separated by a 0.5-cm gap. It is seen in Fig. 10 that the plasma potential increases with increasing relative area of the driven electrode. In turn, increases faster with and approaches the plasma potential value at 4.6. A decrease in the gas pressure leads to an insignificant increase in the plasma potential relative to the grounded electrode and the self-bias voltage.
In our calculations, we studied the dependence of the voltage drop in the electrode sheaths on the electrode area ratio. For a symmetric discharge, the ratio of the areas of the driven and grounded electrodes is =1, and the ratio /() is also equal to unity. Using the results in Fig. 10, we obtain a scaling exponent for the expression relating the voltage drop on the electrode sheaths to the area of the electrodes in an asymmetric HFC discharge
Figure 11 shows the behavior of the exponent for different pressures and voltages.

Note that the curve for obtained by two-dimensional kinetic calculations is a nonmonotonic function, which has a maximum at =2-3: =1.7 for P=15 mTorr, =1.7 for P=30 mTorr, and varies from 1.8 to 2.1 for P=70 mTorr. The exponent calculated previously (Liebermann, 1989) with the use of a spherical model was =2.21. The value of varying from 1.6 to 2.1 was also obtained in (Schweigert, 2010) by means of kinetic calculations of an asymmetric 2-MHz capacitive discharge.
Figure 12 shows the energy distribution functions in an ion flux in chambers with different ratios of the areas of the driven and grounded electrodes .
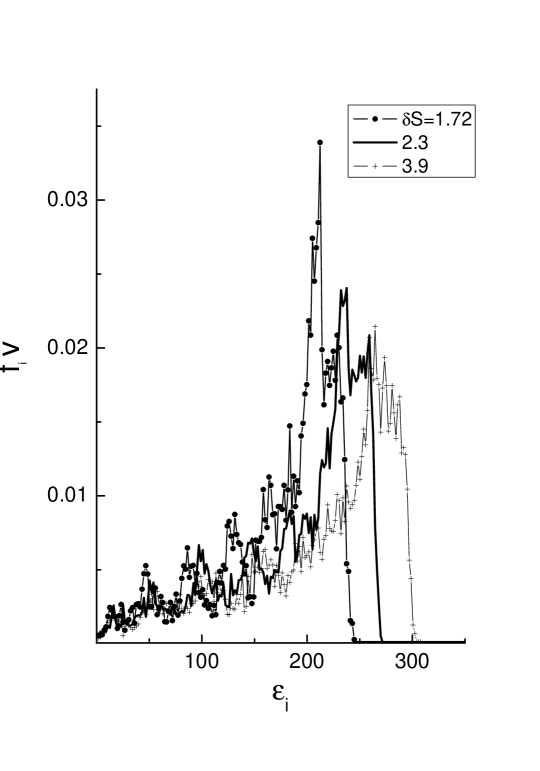
With increasing discharge asymmetry, the plasma potential relative to the smaller electrode increases, which results in a greater maximum energy of the ions.
VII Conclusions
Formation of an ion flux in a low-pressure asymmetric HFC discharge was studied in experiments and by means of kinetic numerical simulations. Two-dimensional simulations were performed by the Particle-in-Cell method with collision sampling by the Monte Carlo method. In the experiment, the ion flux was studied by an energy analyzer placed behind the grounded electrode with an orifice in the middle. Several reactors with different ratios of the areas of the driven and grounded electrodes were considered to study the effect of the chamber geometry on the ion flux. The plasma potential relative to the grounded electrode and, therefore, the maximum energy of the ions are demonstrated to increase with increasing area ratio. The measured and calculated parameters of the plasma, such as the electron concentration and temperature, and also the ion energy distribution functions are in good agreement.
Acknowledgements.
The authors gratefully acknowledge the support of this work by the Russian Foundation for Basic Research (grant No. ).References
- Lieberman & Lichtenberg (1994) Lieberman M.A. & Lichtenberg A.J., Principles of Plasma Discharges and Material Processing, New York: Wiley, 1994.
- Coburn & Kay (1972) Coburn J.W. & Kay E., J. Appl. Phys., 1972, 43, 4965.
- Orlov & Smirnov (1999) Orlov K.E. & Smirnov A.S., Plasma Sources Sci. Technol., 1999, 8, 37.
- Birdsall & Langdon (1985) Birdsall C.K. & Langdon A.B. , Plasma Physics Via Computer Simulation, New York: McGraw-Hill, 1985.
- Liebermann (1989) Liebermann M.A., J. Appl. Phys., 1989, 65, 4186.
- Schweigert (2010) Schweigert I.V., J. Phys. D: Appl. Phys., 2010 accepted.
| P(mTorr) | (V) | (V) | (V) | (cm-3) | (s-1cm-2) |
|---|---|---|---|---|---|
| exp cal | exp cal | cal | cal | cal | |
| 109 108 | 189 194 | 285 | 2.4 | 2.3 | |
| 108 108 | 191 170 | 260 | 3.4 | 3.0 |