Electromagnetically Induced Transparency with an Ensemble of
Donor-Bound Electron Spins in a Semiconductor
Abstract
We present measurements of electromagnetically induced transparency with an ensemble of donor-bound electrons in low-doped -GaAs. We used optical transitions from the Zeeman-split electron spin states to a bound trion state in samples with optical densities of 0.3 and 1.0. The electron spin dephasing time was limited by hyperfine coupling to fluctuating nuclear spins. We also observe signatures of dynamical nuclear polarization, but find these effects to be much weaker than in experiments that use electron spin resonance and related experiments with quantum dots.
pacs:
42.50.Gy, 78.47.jh, 71.55.Eq, 71.35.PqA localized electronic spin in a semiconductor is a promising candidate for implementing quantum information tasks in solid state. Optical manipulation of single-electron and single-hole systems has been realized with quantum dots Press et al. (2008); Greilich et al. (2009); Xu et al. (2009); brunner2009science ; Latta et al. (2009) and by using donor atoms that are not ionized at low temperature ( systems) Fu et al. (2005, 2008); Clark et al. (2009). These results illustrate the potential of quantum-optical control schemes that come within reach when adapting techniques from the field of atomic physics. An advantage of the systems over dots is that these can be operated as an ensemble with very little inhomogeneity for the optical transition energies. Such ensembles at high optical density are key for robust quantum-optical control schemes that have been designed for preparing nonlocal entanglement between spins, quantum communication, and applying strong optical nonlinearities Duan et al. (2001); Fleischhauer et al. (2005). A critical step toward implementing these schemes is the realization of electromagnetically induced transparency (EIT). We present here measurements of EIT with an ensemble of donor-bound electron spins in low-doped -GaAs, in samples with optical densities of 0.3 and 1.0 Wang et al. (2007). We build on an earlier indirect observation of coherent population trapping with this system Fu et al. (2005). Extending this to a direct realization of EIT with an optically dense medium is essential for getting access to strong field-matter interactions without using optical cavities, and for the application and study of transmitted signal fields Duan et al. (2001); Fleischhauer et al. (2005).
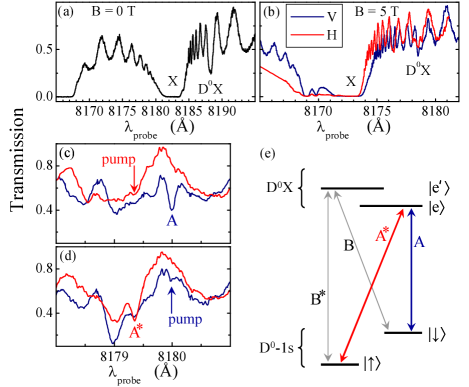
We implemented EIT in its most typical form where a spin-up and a spin-down state ( and of the electron in the system) have an optical transition to the same excited state (Fig. 1(e)). We Zeeman-split the states and with an applied magnetic field. For the state we used the lowest energy level of a donor-bound trion system (, with two electrons in a singlet state and a spin-down hole with Clark et al. (2009) localized at the donor site). EIT is then the phenomenon that absorbtion by one of the optical transitions is suppressed because destructive quantum interference with the other transition prohibits populating the state . The systems are then trapped in a dark state that is in the ideal case a coherent superposition of the states and only Fu et al. (2005); Wang et al. (2007). This state is proportional to , with and the Rabi frequencies of the control and probe field that drive the two transitions Fleischhauer et al. (2005).
We present results of implementing EIT in GaAs, and we studied the interactions between the solid-state environment and driving EIT. In particular, the systems have a single electron in a hydrogen-like wavefunction with a Bohr radius of , and each electron spin has hyperfine coupling to fluctuating nuclear spins. We studied how this limits the electron spin dephasing time and how driving EIT can result in dynamical nuclear polarization (DNP). In addition, we find that it is crucial to suppress heating effects from the nearby free exciton resonance, and demonstrate that with direct heat sinking of GaAs layers EIT can be driven with up to 2 GHz, while keeping the spin dephasing time near the level that results from the nuclear spin fluctuations.
We used epitaxially grown GaAs films of thickness with Si doping at and . At these concentrations the wavefunctions of neighboring donor sites do not overlap, which yields an ensemble of non-interacting systems. The films were transferred to a wedged sapphire substrate with an epitaxial lift-off process Yablonovitch et al. (1987), and fixed there by Van der Waals forces which assures high heat sinking. The sapphire substrate was mounted on the copper cold finger of a bath cryostat (4.2 K) in the center of a superconducting magnet with fields up to 8 T in the plane of the sample (-direction). Laser light was brought to the films at normal incidence (Voigt geometry) via a polarization-maintaining single-mode fiber. The two linear polarizations supported by the fiber are set parallel (V polarization) and orthogonal (H polarization) to the applied magnetic field. The V polarization can drive transitions (no change of -angular momentum) and the H polarization can drive transitions with a change in -angular momentum of .
Two CW Ti:sapphire lasers (Coherent MBR-110, linewidth below 1 MHz) provided tunable probe and control fields. Focussing in the sample volume was achieved with a piezo-motor controlled confocal microscope. During transmission experiments we defocussed the microscope to a spot of 16 diameter to avoid interference effects from the cavity that is formed between the sample surface and the facet of the fiber. The probe field was amplitude modulated at and we used lock-in techniques for detecting light that is transmitted trough the sample with a photodiode directly behind the sample. The signal due to unmodulated control field is rejected by AC coupling of the measurement electronics.
We first report transmission experiments that identify the spectral position of the related resonances. Only the probe laser was used. Figure 1(a) shows a spectrum taken at (identical result for H and V polarization), and Fig. 1(b) shows a result for with a separate trace for H and V polarization. The strong absorbtion labeled is due to excitation of free excitons. Resonant absorption by donor-bound excitons () occurs at for and at for . The shift of the resonances with magnetic field is the diamagnetic shift. The spacing of between the and resonances is in good agreement with previously reported binding energies Bogardus and Bebb (1968); Karasyuk et al. (1994). The oscillating background superimposed on the resonances is due to a Fabry-Perot effect in the GaAs film, and its chirped wavelength dependence around is due to the wavelength dependent refractive index that is associated with the strong free exciton absorption.
For identifying the and transitions of Fig. 1(e) within the fine structure of spectra at high fields we performed scanning-probe laser spectroscopy while the control laser is applied for optical pumping of a particular transition (this also eliminates bleaching by the probe). Figure 1(c) shows spectra obtained with pumping at () with H polarization. This leads to enhanced absorbtion at the resonance for the probe scan with V polarization. The complementary experiment with pumping V-polarized light into this transition leads to enhanced absorption of H-polarized light at transition (Fig. 1(d)). We could also perform such cross-pumping experiments using the and transitions to the level (the first excited state of the series of energy levels of the complex, see Fig. 1(e)). We thus confirmed that the pair of transitions labeled as and address a so-called closed three-level -system, and that this is the pair with lowest energies within the resonances. This interpretation is also consistent with the polarization dependence of these transitions Karasyuk et al. (1994); Fu et al. (2005). In the field range 5 to 8 T, the and transitions are spectrally well separated from the transitions , , and transitions to higher excited states of the complex. The observed Zeeman splitting corresponds to an electron factor , and also agrees with previous reports Karasyuk et al. (1994); Fu et al. (2005).
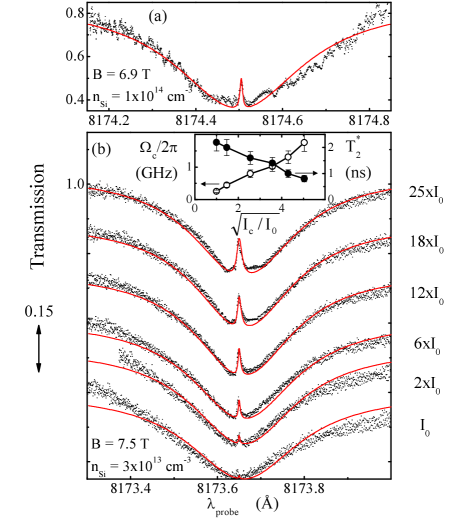
We now turn to the observation of EIT (Fig. 2). For these results we fixed the control laser central on the transition (V polarization), while the probe laser is scanned across the transition (H polarization). When the control and probe field meet the condition for two-photon Raman resonance (the difference in photon energy exactly matches the spin splitting), a narrow peak with enhanced transmission appears inside the broader absorption dip, which is the fingerprint of EIT. In Fig. 2(a) this occurs inside an absorption with optical density 1.0, while for the sample with this is 0.3 (Fig. 2(b)). We further focus on this latter sample since higher resolution of the EIT spectra makes it more suited for our further studies.

The lines in Fig. 2 and 3 are results of fitting EIT spectra with the established theory Fleischhauer et al. (2005). This involves calculating the steady-state solution of a density-matrix equation for the three-level system, and accounts for coherent driving by the lasers and relaxation and dephasing rates between the levels. The free parameters are the inhomogeneous broadening (typically 6 GHz) for the optical transition , the spin dephasing time and the control-field induced Rabi frequency (and ). The rest of the parameters are the same as in Ref. Fu et al. (2005), and we found always consistent with an independent estimate from the optical intensity and electric dipole moment. We obtain good fits and the main features in our results are consistent with EIT, as we discuss next.
Figure 2(b) shows EIT spectra taken at different intensities of the control field, where a stronger control field yields a higher and broader EIT peak. As expected for EIT, we observe that from fits scales linearly with (Fig. 2(b), inset). The values reach , and we could only obtain clear EIT spectra with such high in samples with complete adhesion onto the sapphire substrate. Our results from samples with incomplete adhesion (and work with epi-layers that are not removed from the original GaAs substrate Fu et al. (2005, 2008); Clark et al. (2009)) suffer from heating, which is observed as a broadening of the free exciton line into the region of the resonances. The values of that we find in our experiments are discussed below.
Figure 3 shows how the EIT peak position depends on detuning of the control field from the transition. As expected, the EIT peak follows the detuning of the control field. However, the EIT peak in the blue-detuned traces is clearly more prominent than in the red-detuned cases. We attribute this to a change in the effective Rabi frequency that results from the weak Fabry-Perot interference within the GaAs film, and we can indeed fit the results with fixed and varying (Fig. 3, inset). We can exclude that the difference in the quality of EIT spectra is coming from optical coupling to a level outside our -system, since all other transitions are well separated spectrally and in polarization dependence (e.g. the and transitions, see Fig. 1(e)).
An important topic that needs to be addressed next with this realization of EIT concerns the influence of the hyperfine coupling between each electron spin and nuclear spins. A polarization of the nuclear spins acts on the electron spin as an effective magnetic field . The average polarization affects the Zeeman splitting, and this can be directly observed in EIT spectra as a red (blue) shift of the EIT peak for a reduced (enhanced) Zeeman splitting. The nuclear spin fluctuations around the average dominate via this mechanism the inhomogeneous electron spin coherence time . This is a key parameter for the shape of the EIT peak (longer gives a sharper peak), and the magnitude of these fluctuations can therefore be derived from the EIT spectra as well. At our fields and temperature nuclear spins are in equilibrium close to full random orientation. The expected value for for this case is Fu et al. (2005); Kennedy et al. (2006), and is in agreement with the values that we observe.
The hyperfine coupling can also result in dynamical nuclear polarization (DNP), which is the transfer of angular momentum from the electron to the nuclear spins when the electron spin is driven out of equilibrium. Earlier experiments on our type of system with microwave-driven electron spin resonance (ESR) Kennedy et al. (2006) and optical experiments on quantum dots showed strong DNP Xu et al. (2009); Latta et al. (2009). In both cases the effects were so strong that it gave an unstable resonance condition for tuning at ESR and EIT (the systems trigger a DNP cycle that drives them out of resonance). DNP can also result in a suppression of the nuclear spin fluctuations, which yields a longer Greilich et al. (2009); Xu et al. (2009); Latta et al. (2009); Vink et al. (2009). Our experiment, however, only shows weak DNP. We never observed a significant change in the Zeeman energy (as derived from subtracting the probe and control photon energies at the EIT peak) from the EIT driving itself. We only observed in several data sets a moderate EIT peak narrowing over the course of a few hours of data taking (at fixed settings of the EIT parameters). In order to confirm the role of nuclear spins we carried out various attempts to induce stronger DNP effects.
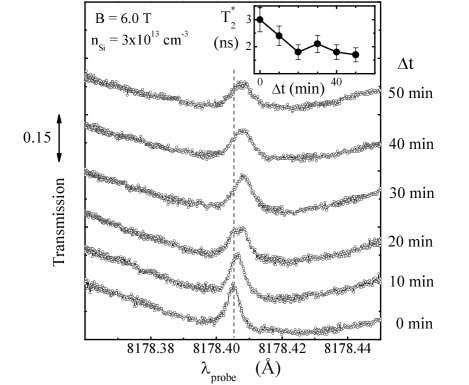
An example of the strongest DNP effects that we could induce is presented in Fig. 4. Here we first applied strong driving of the transition for 30 min with an intensity equivalent to a Rabi frequency of . This pumps the system fully into . After pumping we take fast ’snapshots’ of the EIT peak (50 sec scans, and control at with ). Between scans we kept the system in the dark for 10 min. Figure 4 shows 6 subsequent snapshots. Right after pumping we observe a blue-shifted and sharpened EIT peak (). This enhancement of probably results from suppressed nuclear spin fluctuations, which generally occurs when the polarization gets squeezed between a polarizing and depolarizing mechanism with rates that are both enhanced due to the DNP Xu et al. (2009); Latta et al. (2009); Vink et al. (2009). The peak shift agrees in sign with Ref. Kennedy et al. (2006) but corresponds to only (the ESR studies Kennedy et al. (2006) and the work on dots easily induced 200 mT - 1 T). Subsequent spectra show a clear broadening of the EIT peak, which also shifts back to the red. After about 1 hour, (Fig. 4, inset) and the peak position stabilize at the values that were observed before pumping. This agrees with the relaxation time for DNP with systems Kennedy et al. (2006). Upon exploring how DNP occurs for various EIT and pump conditions we found the effects to be too weak for systematic control and drawing further conclusions, and full understanding goes beyond the scope of the present work. The work with dots showed that the mechanism that dominates the DNP rate can be complex and needs to account for driving-field assisted processes Xu et al. (2009); Latta et al. (2009). We can nevertheless conclude that our spin dephasing time is indeed limited by coupling to nuclear spins.
In conclusion, we presented direct evidence that a ensemble in GaAs can be operated as a medium for EIT. The electron spin dephasing time limits the quality of the EIT, and is in the range that results from hyperfine coupling to fluctuating nuclear spins. The EIT spectra form a sensitive probe for detecting how DNP changes the fluctuations and the average of nuclear spin polarization. However, direct optical driving of transitions yields much weaker DNP effects than in electron spin resonance experiments with systems and related EIT experiments on quantum dots, and a complete physical picture of DNP effects in our system is not available. Still, initial signatures of controlled DNP effects show that the electron spin-dephasing time can be prolonged. Our experimental approach is suited for exploring this further in conjunction with experiments that aim to implement various applications of EIT Duan et al. (2001); Fleischhauer et al. (2005).
We thank B. Wolfs, J. Sloot and S. Lloyd for contributions, and the Dutch NWO and FOM, and the German programs DFG-SPP 1285, BMBF nanoQUIT and Research school of Ruhr-Universität Bochum for support.
References
- Press et al. (2008) D. Press, T. D. Ladd, B. Zhang, and Y. Yamamoto, Nature 456, 218 (2008).
- Greilich et al. (2009) A. Greilich, S. E. Economou, S. Spatzek, D. R. Yakovlev, D. Reuter, A. D. Wieck, T. L. Reinecke, and M. Bayer, Nature Physics 5, 262 (2009).
- Xu et al. (2009) X. Xu, W. Yao, B. Sun, D. G. Steel, D. Gammon, A. S. Bracker, and L. J. Sham, Nature 459, 1105 (2009).
- Latta et al. (2009) C. Latta, A. Hogele, Y. Zhao, A. N. Vamivakas, P. Maletinsky, M. Kroner, J. Dreiser, I. Carusotto, A. Badolato, D. Schuh, et al., Nature Physics 5, 758 (2009).
- (5) D. Brunner et al., Science 325, 70 (2009).
- Fu et al. (2005) K. M. C. Fu, C. Santori, C. Stanley, M. Holland, and Y. Yamamoto, Physical Review Letters 95, 187405 (2005).
- Fu et al. (2008) K. M. C. Fu, S. M. Clark, C. Santori, C. R. Stanley, M. C. Holland, and Y. Yamamoto, Nature Physics 4, 780 (2008).
- Clark et al. (2009) S. M. Clark, Kai-Mei. C. Fu, Q. Zhang, T. D. Ladd, C. Stanley, and Y. Yamamoto, Physical Review Letters 102, 247601 (2009).
- Duan et al. (2001) L. M. Duan, M. D. Lukin, J. I. Cirac, and P. Zoller, Nature 414, 413 (2001).
- Fleischhauer et al. (2005) M. Fleischhauer, A. Imamoglu, and J. Marangos, Reviews of Modern Physics 77, 633 (2005).
- Wang et al. (2007) T. Wang, R. Rajapakse, and S. F. Yelin, Optics Communications 272, 154 (2007).
- Yablonovitch et al. (1987) E. Yablonovitch, T. Gmitter, J. Harbison, and R. Bhat, Applied Physics Letters 51, 2222 (1987).
- Bogardus and Bebb (1968) E. Bogardus and H. Bebb, Physical Review 176, 993 (1968).
- Karasyuk et al. (1994) V. A. Karasyuk, D. G. S. Beckett, M. K. Nissen, A. Villemaire, T. W. Steiner, and M. L. W. Thewalt, Physical Review B 49, 16381 (1994).
- Kennedy et al. (2006) T. A. Kennedy, J. Whitaker, A. Shabaev, A. S. Bracker, and D. Gammon, Physical Review B 74, 161201 (2006).
- Vink et al. (2009) I. T. Vink, K. C. Nowack, F. H. L. Koppens, J. Danon, Y. V. Nazarov, and L. M. K. Vandersypen, Nature Physics 5, 764 (2009).