Herschel observations in the ultracompact HII region Mon R2††thanks: Herschel is an ESA space observatory with science instruments provided by European-led Principal Investigator consortia and with important participation from NASA.
Abstract
Context. Mon R2, at a distance of 830 pc, is the only ultracompact H ii region (UC H ii) where the photon-dominated region (PDR) between the ionized gas and the molecular cloud can be resolved with Herschel. Therefore, it is an excellent laboratory to study the chemistry in extreme PDRs (G0105 in units of Habing field, n106 cm-3).
Aims. Our ultimate goal is to probe the physical and chemical conditions in the PDR around the UC H ii Mon R2.
Methods. HIFI observations of the abundant compounds 13CO, C18O, o-H218O, HCO+, CS, CH, and NH have been used to derive the physical and chemical conditions in the PDR, in particular the water abundance. The modeling of the lines has been done with the Meudon PDR code and the non-local radiative transfer model described by Cernicharo et al. (2006).
Results. The 13CO, C18O, o-H218O, HCO+ and CS observations are well described assuming that the emission is coming from a dense (=5106 cm-3, N(H2)1022 cm-2) layer of molecular gas around the H ii region. Based on our o-H218O observations, we estimate an o-H2O abundance of 210-8. This is the average ortho-water abundance in the PDR. Additional H218O and/or water lines are required to derive the water abundance profile. A lower density envelope (105 cm-3, N(H2)=2-51022 cm-2) is responsible for the absorption in the NH 1102 line. The emission of the CH ground state triplet is coming from both regions with a complex and self-absorbed profile in the main component. The radiative transfer modeling shows that the 13CO and HCO+ line profiles are consistent with an expansion of the molecular gas with a velocity law, =0.5(r/Rout)-1 km s-1, although the expansion velocity is poorly constrained by the observations presented here.
Conclusions. We determine an ortho-water abundance of 210-8 in Mon R2. Because shocks are unimportant in this region and our estimate is based on H218O observations that avoids opacity problems, this is probably the most accurate estimate of the water abundance in PDRs thus far.
Key Words.:
ISM: structure – ISM: kinematics and dynamics – ISM: molecules – HII regions – Submillimeter1 Introduction
Ultracompact (UC) H ii regions constitute one of the earliest phases in the formation of a massive star and are characterized by extreme physical and chemical conditions (G0 105 in units of Habing field and n 106 cm-3). Their understanding is important for distinguishing the different processes in the massive star formation process and because they can be used as a template for other extreme photon-dominated regions (PDRs) such us the surface layers of circumstellar disks and/or the nuclei of starburst galaxies. The UC H ii Mon R2 is the only one that can be resolved with Herschel.
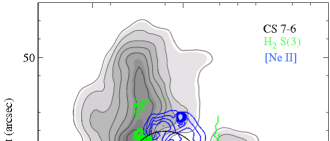
Mon R2 is a nearby (d=830 pc; Herbst & Racine 1976) complex star forming region. It hosts a UC H ii region near its center, powered by the infrared source Mon R2 IRS1 (Wood & Churchwell 1989). The molecular content of this region has been the subject of several observational studies. The huge CO bipolar outflow (Meyers-Rice & Lada 1991), 15′ long (=3.6 pc) is a relic of the formation of the B0V star associated to IRS1 (Massi, Felli, & Simon 1985; Henning, Chini, & Pfau 1992) and strong shocks are currently not at work in this region (Berné et al. 2009). Previous molecular observations (Giannakopoulou et al. 1997; Tafalla et al. 1997; Choi et al. 2000; Rizzo et al. 2003,2005) showed that the UC H ii region is located inside a cavity and bound by a dense molecular ridge. The peak of this molecular ridge (hereafter, MP) is located at an offset (+10,10) relative to the peak of the ionized gas (hereafter, IF). The molecular hydrogen column density toward the MP is 261022 cm-2. The detection of the reactive ions CO+ and HOC+ showed a dense photon-dominated region (PDR) surrounding the UC H ii region (Rizzo et al. 2003, 2005). Recent Spitzer observations probed the thin molecular gas layer (n=4105 cm-3, N(H2)=11021 cm-2) with Tk=574(20) K in between the ionized gas and the dense molecular gas traced by previous millimeter observations (Berné et al. 2009). All these components are schematically shown in Fig. 1.
1
2 Observations
The observations were made with the HIFI instrument onboard Herschel (Pilbratt et al. 2010, de Graauw et al. 2010) during the Priority Science Phase 2 in the frequency switch (FSW) observing mode with a reference position at the offset (+10′,0). Two receiver settings were observed, one in Band 1a with the WBS centered at 536.066GHz (LSB) and the other in Band 4a with the WBS centered at 971.800 GHz (LSB). These settings were observed toward both positions, IF [RA=06h07m46.2s, DEC=-06∘23′08.3′′ (J2000)] and MP [RA=06h07m46.87s,DEC=-06∘23′18.3′′ (J2000)]. In this letter we present the observations toward the MP because the study of the spatial distribution of the molecular tracers is postponed for a forthcoming paper. The data were reduced using HIPE 3.0 pipeline. The adopted intensity scale was antenna temperature. In addition to Herschel data, we used the HCO+ (10), HCO+ (32), CS (21), 13CO (10), 13CO (21), C18O (10) and C18O (21) observed with the IRAM 30m telescope.
3 Results
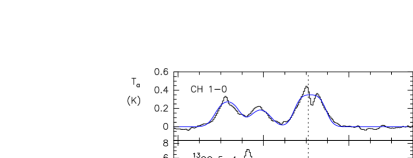
We detected the CH 10, HCO+ 65, CS 1110, oHO 110101, 13CO 54, C18O 54, and NH 1102 lines in the MP (see Fig. 2). We stress that this is the first detection of the rarer water isotopologue oHO toward a spatially resolved PDR. All the lines except NH 1102 were detected in emission. Gaussian fits are shown in Table 1 and Fig. 2. We fitted the three components of the CH 10 line assuming the same excitation temperature and estimated that the opacity of the main component is 3. In this case, the central velocity is not well determined because of the self-absorption and the flattened profiles produced by the large opacities. The NH 1102 line was tentatively detected (3) in absorption. This line is composed of 10 components and we fitted all of them assuming the same excitation temperature. Our fit shows that the NH line is optically thin. Because the individual components are not resolved with a linewidth of 4 km/s, the individual line parameters are uncertain. This detection needs to be confirmed.
| Line | Freq. | Ta | vlsr | ||
|---|---|---|---|---|---|
| (GHz) | (K) | (km s-1) | (km s-1) | ||
| CH | 536.761 | 1.81(0.21) | 10.9(0.1) | 4.9(0.3) | 3.6(0.6) |
| NH | 974.478 | -0.24(0.07) | 9.9(0.4) | 4.9(0.8) | 0.1(0.7) |
| Line | Freq | Area | vlsr | TMB | |
| (GHz) | (Kkm s-1) | (km s-1) | (km s-1) | (K) | |
| HCO+ | 535.061 | 19.4(4.0) | 10.4(0.3) | 3.2(0.8) | 5.7 |
| CS | 538.688 | 1.09(0.04) | 10.5(0.1) | 2.2(0.1) | 0.4 |
| oHO | 547.676 | 0.22(0.03) | 10.7(0.1) | 2.4(0.3) | 0.08 |
| 13CO | 550.926 | 51.1(2.0) | 10.6(0.1) | 3.4(0.2) | 14.0 |
| C18O | 548.830. | 14.0(0.4) | 10.5(0.1) | 2.6(0.1) | 5.0 |
3.1 Line profiles
Different velocity components can be distinguished in this region. The ambient cloud is centered at vlsr=10.51 km s-1. A large scale molecular outflow is associated with IRS 1 (Meyers-Rice & Lada, C.J. 1991; Tafalla et al. 1997). The wings observed in the emission profiles of the HCO+ 10 and 32 lines and in the 13CO 21 line (velocity ranges [0,6] km s-1 and [4,14] km s-1) are associated with the molecular outflow. The HCO+ 65, 13CO 54 and C18O 54 lines are centered at a velocity of 10.4 km s-1. In Fig. 3 we compare the HIFI lines with the low rotational lines of the same species observed with the IRAM 30m telescope. The angular resolution of the IRAM data was degraded to match those of Herschel. The line profiles of the low rotational lines of HCO+ and 13CO are self-absorbed at red-shifted velocities. For C18O, there is a perfect match between the profiles of the the J=54 and J=21 lines. The profiles of the CS J=21 and J=1110 lines also match perfectly.
The HCO+ 65, CS 1110, 13CO 54 and C18O 54 lines have characteristic linewidths of 2–3 km s-1. The largest linewidths observed in the NH 1102 and CH lines ( 5 km s-1) indicate that these lines are tracing a different, probably more diffuse component. As argued in Sect 4.1, the NH absorption is very likely caused by the cold and lower density envelope surrounding the UC H ii region. The CH 10 line is seen in absorption and emission suggesting that CH is present in the low density envelope and the dense PDR.
3.2 Molecular column densities
In Table 2 we present the estimated molecular column densities. We used the rotational diagram technique to estimate the rotation temperature and the column density of the CO isotopologues and CS. This technique gives an average rotation temperature and total column density providing that the emission is optically thin. For optically thick lines, we obtained a lower limit to the true column density and rotation temperature (this is very likely the case for 13CO). For CH and NH we assumed a reasonable value of the rotation temperature. Previous molecular observations at millimeter wavelengths showed the existence of gas with densities up to n=4106 cm-3 and Tk50 K in the molecular ridge (Choi et al. 2000; Rizzo et al. 2003, 2005). Berné et al. (2009) derived a density, n=4105 cm-3 and a gas kinetic temperature of 570 K for a thin gas layer around the H ii region on basis of the H2 rotational lines. These two n-T pairs of values can produce the rotation temperatures derived from our observations. However, the gas layer at 570 K cannot account for the observed line intensities. For instance, assuming a standard C18O abundance of 210-7, this hot layer will produce a C18O 54 line intensity of Tb0.09 K, i.e. 2% of the observed value. Therefore, the emission of the observed lines is mainly coming from the dense (n=4106 cm-3) molecular ridge.
We detected the oHO 110101 line in the MP. Using the non-local radiative transfer code of Cernicharo et al. (2006) and assuming the densities and temperatures prevailing in the dense molecular ridge (Tk=50 K, n(H2)=4106 cm-3), we obtained an excitation temperature for the ground state transition of oHO of 8.5 K. With this low excitation temperature, we need N(oHO)= 2.71012 cm-2 to fit our observations. Assuming a 18O/ 16O ratio of 500, this implies an ortho-water abundance of 210-8. The excitation temperature is not very sensitive to the gas kinetic temperature. To assume a gas kinetic temperature as high as 500 K would increase the excitation temperature by a factor of 2, and decrease the estimated oHO column density by a factor of 10. To assume a lower hydrogen density would be more critical, because the excitation temperature would drop to very low values (6 K), and the line would become very weak and optically thick which would prevent any good estimate of the oHO column density. The water abundance estimated in Mon R2 is similar to that obtained toward the Orion Bar by Olofsson et al. (2003) using ODIN observations. In that case, the spatial resolution of the ODIN observations did not allow the authors to resolve the dense PDR. Moreover, their estimate was based on observations of the ground state transition of the main water isotopologue, which is optically thick. The agreement between the two measurements could therefore be fortuitous. Recent SPIRE observations of the Orion Bar have provided an upper limit to the water abundance of a few 10-7 (Habart et al. 2010).
To interpret the observed NH 11-02 line absorption, a knowledge of the continuum level is needed. Unfortunately, the line was observed in FSW mode, which removes the continuum. Hence, the continuum level had to be estimated from previous measurements. In particular, Dotson et al. (2010) measured an intensity of 280 Jy/beam using the CSO telescope (beam=20) at 350 m (=857 GHz). Assuming a spectral index of 3, we estimate a continuum flux of 411 Jy at 974 GHz. This value corresponds to a brightness temperature of 0.8 K in the HIFI beam. Taking into account the uncertainty in and the different beams of Herschel and CSO, we estimate that the accuracy of the continuum intensity at 974 GHz is about a factor of 2. Assuming Tex=10 K, and an intrinsic linewidth of 4 km s-1, the line opacity inferred from the observed absorption feature implies a NH column density of (1–5)1013 cm−2 (a factor 1.5 higher if Tex=20 K). Taking 51022 cm-2 as an upper limit for N(H2) (the NH absorption likely arises in a external layer of more diffuse gas), the NH abundance would be greater than (1.0-0.2)10-9. These abundances are comparable to the NH abundance first inferred by ISO toward Sgr B2 (Cernicharo et al. 2000, Goicoechea et al. 2004).
| Mol | Trot | Observed | PDR Model |
| (K) | (cm-2) | (cm-2) | |
| 13CO | 27 | 4.7 1016 | 3.5 1016b |
| C18O | 34 | 6.9 1015 | 3.5 1015b |
| H13CO+ | 20c | 1.7 1012c | 9.3 1011b |
| CS | 25 | 6.3 1013 | 6.7 1013 |
| oHO | 8.5a | 2.7 1012 | 2.9 1012b,d |
| CH | 19a | 5.6 1013 | 3.3 1014 |
| NH | 10-20a | 1-5 1013 | 5.1 1011 |
∗ The rotational diagrams used the 30m and HIFI lines.
a Assumed rotational temperature.
b Assuming 12C/13C=50 and 16O/18O=500
c From Rizzo et al. (2005)
d Assuming an ortho-to-para ratio of 3.
4 Discussion
4.1 Chemical model
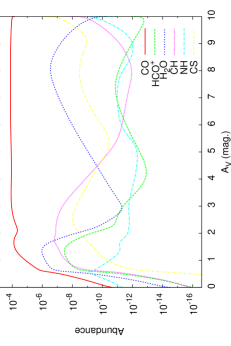
We explored the possibility of explaining the molecular abundances observed in Mon R2 in terms of PDR chemistry. To do this, we used the updated version of the Meudon PDR code (Le Petit et al. 2006, Goicoechea & Le Bourlot 2007). As input parameters we used a plane-parallel slab with a thickness of 10 mag and n=4106 cm-3, which is illuminated from the left side with a field of G0=5105 and from the right side with the standard interstellar UV field (G0=1). Elemental abundances were: He (0.1), O (3.1910-4), N (7.510-5),C (1.3210-4), S (1.8610-5), Fe (1.510-8). The model does not include isotopic fractionation, we estimated the abundances of the isotopologues assuming 12CO/13CO=50 and 16O/18O=500. The obtained column densities are shown in Table 2 and the abundance profiles are plotted in Fig. 4. We got an excellent agreement between observations and model predictions for the CO isotopologues, HCO+, H2O, and CS. The model successfully predicts the observed average water abundance. The water abundance is far from uniform across the PDR, with a peak of 10-6 at an extinction of 1 mag and a minimum value 10-10 (see Fig. 4). The observation of high excitation lines of water will allow us to derive the water abundance profile and further constrain the chemical modeling. The model falls short by more than one order of magnitude however to predict the NH column density. The NH abundance is 10-9 all across the PDR (see Fig. 4). As argued below, this is very likely due to the main contribution to the observed NH line coming from the low density envelope that is protected from the UV radiation. We ran the code for a low density (n4104 cm-3) plane-parallel layer of 50 mag illuminated with G0=1 and obtain a NH column density of 31013 cm-2 in better agreement with the observations. This low density envelope would also contribute to the CH ground state line since the CH column density should be a few 1014 cm-2. For this reason, we have a very complex CH profile, with the line optically thick and self-absorption in the main component. However, the contribution of the low density envelope to the other observed HIFI lines would be negligible because of the low density and low gas kinetic temperature. For instance, the intensity of the 13CO 54 line would be 0.1 K.
4.2 Kinematics of the region
The systematic change in the line profiles of the rotational lines of HCO+ and 13CO can be understood in terms of the velocity structure of the molecular core. Although the complete modeling of the source is beyond the scope of this paper, (most of the HIFI data are still to come), we made a preliminary model to gain insights into the kinematics of this source. The UC H ii region is expected to expand because of the different pressure of the ionized and molecular gas (Jaffe et al. 2003; Rizzo et al. 2005). We modeled the HCO+ and 13CO lines using the non-local radiative transfer code of Cernicharo et al. (2006). In the model, we adopted the physical structure derived in Sect. 4.1 (a spherical envelope with inner radius Rin=0.08 pc, an innermost layer with Tk=50 K, n=4106 cm-3 and a radial thickness of 0.0006 pc, and an external envelope with the temperature decreasing as TR-0.5, a constant density of n=1105 cm-3 and a thickness of 0.16 pc). For the dust temperature and opacity, we adopted the values derived by Thronson et al. (1980). As a first approximation we assumed constant 13CO and HCO+ abundances of 210-6 and 10-9 respectively and only varied the velocity law. We were able to reproduce the line intensities and the trend observed in the line profiles assuming an expansion velocity law ve= 0.5(R/Rout)-1 km s-1 (Rout=0.24 pc) and a turbulent velocity of 2 km s-1 (see Fig. 5). Because of the hole in the molecular core, the maximum expansion velocity is 1.5 km s-1, which is similar to the turbulent velocity. For this reason, the back and front parts of the envelope are radiatively coupled producing the self-absorbed profiles at red-shifted velocities. The shapes of the line profiles are dominated by the turbulent velocity with little effect of the small expansion velocity, which is poorly constrained.
4
5 Conclusions
We present the first HIFI observations toward the UC H ii region Mon R2. Detections of the 13CO 54, C18O 54, oH218O 110101, HCO+ 65, CS 1110, NH 11-02, and CH 10 lines are reported. The emission/absorption of all these molecules is well explained assuming the the molecular core is composed of a dense (n=5106 cm-3) PDR layer of gas surrounded by a lower density UV protected envelope. The modeling of the 13CO and HCO+ line profiles is consistent with the molecular gas being expanding with an expansion velocity law, ve=0.5(r/Rout)-1 km s-1. Based on our oH218O 110101 observations, we estimate an ortho-water abundance of 210-8. Because shocks are unimportant in this region and our estimate is based on the rarer isotopologue observations that avoids opacity problems, this water abundance estimate is probably the most accurate in PDRs thus far.
Acknowledgements.
HIFI has been designed and built by a consortium of institutes and university departments from across Europe, Canada and the United States under the leadership of SRON Netherlands Institute for Space Research, Groningen, The Netherlands and with major contributions from Germany, France and the US. Consortium members are: Canada: CSA, U.Waterloo; France: CESR, LAB, LERMA, IRAM; Germany: KOSMA, MPIfR, MPS; Ireland, NUI Maynooth; Italy: ASI, IFSI-INAF, Osservatorio Astrofisico di Arcetri- INAF; Netherlands: SRON, TUD; Poland: CAMK, CBK; Spain: Observatorio Astronómico Nacional (IGN), Centro de Astrobiología (CSIC-INTA). Sweden: Chalmers University of Technology - MC2, RSS & GARD; Onsala Space Observatory; Swedish National Space Board, Stockholm University - Stockholm Observatory; Switzerland: ETH Zurich, FHNW; USA: Caltech, JPL, NHSC. This paper was partially supported by Spanish MICINN under project AYA2009-07304 and within the program CONSOLIDER INGENIO 2010, under grant ”Molecular Astrophysics: The Herschel and ALMA Era – ASTROMOL” (ref.: CSD2009-00038).References
- Berné et al. (2009) Berné, O., Fuente, A., Goicoechea, J. R., Pilleri, P., González-García, M., & Joblin, C. 2009, ApJL, 706, L160
- Cernicharo et al. (2000) Cernicharo, J., Goicoechea, J. R., & Caux, E. 2000, ApJL, 534, L199
- Cernicharo et al. (2006) Cernicharo, J., Goicoechea, J. R., Pardo, J. R., & Asensio-Ramos, A. 2006, ApJ, 642, 940
- Choi et al. (2000) Choi, M., Evans, N. J., II, Tafalla, M., & Bachiller, R. 2000, ApJ, 538, 738
- de Graauw et al. (2010) de Graauw T. et al., 2010, this volume.
- Dotson et al. (2010) Dotson, J. L., Vaillancourt, J. E., Kirby, L., Dowell, C. D., Hildebrand, R. H., & Davidson, J. A. 2010, ApJS, 186, 406
- Giannakopoulou et al. (1997) Giannakopoulou, J., Mitchell, G. F., Hasegawa, T. I., Matthews, H. E., & Maillard, J.-P. 1997, ApJ, 487, 346
- Goicoechea et al. (2004) Goicoechea, J. R., Rodríguez-Fernández, N. J., & Cernicharo, J. 2004, ApJ, 600, 214
- Goicoechea & Le Bourlot (2007) Goicoechea, J. R., & Le Bourlot, J. 2007, A&A, 467, 1
- Habart et al. (2010) Habart, E. et al., 2010, A&A Herschel Special Issue
- Henning et al. (1992) Henning, T., Chini, R., & Pfau, W. 1992, A&A, 263, 285
- Herbst & Racine (1976) Herbst, W., & Racine, R. 1976, AJ, 81, 840
- Jaffe et al. (2003) Jaffe, D. T., Zhu, Q., Lacy, J. H., & Richter, M. 2003, ApJ, 596, 1053
- Le Petit et al. (2006) Le Petit, F., Nehmé, C., Le Bourlot, J., & Roueff, E. 2006, ApJS, 164, 506
- Massi et al. (1985) Massi, M., Felli, M., & Simon, M. 1985, A&A, 152, 387
- Meyers-Rice & Lada (1991) Meyers-Rice, B. A., & Lada, C. J. 1991, ApJ, 368, 445
- Olofsson et al. (2003) Olofsson, A. O. H., et al. 2003, A&A, 402, L47
- Pilbratt et al. (2010) Pilbratt, G.; et al. 2010, this volume
- Rizzo et al. (2003) Rizzo, J. R., Fuente, A., Rodríguez-Franco, A., & García-Burillo, S. 2003, ApJL, 597, L153
- Rizzo et al. (2005) Rizzo, J. R., Fuente, A., & García-Burillo, S. 2005, ApJ, 634, 1133
- Tafalla et al. (1997) Tafalla, M., Bachiller, R., Wright, M. C. H., & Welch, W. J. 1997, ApJ, 474, 329
- Thronson et al. (1980) Thronson, H. A., Jr., Gatley, I., Harvey, P. M., Sellgren, K., & Werner, M. W. 1980, ApJ, 237, 66
- Wood & Churchwell (1989) Wood, D. O. S., & Churchwell, E. 1989, ApJS, 69, 831