Sensitive limits on the abundance of cold water vapor in the DM Tau protoplanetary disk ††thanks: Herschel is an ESA space observatory with science instruments provided by European-led Principal Investigator consortia and with participation important from NASA.
We performed a sensitive search for the ground-state emission lines of ortho- and para-water vapor in the DM Tau protoplanetary disk using the Herschel/HIFI instrument. No strong lines are detected down to 3 levels in 0.5 km s-1 channels of 4.2 mK for the – line and 12.6 mK for the – line. We report a very tentative detection, however, of the – line in the Wide Band Spectrometer, with a strength of mK, a width of 5.6 km s-1 and an integrated intensity of 16.0 mK km s-1. The latter constitutes a detection. Regardless of the reality of this tentative detection, model calculations indicate that our sensitive limits on the line strengths preclude efficient desorption of water in the UV illuminated regions of the disk. We hypothesize that more than 95–99% of the water ice is locked up in coagulated grains that have settled to the midplane.
Key Words.:
ISM: abundances — ISM: molecules — protoplanetary disks1 Introduction
Because of its association with biology on Earth, water is one of the most important molecules in the solar system and beyond. However, the origin of water on Earth is highly uncertain. What is clear is that the distribution of hydrated rocks in the solar system (Abe et al. 2000) suggests that water resided in the vapor phase in the warm ( 100 K) inner solar nebula and is predominantly condensed in the form of ice beyond the so-called snow-line between 2–2.5 AU (Hayashi 1981; Abe et al. 2000).
The observation of cool water vapor in protoplanetary disks is hampered by atmospheric attenuation and requires space-based observations. A number of recent detections of hot ( 200 K) water by the Spitzer Space Telescope has demonstrated that abundant water vapor is a ubiquitous component in protoplanetary disks (Salyk et al. 2008; Carr & Najita 2008; Pontoppidan et al. 2010). However, this emission likely arises within the snow-line of these young systems and therefore does not provide a complete picture of the distribution of water (both ice and vapor) in disks with sizes in excess of 100 AU. In particular, these observations do not probe the cold ( K) outer parts of the disk where most of the mass resides.
The Herschel Space Observatory (Pilbratt et al. 2010) offers a new opportunity for a characterization of the distribution and evolution of water vapor in protoplanetary disks. We report here a sensitive search for cold water emission in the ground-state lines of ortho- (o) and para- (p) H2O using the high spectral resolution of the HIFI instrument (de Graauw et al. 2010) towards the well studied DM Tau protoplanetary disk. This study is part of the guaranteed time key program ‘Water in Star Forming Regions’ (van Dishoeck et al. in prep.). Stringent limits to the strength of both lines of a few mK suggest that the outer regions of the disk contain little water vapor or water ice. In Sect. 2 we outline the observations. Section 3 presents results from detailed modeling; Sect. 4 summarizes the implications of our result.
2 Observations and results
DM Tau is a T Tauri star located at 4h33m487 and 18∘10′10′′ with a disk diameter, estimated from CO emission, of AU at a systemic velocity of 6 km s-1 and (Piétu et al. 2007). The source is a single M1 star (White & Ghez 2001) with =0.25 L⊙. DM Tau has a chemically rich molecular disk (Dutrey et al. 1997). Accretion from the disk to the star also provides a source of excess UV luminosity, with an overall UV field strength of (relative to the standard interstellar radiation field, ISRF; Bergin et al. 2003, 2004; Habing 1968). The object is a transition disk with an inner hole on the order of a few AU, based on models of Spitzer spectra (Calvet et al. 2005).
DM Tau was observed with the HIFI instrument using the double beam switch observing mode with a throw of . On 2010 March 22 spectra were taken in receiver band 1b with an on-source integration time of 198 minutes, and =78–96 K. On 2010 March 4 spectra were taken in receiver band 4b and an on-source integration time of 328 minutes, and =370–410 K.
The HIFI beam of at 556 GHz and at 1113 GHz is larger than the DM Tau disk with a diameter of at 140 pc. The beams are also larger than the pointing accuracy of Herschel of . The data were recorded with Wide-Band Spectrometer (WBS) covering 4.4 GHz with 1.1 MHz resolution (0.59 and 0.30 km s-1 at 556 and 1113 GHz, respectively), and the High-Resolution Spectrometer (HRS) covering 230 MHz at 0.25 MHz resolution (0.13 and 0.067 km s-1 at 556 and 1113 GHz, respectively). Both H- and V-polarizations were measured.
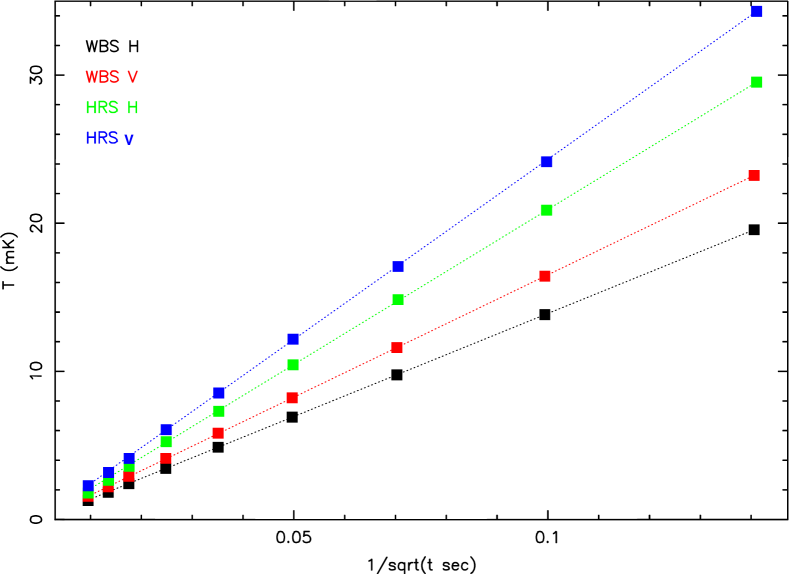
The raw data were calibrated onto the scale by the in-orbit system and converted to assuming a beam efficiency of 0.74 The data were reduced using HIPE v3.0. Subsequently, the data were exported to CLASS111http://www.iram.fr/IRAMFR/GILDAS. The HIFI flux calibration is accurate to 10%, while the velocity scale of HIPE v3.0 is accurate to several m s-1. For both lines, the WBS data were rebinned to 0.54 km s-1 channels (or 1.0 MHz, close to the instrumental resolution of 1.1 MHz); the HRS data were rebinned to 0.45 km s-1 channels. All spectra, including the the H- and V-polarizations, were averaged together weighted by their respective noise levels. The resulting rms noise levels are 2.9 mK (HRS) and 1.4 mK (WBS) for the H2O – line, and 7.2 mK (HRS) and 4.3 mK (WBS) for the H2O – line222Although the channel spacing in both bands in similar (0.54 vs 0.45 km s-1), the noise in the WBS is 1.7–2.0 times lower than the noise in the HRS because of the larger noise bandwidth of the WBS and a loss factor in the HRS autocorrelator.. Figure 1 illustrates for band 1b that the noise in our data decreases as (time)-0.5 up to the full achieved integration times.
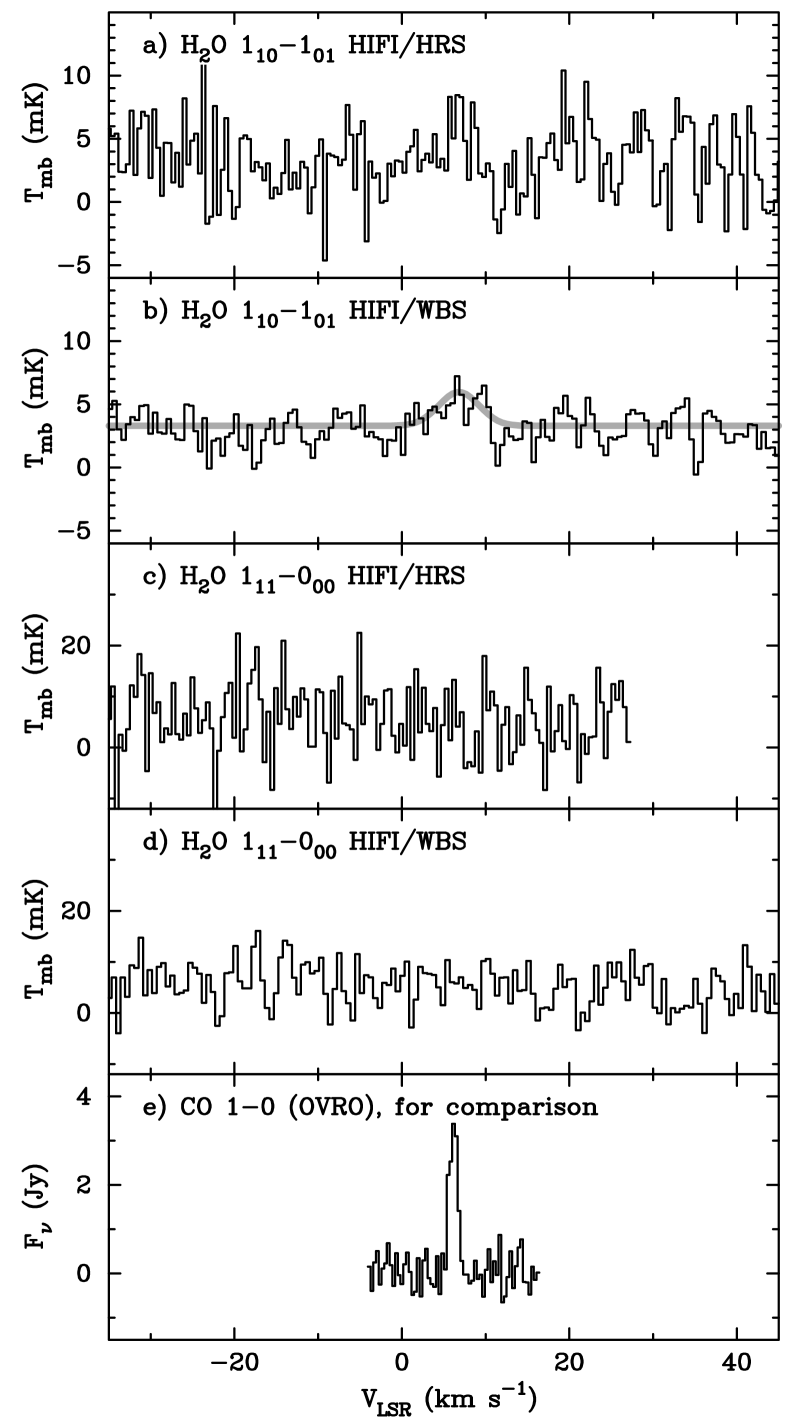
Figure 2 presents the HRS and WBS spectra of the two water transitions. No strong lines are detected; for comparison, Fig. 2 also shows the 12CO 1–0 spectrum of DM Tau (Kessler-Silacci 2004; Panić et al. in prep.) showing a clear emission line with a width of 2 km s-1 centered on the source velocity of km s-1. In the WBS spectrum of the H2O – line a weak feature is present between +0.5 and +10 km s-1, peaking around +6.6 km s-1; a similar feature is seen in the noisier HRS spectrum. With mK, the brightest channel lies at 3. Integrated between +0.5 and +10 km s-1, the feature contains mK km s-1, a 5 result. A Gaussian fit to the feature yields best fit parameters of km s-1, a FWHM width of km s-1, an intensity mK, and an integrated intensity of mK km s-1 (6).
Arguments in favor of interpreting this feature as a positive detection of the H2O – line include the facts that the integrated intensity constitutes a 5–6 detection and that the feature peaks near the systemic velocity of 6.1 km s-1. Against the interpretation as a positive detection is a line peak that is only 2–3 and a linewidth which is twice that of the 12CO line. The width would suggest that the emission arises from within 10 AU. With respect to the latter, it is interesting that HCO+ 1–0 line has a blue wing extending over 3 km s-1 (Dutrey et al. 1997).
Neither set of arguments is clearly stronger, and we interpret the feature in the H2O – spectrum as a very tentative detection of water vapor in the disk of DM Tau. In the remainder of this Letter, we will work with an intensity of mK for the H2O – line and with an upper limit to the intensity of the H2O – line of mK.
Smoothing the WBS spectra to km s-1 resolution results in positive detections of the continuum of DM Tau at 556.9 GHz of mK ( Jy) and at 1113.3 GHz of mK ( Jy). These values are consistent with other continuum measurements (Dutrey et al. 1996).
3 Model Predictions
3.1 Chemistry of Water Vapor in the Cold Outer Disk
Because the midplane temperatures are well below the evaporation temperature at densities representative of the midplane of 150 K (Fraser et al. 2001; D’Alessio et al. 2005), we can expect that beyond the snow-line water is mostly frozen on the surfaces of dust grains. Therefore, molecular emission arises predominantly from the warm disk surface that is heated by stellar irradiation (Aikawa et al. 2002). Beyond 10 AU the dust in this superheated layer is heated to 100 K (Nomura et al. 2007) and again it is anticipated that water will remain as ice. However, the upper layers of the disk are exposed to energetic X-ray and FUV radiation which provide a source for non-thermal desorption. Models of X-ray induced desorption suggest that X-rays cannot release significant H2O into the gas (Najita et al. 2001). A more profitable method to desorb water ice in the cold outer disk is via photodesorption, which has a measured yield (molecules/photon) of (Öberg et al. 2009). This has been suggested as providing a basal column of water vapor in the disk by Dominik et al. (2005).
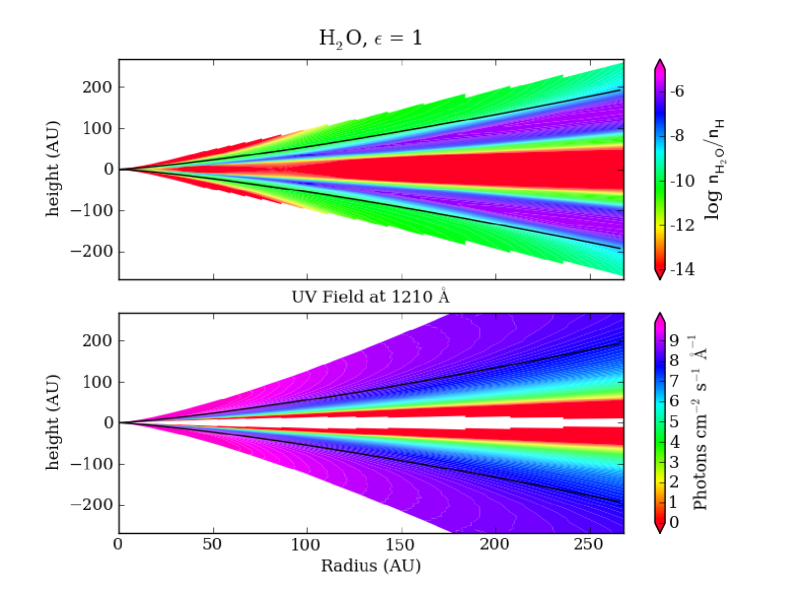
Figure 3 presents results from a detailed calculation of the UV radiation transfer and chemistry of a standard T Tauri disk with M⊙, AU and a standard gas-to-dust ratio (Fogel et al. 2010). A key aspect in the calculation of the importance of photodesorption is the formation of water ice on the grain surface via oxygen hydrogenation and also the 2D propagation of UV photons. This includes Ly radiation. which is important for H2O (van Dishoeck et al. 2006). As can be seen a thin layer exists where water vapor is present in moderate abundance () in the cold outer regions of the disk.
As noted by Dominik et al. (2005) the column density of water vapor produced by photodesorption is independent of the photon flux. This can be seen by balancing formation by photodesorption with destruction by UV photodissociation, giving a maximum water abundance (Hollenbach et al. 2009): Here is the integral of the photon flux given in Fig. 3 and cm-2 (van Dishoeck et al. 2006). is the cross section of a given site on the grain (, with grain radius =0.1 m and =). =2 is a correction for the fact the UV photons only penetrate the first few monolayers (Öberg et al. 2009), with a yield of . is the fraction of water ice over the total amount of ice and is the number of monolayers. Based on this approximation we find ; for scaling relations see Hollenbach et al. (2009). This could be lowered if the grains have a reduced fraction of water ice or perhaps less than a monolayer of coverage.
3.2 Comparison to Observations
Using the above chemical model calculation as input, we use the molecular excitation and radiative transfer code LIME (Brinch et al. in prep.) to calculate the line intensity in both observed water lines. We use the collision rates of water with p-H2 from Faure et al. (2007) as provided by the LAMDA database (Schöier et al. 2005)333http://www.strw.leidenuniv.nl/moldata and convolved the results with the appropriate Herschel beams. In our models we assume an intrinsic broadening of 0.4 km/s on top of a Keplerian velocity profile.
Because of the appreciable abundance of H2O in the model (disk-averaged column density of cm-2), it is not surprising that significant line intensities are predicted of mK for the – line and 300 mK for the – line with a Gaussian spectral profile. Clearly, our observations rule out the presence of the amounts of water vapor predicted by photodesorption regardless of the details of our model.
Absorption by low-excitation water from foreground material cannot explain the absence of detected emission: the cloud seen in 12CO by (Dutrey et al. 1997) has narrow emission centered 3 km s-1 away from the DM Tau disk. Only when the column density of water is scaled down by a factor of 130 to a disk-averaged value of cm-2 does the predicted strength of the – line becomes consistent with the observed limits; the limits on the – line are less strict because of the higher noise of these observations.
Our model could predict lines that are too intense if we overestimate the collisional excitation of water. Dick et al. (2010) suggested that existing collisional excitation rates for water are overestimated at temperatures below 50–80 K. Decreasing the collisional excitation rates has little effect on the line strengths for the original column density. In that case, the lines are still highly optically thick, with maximum optical depth of 2000, and line trapping effectively excites the line. However, for collision rates lower by a factor of 10 compared to the adopted rates, reducing the disk averaged column density by a factor of 20 to cm-2 is sufficient to comply with the observational constraints.
Our generic model disk contains 0.03 M⊙ similar to DM Tau, but its 400 AU radius is only half that of DM Tau. The increased beam dilution only strengthens our conclusions. For a DM Tau specific model, Dominik et al. (2005) predict the – line to be in absorption. Line profiles with combinations of emission and strong absorption naturally arise in disk models with strong temperature, density and water abundance gradients viewed under non-zero inclinations. An example is provided by Cernicharo et al. (2009) for the HD 97048 disk. These models have water abundances peaking at much larger height above the midplane, explaining the low excitation resulting in strong absorption. For our discussion here, we stress that all these models predict emission or absorption lines that are inconsistent with our observational limits. Future work will focus on more detailed models for DM Tau, and also explore the effect of dust settling and non-standard gas-to-dust ratios (Brinch et al. in prep.).
Finally, we note that Ceccarelli et al. (2005) have claimed a 4 detection HDO in the DM Tau. This detection has been cast into doubt based on line formation considerations (Guilloteau et al. 2006). Our models predict water will be in emission, and not absorption. At face value this would argue against the reality of the absorption. If we derive a column density from the HDO observations and the limits here, the D/H ratio would also be exceedingly high . Deeper HDO observations are needed to settle this issue.
4 Implications
We have presented the results from a deep search for the ground state emission lines of H2O and H2O towards the DM Tau disk. Based on the best theoretical knowledge we have to date, water vapor should be present in the outer disk and presumably emissive. However, our sensitive observations show that, at least for this object, it is not. Our limit on the -H2O line precludes an extreme ratio as explanation for the low -H2O emission strength. There are two potential explanations for this result. Either water vapor is unemissive as would be the case if the excitation at low temperature is lower than generally assumed (Dick et al. 2010). Cernicharo et al. (2009) also show that the water excitation sensitively depends on the adopted collision rates with o- and p-H2. However, our calculations suggest that line trapping is sufficiently effective at the predicted water abundances to still produce detectable lines. Alternatively, our physical/chemical understanding may be incorrect. The photodesorption yield is measured in the laboratory at low temperature and the abundance is independent of the photon flux so these aspects appear unlikely to provide the answer. One intriguing possibility is that the upper layers of the outer disk are ‘dry’ which could be the case if only bare grains are present in the region where UV photons are present. A well known key aspect of disk physical evolution is the coagulation and settling of dust grains to the disk midplane (Weidenschilling & Cuzzi 1993; Dullemond & Dominik 2004; Furlan et al. 2006). Icy grains present a more favorable surface for grain coagulation and would therefore become larger and settle to deeper layers than their bare silicate counterparts (Dominik & Tielens 1997). While upward mixing of gas and small grains may occur, larger ice-bearing grains remain in the midplane. In addition, the total will be reduced, thereby reducing the efficiency of grain surface formation of H2O upon which the photodesorption model depends for water vapor creation (Hollenbach et al. 2009). This ‘cold-finger’ effect was also proposed by Meijerink et al. (2009) to explain the truncation of warm water vapor beyond 1 AU seen in Spitzer measurements. Thus, Herschel and Spitzer both suggest that the disk around DM Tau is settled. In summary, our Herschel results suggest that less than 1–5% of the water ice reservoir survives in the UV-illuminated outer disk regions around DM Tau. If this finding is confirmed by more detailed models and by additional observations, Herschel may be telling us something entirely new about the chemical structure of protoplanetary disks.
Acknowledgements.
HIFI has been designed and built by a consortium of institutes and university departments from across Europe, Canada and the United States under the leadership of SRON Netherlands Institute for Space Research, Groningen, The Netherlands and with major contributions from Germany, France and the US. Consortium members are: Canada: CSA, U.Waterloo; France: CESR, LAB, LERMA, IRAM; Germany: KOSMA, MPIfR, MPS; Ireland, NUI Maynooth; Italy: ASI, IFSI-INAF, Osservatorio Astrofisico di Arcetri- INAF; Netherlands: SRON, TUD; Poland: CAMK, CBK; Spain: Observatorio Astronómico Nacional (IGN), Centro de Astrobiología (CSIC-INTA). Sweden: Chalmers University of Technology - MC2, RSS & GARD; Onsala Space Observatory; Swedish National Space Board, Stockholm University - Stockholm Observatory; Switzerland: ETH Zurich, FHNW; USA: Caltech, JPL, NHSC. Support for this work was provided by NASA through an award issued by JPL/Caltech. EAB acknowledges support by NSF Grant 0707777, MRH by NWO grant 639.042.404.References
- Abe et al. (2000) Abe, Y., Ohtani, E., Okuchi, T., Righter, K., & Drake, M. 2000, Water in the Early Earth (Origin of the earth and moon, edited by R.M. Canup and K. Righter and 69 collaborating authors. Tucson: University of Arizona Press., p.413-433), 413–433
- Aikawa et al. (2002) Aikawa, Y., van Zadelhoff, G. J., van Dishoeck, E. F., & Herbst, E. 2002, A&A, 386, 622
- Bergin et al. (2003) Bergin, E., Calvet, N., D’Alessio, P., & Herczeg, G. J. 2003, ApJ, 591, L159
- Bergin et al. (2004) Bergin, E., Calvet, N., Sitko, M. L., et al. 2004, ApJ, 614, L133
- Calvet et al. (2005) Calvet, N. et al. 2005, ApJ, 630, L185
- Carr & Najita (2008) Carr, J. S. & Najita, J. R. 2008, Science, 319, 1504
- Ceccarelli et al. (2005) Ceccarelli, C., Dominik, C., Caux, E., Lefloch, B., & Caselli, P. 2005, ApJ, 631, L81
- Cernicharo et al. (2009) Cernicharo, J., Ceccarelli, C., Ménard, F., Pinte, C., & Fuente, A. 2009, ApJ, 703, L123
- D’Alessio et al. (2005) D’Alessio, P., Calvet, N., & Woolum, D. S. 2005, in Astronomical Society of the Pacific Conference Series, Vol. 341, Chondrites and the Protoplanetary Disk, ed. A. N. Krot, E. R. D. Scott, & B. Reipurth, 353–+
- de Graauw et al. (2010) de Graauw, T., Helmich, F. P., Phillips, T., et al. 2010, A&A, 518, L6
- Dick et al. (2010) Dick, M. J., Drouin, B. J., & Pearson, J. C. 2010, Phys. Rev. A, 81, 022706
- Dominik et al. (2005) Dominik, C., Ceccarelli, C., Hollenbach, D., & Kaufman, M. 2005, ApJ, 635, L85
- Dominik & Tielens (1997) Dominik, C. & Tielens, A. G. G. M. 1997, ApJ, 480, 647
- Dullemond & Dominik (2004) Dullemond, C. P. & Dominik, C. 2004, A&A, 421, 1075
- Dutrey et al. (1996) Dutrey, A., Guilloteau, S., Duvert, G., et al. 1996, A&A, 309, 493
- Dutrey et al. (1997) Dutrey, A., Guilloteau, S., & Guelin, M. 1997, A&A, 317, L55
- Faure et al. (2007) Faure, A., Crimier, N., Ceccarelli, C., et al. 2007, A&A, 472, 1029
- Fogel et al. (2010) Fogel, J. K. J., Bethell, T. J., Bergin, E. A., Calvet, N., & Semenov, D. 2010, ApJ, submitted
- Fraser et al. (2001) Fraser, H. J., Collings, M. P., McCoustra, M. R. S., & Williams, D. A. 2001, MNRAS, 327, 1165
- Furlan et al. (2006) Furlan, E., Hartmann, L., Calvet, N., et al. 2006, ApJS, 165, 568
- Guilloteau et al. (2006) Guilloteau, S., Piétu, V., Dutrey, A., & Guélin, M. 2006, A&A, 448, L5
- Habing (1968) Habing, H. J. 1968, Bull. Astron. Inst. Netherlands, 19, 421
- Hayashi (1981) Hayashi, C. 1981, Progress of Theoretical Physics Supplement, 70, 35
- Hollenbach et al. (2009) Hollenbach, D., Kaufman, M. J., Bergin, E. A., & Melnick, G. J. 2009, ApJ, 690, 1497
- Kessler-Silacci (2004) Kessler-Silacci, J. 2004, PhD thesis, Caltech
- Meijerink et al. (2009) Meijerink, R., Pontoppidan, K. M., Blake, G. A., Poelman, D. R., & Dullemond, C. P. 2009, ApJ, 704, 1471
- Najita et al. (2001) Najita, J., Bergin, E. A., & Ullom, J. N. 2001, ApJ, 561, 880
- Nomura et al. (2007) Nomura, H., Aikawa, Y., Tsujimoto, M., Nakagawa, Y., & Millar, T. J. 2007, ApJ, 661, 334
- Öberg et al. (2009) Öberg, K. I., Linnartz, H., Visser, R., & van Dishoeck, E. F. 2009, ApJ, 693, 1209
- Piétu et al. (2007) Piétu, V., Dutrey, A., & Guilloteau, S. 2007, A&A, 467, 163
- Pilbratt et al. (2010) Pilbratt, G., Riedinger, J. R., Passvogel, T., et al. 2010, A&A, 518, L1
- Pontoppidan et al. (2010) Pontoppidan, K. M., Salyk, C., Blake, G. A., et al. 2010, ApJ, 00, in press
- Salyk et al. (2008) Salyk, C., Pontoppidan, K. M., Blake, G. A., et al. 2008, ApJ, 676, L49
- Schöier et al. (2005) Schöier, F. L., van der Tak, F. F. S., van Dishoeck, E. F., & Black, J. H. 2005, A&A, 432, 369
- van Dishoeck et al. (2006) van Dishoeck, E. F., Jonkheid, B., & van Hemert, M. C. 2006, in Faraday Discussions, Vol. 133, Faraday Discussions, 231
- Weidenschilling & Cuzzi (1993) Weidenschilling, S. J. & Cuzzi, J. N. 1993, in Protostars and Planets III, ed. E. H. Levy & J. I. Lunine, 1031–1060
- White & Ghez (2001) White, R. J. & Ghez, A. M. 2001, ApJ, 556, 265