-
Spatially Resolved Spectroscopy of Starburst and Post–Starburst Galaxies in The Rich z Cluster CL 0016+161
Abstract: We have used the Low Resolution Imaging Spectrograph (LRIS) on the W.M. Keck I telescope to obtain spatially resolved spectroscopy of a small sample of six ‘post–starburst’ and three ‘dusty–starburst’ galaxies in the rich cluster CL 0016+16 at . We use this to measure radial profiles of the H and OII lines which are diagnostic probes of the mechanisms that give rise to the abrupt changes in star–formation rates in these galaxies. In the post–starburst sample we are unable to detect any radial gradients in the H line equivalent width – although one galaxy exhibits a gradient from one side of the galaxy to the other. The absence of H gradients in these galaxies is consistent with their production via interaction with the intra–cluster medium, however, our limited spatial sampling prevents us from drawing robust conclusions. All members of the sample have early type morphologies, typical of post–starburst galaxies in general, but lack the high incidence of tidal tails and disturbances seen in local field samples. This argues against a merger origin and adds weight to a scenario where truncation by the intra–cluster medium is at work. The post–starburst spectral signature is consistent over the radial extent probed with no evidence of OII emission and strong H absorption at all radii i.e. the post-starburst classification is not an aperture effect. In contrast the ’dusty–starburst’ sample shows a tendency for a central concentration of OII emission. This is most straightforwardly interpreted as the consequence of a central starburst. However, other possibilities exist such as a non-uniform dust distribution (which is expected in such galaxies) and/or a non-uniform starburst age distribution. The sample exhibit late type and irregular morphologies.
Keywords: galaxies: clusters: individual (CL 0016+16) — galaxies: evolution — galaxies: starbursts
1 Introduction
Some of the first direct evidence for the redshift evolution of galaxy populations came from observations of galaxies residing in the cores of rich galaxy clusters. In the local universe, galaxies in these environments show little sign of active, or recent, star–formation. However the photometric observations of Butcher & Oemler (1978, 1984) of cluster galaxies at intermediate redshift revealed a large increase in the fraction of blue galaxies present. Spectroscopic studies have established the increased blue fraction is the result of an increase in the fraction of galaxies which are actively forming stars in clusters at these redshifts (e.g. Dressler & Gunn 1982, 1983, 1992; Couch & Sharples 1987; Couch et al. 1994; Poggianti et al. 1999). This implies that significant and, somewhat, rapid evolution has taken place in these environments over the last 3–5 Gyrs.
In addition to the Butcher & Oemler (1978) effect, spectroscopic observations of intermediate redshift clusters also resulted in the discovery of a new class of galaxy which lacked optical emission lines but had strong Balmer absorption lines (Dressler & Gunn 1983). The absence of emission lines implies no ongoing star–formation whilst the strong Balmer absorption lines requires a substantial contribution of light from A-stars. Such a spectroscopic signature requires a strong episode of star–formation which has been rapidly truncated within the past Gyr (Couch & Sharples 1987; Poggianti et al. 1999). These galaxies represent a population of ‘post–starburst galaxies’ (also referred to as k+a, a+k or E+A galaxies) which are observed in the midst of rapid evolution in their star-formation properties and may mark the transition of a star-forming disk galaxy into a quiescent spherical system (Caldwell et al. 1996; Zabludoff et al. 1996). Another class of galaxies with strong H absorption lines are the e(a) galaxies, which possess strong H absorption in conjunction with mild [OII] emission (Dressler et al. 1999). Whilst it is possible to produce such a spectrum by having a small amount of residual star–formation in a post–starburst galaxy, the evidence points to these galaxies being dust enshrouded starbursts (Poggianti et al. 1999; Poggianti & Wu 2000). These galaxies are commonly observed ( 75 per cent of cases) to be undergoing mergers or strong interactions (Poggianti & Wu 2000). At intermediate redshift e(a) galaxies are common in both clusters and the field (Poggianti et al. 1999; Dressler et al. 1999, 2004; Poggianti et al. 2009) suggesting that the presence of a dusty starburst in not caused by the cluster environment. At these redshifts the frequency of E+A galaxies in the cluster environment is strongly enhanced (Dressler et al. 1999; Tran et al. 2004; Poggianti et al. 2009) and argues that a cluster-specific mechanism is involved. This environmental dependence (and the overall frequency) of e(a) galaxies precludes all of them being precursors to the E+A phase (Poggianti et al. 2009); however, they may represent the progenitors of some of the E+A population.
The physical mechanisms that drive the galaxy evolution occurring in rich clusters remains an unresolved issue. There are a plethora of possibilities including: major galaxy mergers (Mihos & Hernquist 1996; Bekki et al. 2005), unequal mass mergers (Bekki et al. 2001), galaxy interactions (Bekki et al. 2005), interactions with the cluster tidal field (Bekki 1999), galaxy harassment (Moore et al. 1996) and interaction with the hot intra–cluster gas (Gunn & Gott 1972; Dressler & Gunn 1983; Bothun & Dressler 1986). In the local field there is mounting evidence that the formation mechanism for post starburst galaxies involves galaxy–galaxy mergers and interactions (Zabludoff et al. 1996; Norton et al. 2001; Blake et al. 2004; Yamauchi & Goto 2005; Goto et al. 2008; Yang et al. 2008; Pracy et al. 2009). Such galaxies are rare in all environments at the present epoch and the cluster environment is not strongly preferred (Blake et al. 2004). However, at intermediate redshift the frequency of these galaxies is strongly enhanced in the cluster environment (Dressler et al. 1999; Tran et al. 2004; Poggianti et al. 1999) and this hints that a cluster specific mechanism is at work, at least in part, with ram pressure stripping being a favored candidate (Poggianti et al. 1999, 2009).
Understanding the progenitor populations of post-starburst galaxies at low redshift has been progressed significantly via spatially resolved optical spectroscopy (Norton et al. 2001; Pracy et al. 2009). The internal kinematics and distribution of the young and old stellar populations convey important information about the processes that resulted in the starburst and its cessation. Tidal interactions and in particular major galaxy mergers are expected to result in a centrally-concentrated burst of star–formation and hence a strong enhancement in the Balmer line absorption in the central regions of the galaxy during the subsequent post-starburst phase (Noguchi 1988; Barnes & Hernquist 1991; Mihos et al. 1992; Mihos & Hernquist 1996; Bekki et al. 2005; Bournaud et al. 2008). In contrast, uniform truncation of star–formation in a star-forming galaxy, as would be expected from ram-pressure stripping by the intra–cluster medium (ICM), should result in a more distributed young stellar population and hence Balmer absorption signature (Rose et al. 2001; Bekki et al. 2005; Pracy et al. 2005). In addition, these two different scenarios are expected to produce systems that are quite different kinematically: If major galaxy mergers are the trigger, then they would (in general) destroy any disk rotation and the remnant should be pressure-supported. In contrast, other less violent mechanisms will allow rotation to persist in the remnant galaxy (Bekki et al. 2005; Pracy et al. 2009). In this context the results from spatially resolved spectroscopic studies of E+A galaxies at low redshift (Norton et al. 2001; Pracy et al. 2009) have been divided as to the trigger mechanism. Norton et al’s (2001) long-slit spectroscopy of a significant number of the E+A’s from the original Zabludoff et al. (1996) sample, found in the majority of cases that the young post-starburst population was centrally-concentrated and its kinematics was consistent with it being pressure-supported, indicative of a major-merger origin. Pracy et al. (2009)’s two-dimensional integral field unit (IFU) spectroscopy of a similarly selected sample of nearby E+A galaxies, on the other hand, found them all to have no detectable gradient in Balmer absorption line strength across their central regions and exhibit significant rotation, pointing to either a minor merger or some other less violent formation mechanism.
At higher redshifts (), the situation is equally unclear, due largely to the dearth of spatially resolved spectroscopic information on E+A galaxies, which at these earlier epochs mostly reside in rich clusters. The only major such study to be undertaken is that of Pracy et al. (2005), who obtained IFU spectroscopy of 12 E+A galaxies in the rich cluster, AC 114, at . They found quite diverse behaviour in the spatial distribution of the young stellar populations within their sample and interpreted this as the result of both major mergers and truncation by the intra–cluster medium as playing important roles in making up the cluster post-starburst population.
In order to more thoroughly investigate and understand the mechanisms responsible for E+A formation in intermediate redshift clusters, we have commenced an observational program aimed at significantly increasing the amount of high quality spatially resolved spectroscopy of E+A galaxies in these systems. In this paper we present the initial pilot observations made for this program, where we exploited the excellent image quality and light-gathering power of the 10m W. M. Keck I telescope to obtain spatially resolved spectroscopy of E+A galaxies (as well as their ”e(a)” progenitors) in the rich cluster CL 0016+16 at . Although at this redshift such observations are very challenging in being able to sufficiently resolve, spatially, the distribution and kinematics of the young stellar population that are key to discriminating between different formation mechanisms, we demonstrate that in the very best (0.4 arcsec) seeing conditions this is possible.
The plan of the paper is as follows: In the next section we describe the selection of our E+A targets, their observation with the Low Resolution Imaging Spectrograph (LRIS), and the reduction of the data. We present our results in Section 3, included in which is new information on the morphologies of our target galaxies derived from deep Hubble Space Telescope images. In Section 4 we describe detailed modelling we have undertaken to understand the impact of the smearing effects of seeing on our observations and our ability to discern spatial structure. We discuss our finding and summarise our conclusions in the final section. Throughout the paper we convert from observed to physical units assuming a , and cosmology, noting that at the redshift of CL 0016+16, 1 arcsecond corresponds to 6.4 kpc.
2 Observations and data reduction
2.1 Input catalogue
CL 0016+16 is a cluster rich in post-starburst galaxies, with a total of 10 objects identified as ”k+a”, ”a+k”, ”a+k/k+a” in the spectroscopic studies of Dressler & Gunn (1992) and Dressler et al. (1999). These studies also identified a small number of (3) dusty starburst galaxies – denoted ”e(a)” by Dressler et al. (1999) – which may well be the progenitors of the E+A population; these objects were also included in our initial pool of targets. All these objects were brighter than =22.25 mag, this being the magnitude limit of the original spectroscopy.
The final selection of targets for observation was made as part of the slit mask design process for LRIS, which was carried out using the AUTOSLIT3 program provided by the Keck Observatory. This program was first used in its interactive mode to select targets and assign slits to them, and then used to automatically grow the slits in an optimum way so as to use the full area of the LRIS detectors while at the same time work within the geometrical constraints imposed by the surface density of the targets, the minimum slit length requirements (set to 5.0 arcsec), and the length of the spectra on the detector. Of highest priority in this process was to select as many E+A types as possible, and then to assign any remaining slits to the e(a) galaxies. Another important feature of the AUTOSLIT3 program that was used was the ability to tilt the slits with respect to the spatial axis. This allowed us, in a few cases, to better align the slit with the major axis of the galaxy, which is highly desirable if rotation is to be measured.
Despite this extra degree of freedom in being able to tilt the slits (up to 30 degs relative to the spatial axis), the process of selecting targets and assigning slits to them was, in practice, highly constrained. Even with the use of two different masks, only 6 of the 10 E+A galaxies within the cluster could be observed, and the slit orientation with respect to the galaxies’ major axis was often far from optimum. The details of the final sample of objects that were observed are listed in Table 1, where the first six columns contain the identification number, the Right Ascension, the Declination, the redshift, the apparent magnitude , and the colour, all taken from Dressler & Gunn (1992). The three subsequent columns give the morphology of each galaxy (taken from Dressler et al. (1999)), its approximate orientation (face-on, edge-on, or ambiguous), and its spectral classification (also from Dressler et al. (1999)). As can be seen from the table, all three of the e(a) galaxies in CL 0016+16 were included in our final sample.
| Object id | RA(J2000) | Dec(J2000) | z | morph | orientation | spec type | spec type | ||
|---|---|---|---|---|---|---|---|---|---|
| (D99) | (this work) | ||||||||
| DG_106 | 00 18 36.19 | 16 25 7.0 | 0.5306 | 22.2 | 0.20 | Sb | face–on | a+k | a+k/k+a |
| DG_115 | 00 18 32.47 | 16 25 10.1 | 0.5485 | 21.5 | 0.51 | S0 | face–on | a+k/k+a | k+a |
| DG_134 | 00 18 36.81 | 16 25 17.7 | 0.5525 | 22.2 | 0.05 | Sa | face–on | a+k | k+a/a+k |
| DG_181 | 00 18 30.94 | 16 25 41.7 | 0.5628 | 21.6 | 0.47 | Sab | face–on | k+a | k+a |
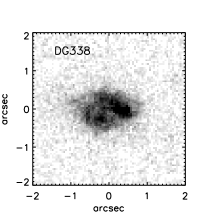
| DG_338 | 00 18 36.01 | 16 26 52.1 | 0.5570 | 22.2 | 0.42 | Sd/irr | ambiguos | e(a) | e(c)/e(a) |
| DG_352 | 00 18 31.58 | 16 26 56.6 | 0.5374 | 22.0 | 0.47 | S0 | edge–on | k+a/a+k | k+a |
| DG_356 | 00 18 29.50 | 16 26 57.9 | 0.5379 | 22.2 | 0.33 | Sd | edge–on | e(a) | e(a)/e(c) |
| DG_371 | 00 18 38.95 | 16 27 03.7 | 0.5630 | 20.8 | 0.57 | Sc | face–on | k+a/e(a) | k+a/e(c)/e(a) |
| DG_411 | 00 18 32.97 | 16 27 22.3 | 0.5339 | 21.9 | 0.34 | Irr | ambiguous | k+a | k+a/a+k |
2.2 LRIS spectroscopy
The observations were carried out on the W.M. Keck I telescope on the first half of the night of 2008 October 31, using the red camera on LRIS. The 600/7500 grism was used for our spectroscopy, which with the 0.75 arcsec slit width used for both masks, yielded a spectral resolution of 4.5 Å. This grism provides a wavelength window of 2620Å which was centred at Å thereby covering the range Å which corresponds to the interval 3680–5370Å in the cluster rest frame. The spatial sampling along the slit with this configuration was 0.21 arcsec per pixel.
Equal time was spent observing through each of the two masks designed for our observations (see above). Several objects (DG_134, DG_181, DG_352, DG_356, DG_371) were observed through both masks. The total integration time for each mask was 2 hours taken in s exposures and bounded by flat and arc-lamp observations on each side. The seeing was arcseconds throughout the observations taken with the first mask (hereafter Mask 1), and then it gradually increased to arcseconds over the course of the observations taken with the second mask (hereafter Mask 2).
2.3 Data reduction
The data were reduced using the automated LRISredux pipeline written by Matt Auger (priv comm). The pipeline consists of a set of Python routines which reduces the data to the point where each mask observation has been transformed to a set of 2-dimensional spectra (one for each slit) and resampled onto a distortion free lambda,y plane. Spatially resolved spectra along the slit are then extracted along individual rows. The spatial pixel scale is arcsec/pixel, which at the cluster redshift, corresponds to kpc/pixel. We extract the central (spatial) spectrum individually and then extract and add two adjacent spatial spectra moving outward from the centre until the signal-to-noise ratio becomes insufficient. In the same process the individual exposures are combined by identifying the same spatial bins in each exposure using the slit profiles. The result is a set of 1 dimensional spectra for each target corresponding to different spatial intervals along the slit. The final signal-to-noise ratio varies by object and radial position. The minimum and maximum mean continuum signal-to-noise ratios of the spatially resolved spectra used are 2.0 Å-1 and 11.0 Å-1, respectively. Note: the minimum value corresponds to the outskirts of an emission line galaxy where we get a much better signal-to-noise ratio in the emission lines. The minimum continuum signal-to-noise ratio in an absorption line system is 2.5 Å-1. The median and standard deviation are 6.7 Å-1 and 2.8 Å-1. We also perform an extraction of the full spatial extent of each galaxy to obtain an integrated spectrum.
2.4 Archival HST imaging
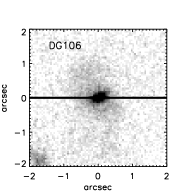
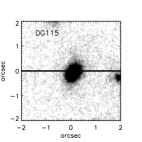
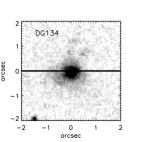
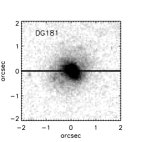
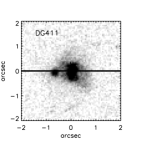
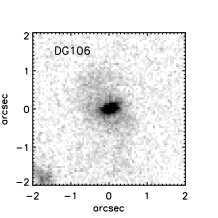
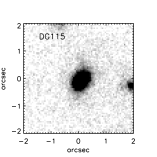
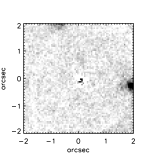
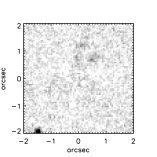
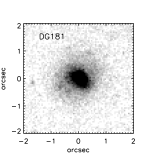
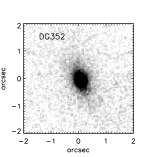
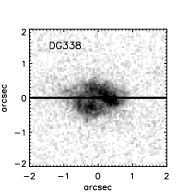
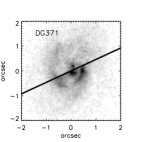
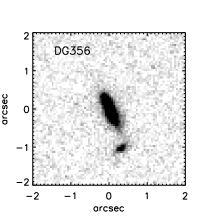
The cluster CL 0016+16 has been extensively imaged with HST using its Advanced Camera for Surveys (ACS). A mosaic of images covering a region of 5 arcmin by 5 arcmin centred on the cluster and taken in both the F775W and F606W filters (hereafter referred to as R and V, respectively) was acquired as part of the GTO program for this instrument (PI = H. Ford). The processed versions of these images were retrieved from the Hubble Legacy Archive to provide high spatial resolution photometry and morphological information for the galaxies studied here. In order to provide a visual indication of the morphology of each galaxy, postage-stamp images made from the HST ACS F775W frames are shown in the first columns of Figures 4-7. In Figures 4 and 6, these images are also used to show the orientation of each galaxy relative to the LRIS slit, the latter being shown by the thick horizontal line.
2.5 Integrated spectra
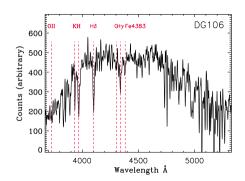
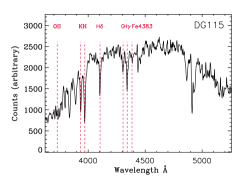
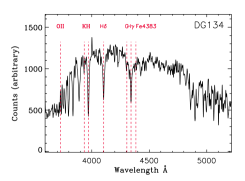
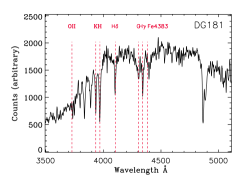
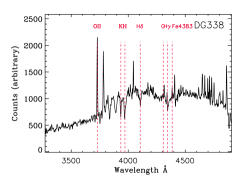
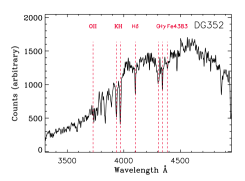
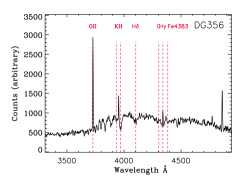
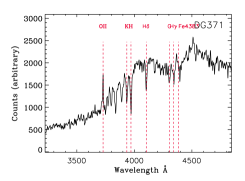
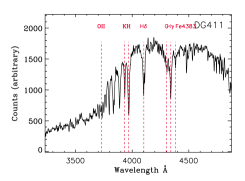
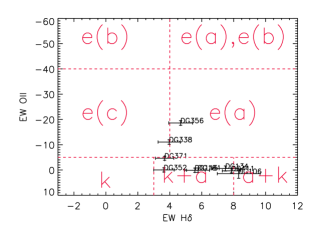
The integrated spectrum for each galaxy in our sample is shown in Figure 1. Of the sample of nine galaxies three have clear [OII] emission lines whilst the remaining six have absorption line spectra with strong Balmer lines. We measure line indices from the spectra using the standard flux summing technique where the area in the line is measured by summing the counts in a bandpass centered on the line and the continuum is estimated in two flanking bandpasses either side of the line. For the H line we use the standard lick index definition for H (Worthey & Ottaviani 1997) and for the [OII] line we define the bands as: 3700–3720Å (blue continuum), 3720–3734Å (line) and 3734–3754Å (red continuum). In Figure 2 we plot the positions of our sample in the equivalent width [OII] versus equivalent width H plane. The regions in this plane that define the different spectral classes of Dressler et al. (1999) are overlaid. Six of our galaxies sit neatly in the post–starburst (k+a and a+k) regions of this plane111we shall hereafter refer to the k+a and a+k types collectively as E+A galaxies, and two lie in the star-forming regions [e(a) and e(c)]. One galaxy, DG_371, occupies a position on the boundary of these two regions. The integrated spectrum of DG_371 in Figure 1 reveals a highly significant detection of [OII] and the spectrum is very similar to that of the other two e(a) galaxies (DG_356 and DG_338). With high quality spectra like those shown in Figure 1, it is reasonable to choose a tighter equivalent width constraint on the [OII] line in delimiting emission and absorption line systems; indeed an equivalent width of 2.5Å is a more common definition (e.g. Zabludoff et al. 1996; Blake et al. 2004; Goto 2007). We therefore treat DG_371 as an e(a) system. In the last column of Table 1, we include our new spectral classifications, where we give multiple spectral classifications for a single object when it’s 1 error bar overlaps more than one region. While there are minor differences between our classifications and the original ones of Dressler et al. (1999) (listed in the previous column), there is generally good agreement overall.
The spatial distribution of the strength of absorption lines such as H in E+A galaxies is not expected to be constant but to depend on the time that has elapsed since the truncation of the starburst (Pracy et al. 2005; Bekki et al. 2005). It is, therefore, useful to have an estimate for the age of the young stellar population in our E+A sample. In order to estimate the age of the young stellar population, we fit the E+A galaxy spectra with a set of single-age single-metallicity stellar population synthesis models (Vazdekis et al. 2007). The fitting is performed using a penalized pixel fitting algorithm (Cappellari & Emsellem 2004). The templates used range in age from 0.1 Gyr to 2 Gyr with age spacing of Gyr. We also include two older templates of ages Gyr and Gyrs to account for the underlying old population – although we note that E+A light at these wavelengths is very much dominated by the young stellar population (Pracy et al. 2009). We then calculate a pseudo age of the young population by taking the weighted age of the best fitting young single age stellar population model templates. This method of estimating the age of the young stellar population has been shown to be consistent with other age diagnostics (Pracy et al. 2009). In Figure 3 we show our age estimates plotted against colour for our E+A sample. The ages range from to Gyrs – consistent with their E+A status. As expected there is a strong correlation of age with galaxy colour (e.g. Couch & Sharples 1987).

3 Results
3.1 Post-starburst galaxies
Six of the nine galaxies in our sample have integrated spectra indicative of post–starburst galaxies with strong Balmer absorption lines but lacking optical emission lines: DG_106, DG_115, DG_134, DG_181, DG_352, and DG_411. We now present the results of our spatially resolved spectroscopy of these objects, as well as our reanalysis of their morphologies based on HST imaging.
3.1.1 Spatially resolved spectroscopy
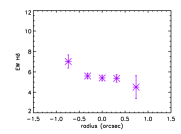
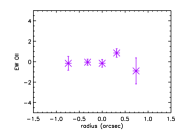
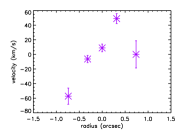
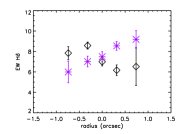
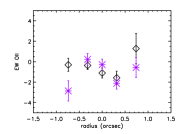
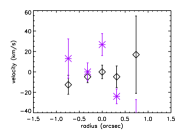
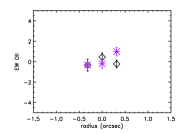
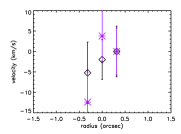
In the columns 2–4 of Figure 4 we show the radial profiles along the slit of the H equivalent width, the [OII] equivalent width, and the streaming velocity for our sample of post-starburst galaxies, respectively. Measurements made from the Mask 1 observations are plotted as black symbols and measurements made from the Mask 2 observations are plotted as blue symbols. Several targets were observed in both masks, which allows a check on the repeatability of our measurements. The Mask 1 observations were taken in better (0.4 arcsec) seeing, resulting in better delivered spatial resolution. Seeing has the effect of smearing out any radial gradients as the data points become more correlated as the image quality worsens. In principle this means it may be possible to detect radial trends in Mask 1 data that cannot be seen in Mask 2.
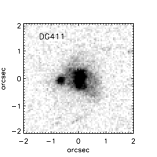
The extracted radial data only extend over a few spatial resolution elements. This combined with the moderate signal–to–noise of the line index measurements makes it difficult to detect weak radial variations (see Section 4 for a more detailed discussion). The equivalent width profiles show no evidence of any central enhancement (or deficit) or any radial gradients (either positive or negative), with the H equivalent width being uniformly strong across all the galaxies and there being no sign of [OII] emission at any radii. The exception is DG_411 which shows evidence for a gradient in H equivalent width from one side of the galaxy to the other. This galaxy also has a nearby companion evident in the HST image. There is some evidence for rotation in two of the sample galaxies (DG_115 and DG_181); however, given the sometimes non-optimal orientations of the slit and mostly face–on nature of the sample, we would not expect to see significant rotation in all cases.


3.1.2 Morphological properties
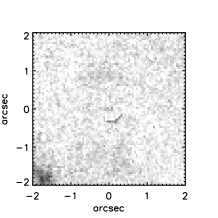
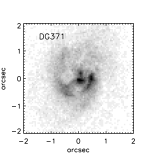
Visual inspection of the R-band postage-stamp images shown in the first column of Figure 4 (and displayed again in the first column of Figure 5 reveals that all of the post-starburst galaxies are bulge-dominated early-type systems – which is true of E+As generally (Dressler et al. 1999). However, while E+A galaxies in local field samples commonly display early type morphologies, they also display a high incidence of interactions, disruption and tidal tails (Zabludoff et al. 1996; Norton et al. 2001; Blake et al. 2004; Yamauchi & Goto 2005; Goto et al. 2008; Yang et al. 2008; Pracy et al. 2009). With the exception of DG_411, there is no obvious sign of tidal disruption in this sample.
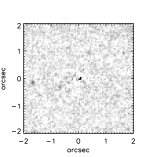
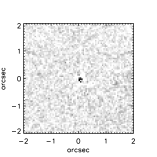
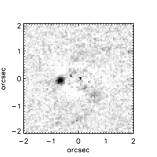
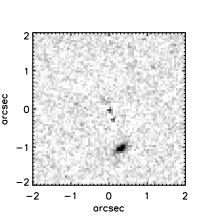
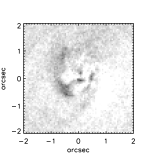
To investigate this more thoroughly, we used the iraf tasks ellipse and bmodel to produce symmetric elliptical model images for the E+A galaxies and then subtracted the models from the data in order to look for evidence of irregularities or tidal disruption. This technique has been used on local E+A field samples and has revealed a high incidence of morphological disturbance (Yang et al. 2008; Pracy et al. 2009). Such features have been used as evidence for a merger or tidal interaction origin in these populations. The model-subtracted images are shown in the second column of Figure 5 and show no evidence of disruption or underlying tidal features – again with the exception of DG_411 which has a companion and tidal tail. This is in distinct contrast to local field samples and argues in favor of truncation by the ICM over mergers as the mechanism involved in producing these E+As.
One caveat when comparing our study with local samples is that the ability to detect tidal features is sensitive to the surface brightness limits probed. Our HST/ACS imaging is intrinsically deeper than the local HST/ACS study of Yang et al. (2008) with an integration time of 2200 s (in the F775W passband) compared with their 900 s integration (in the F625W passband). However, the cosmological surface brightness dimming due to the higher redshift of our targets reduces our ability to detect faint features. Assuming a redshift for our target galaxies of and a typical redshift of the Yang et al. (2008) sample of the relative effect of cosmological dimming is a factor of . Note the different passbands and redshifts of the observations partially cancel out making the restframe wavelength range of the imaging similar in both samples, with the high redshift observations 500Å bluer. For the detection of faint features the imaging is in the background limited regime and the signal-to-noise ratio scales as the square root of the ratio of the exposure times. Taking both of these effects into account, and neglecting the small differences in filter sensitivity and restframe wavelength, the true ‘restframe surface brightness limit’ of the Yang et al. (2008) study is mag fainter. Although many of the tidal features in the low redshift data are generally clear–cut we cannot entirely rule out that some faint tidal features that would be detected in the low redshift data are missed in our imaging.
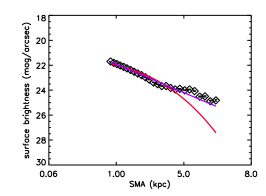
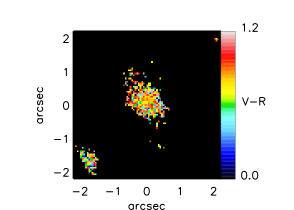
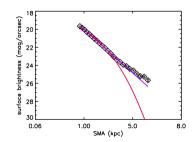
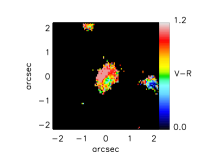
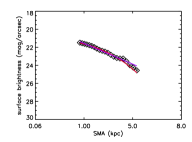
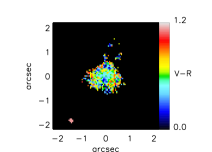
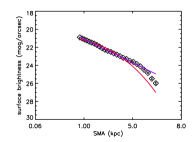
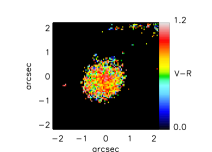
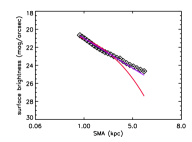
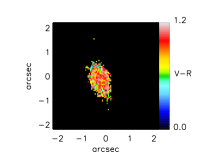
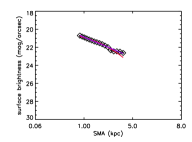
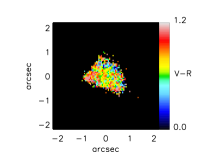
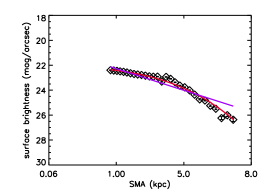
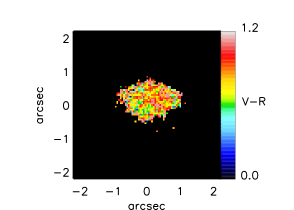
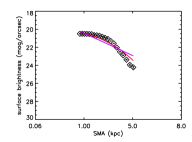
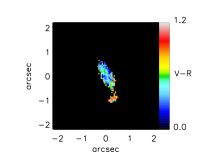
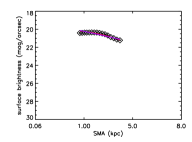
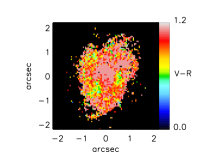
In the third column of Figure 5 we show the isophotal profiles measured with the ellipse task along with the best fitting exponential profile (red line) and de Vaucouleurs profile (blue line). We only show isophotes at radii larger than the FWHM of the HST ACS point spread function to avoid any issues caused by bluring near the resolution limit on the galaxy profiles. For the most part the isophotal profile are well fitted by a de Vaucouleurs profile profile. DG_134 and DG_181 have an exponential disk–like component. In the final column of Figure 5 we show V-R colour maps. Local field samples show variation in the colour properties of E+As with examples of uniform distributions, red centres, blue centres and irregular colour distributions (Yang et al. 2008; Pracy et al. 2009). Although the signal-to-noise ratio of the maps in Figure 5 is moderate there does appear to be diversity among the sample with examples of uniform (DG_106), blue centre (DG_134), red centre (DG_181 and DG_352) and irregular (DG_115) colour distributions. In most cases these gradients are not very pronounced.

3.2 Star forming galaxies
The remaining three galaxies in our sample are star–forming galaxies with clear [OII] emission. These three galaxies (DG_338, DG_356, DG_371) are consistent with an e(a) spectral classification within their 1 error bars.
3.2.1 Spatially resolved spectroscopy
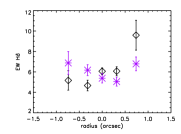
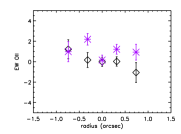
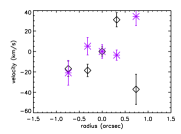
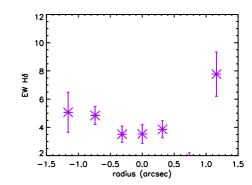
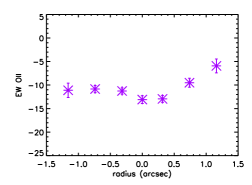
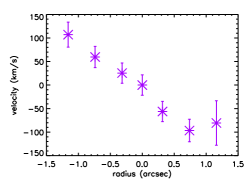
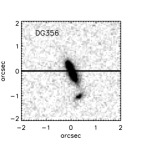
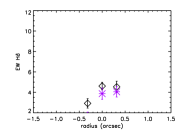
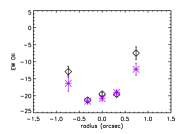
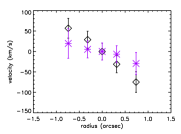
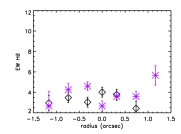
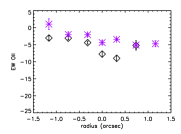
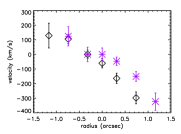
In identical fashion to Figure 4, the radial profiles along the slit of the H equivalent width, the [OII] equivalent width, and the streaming velocity for these 3 e(a) galaxies are shown in columns 2–4 of Figure 6, respectively. As in the case of the E+A galaxies, we do not detect any radial gradient in the H line. We do, however, see a trend in the radial distribution of the [OII] equivalent width in the sense that the equivalent width of the emission line is stronger at small radii (i.e. larger negative equivalent width at small radii). This trend is apparent in all three galaxies. In the case of DG_356 (second row in Figure 6) the slit is near to perpendicular to the major axis of the galaxy meaning the increase in emission line equivalent width is toward the plane of the disk. In DG_371 (3rd row in Figure 6) we see a more pronounced central concentration in the better quality Mask 1 data than in the Mask 2 data. This is likely an example of the inferior image quality during the Mask 2 observations smoothing out the profile. The high signal-to-noise ratio of the emission lines makes it easy to detect rotation in these galaxies. The projected rotation curves are shown in the final column of Figure 6 – again the difference in seeing between the two masks is evident in the damping of the amplitude of the curve in Mask 2.
3.2.2 Morphological properties
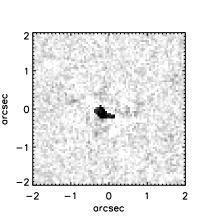
In Figure 7 we plot the same set of morphological and photometric diagnostics for the e(a) galaxies as we did for the E+As in Figure 5. The e(a) galaxies are all of late and irregular morphological type. The model subtracted images show significant residuals for two of the three (DG_338 and DG_371) galaxies and the asymmetry is also illustrated by the irregular isophotal profiles (third column of Figure 7). Although irregular, the isophotal profiles of the e(a)s are closer to exponential than de Vaucouleur profiles – compatible with their late type status. The morphological properties of the three e(a) galaxies is consistent with them being irregular and/or interacting systems.
4 The effects of seeing
As mentioned above, attempting to measure radial gradients in equivalent width is hampered by the convolution of the galaxy light with the seeing disk. This problem is a natural consequence of the expected angular scale of equivalent width gradients in E+A galaxies at this redshift being comparable to the seeing scale (Pracy et al. 2005). The observed radial gradients in line index strength depend on both the intrinsic spatial distribution of the line equivalent width and the overall distribution of the continuum light, after having suffered the smearing effects of the seeing (see Pracy et al. 2005, for an in-depth discussion of the convolution effects on spatially resolved spectroscopy, with an emphasis on IFU data). The convolution of the intrinsic radial gradient with the seeing disk always acts to flatten out any gradients.
Simulations of the expected H equivalent width gradients in E+A galaxies were performed by Pracy et al. (2005) for both merger and truncation scenarios (see also Bekki et al. (2005) for more detailed modeling of E+A galaxy formation and its observable effects). For each case, Pracy et al. (2005) simulated the radial H gradients at three different time steps. In the case of the merger model, the remnant galaxy possesses a strong negative H equivalent width gradient (stronger absorption toward the centre) contained within the central kpc in radius. As time progresses the strong central H equivalent width and gradient decrease as the A–star population dies out until the signature is gone after 1.5 Gyr. A different pattern is seen in the truncation model which begins with uniformly strong H and little gradient, and evolves with time to have a positive radial gradient. These models represent the only predictions in the literature of radial H gradients in E+A galaxies.
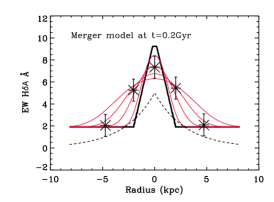
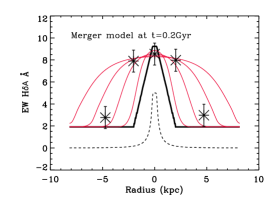
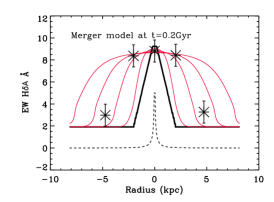
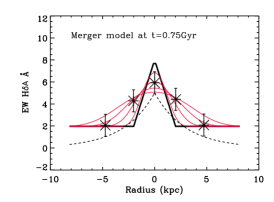
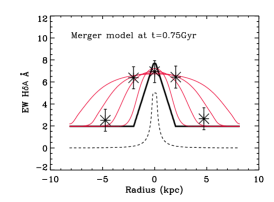
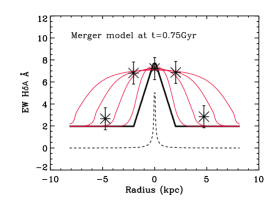


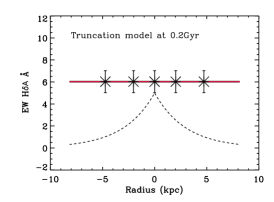
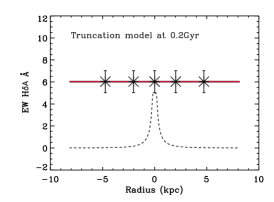

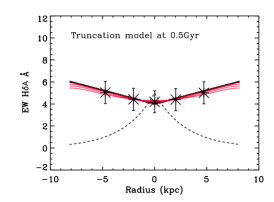


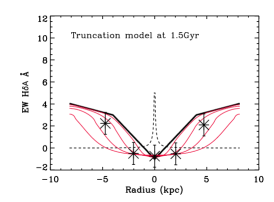
We used the model predictions of Pracy et al. (2005) as templates for investigating the effect of seeing on the intrinsic radial equivalent width profiles. We first approximate the Pracy et al. (2005) model H gradients as either simple linear functions of radius or piecewise two component linear functions. These are reasonable approximations – see Figures 9 and 10 of Pracy et al. (2005). We then created two dimensional spectra having these H equivalent width radial profiles. We did this by using a combination of two single–age stellar population (SSP) models from the MILES library (Vazdekis et al. 2007). In the combination we used an old ( Gyr) SSP to represent the old stellar population and a young SSP (with the nearest age to the time since the starburst in the Pracy et al. (2005) models) to represent the burst population, with the fractional contribution of each set so as to produce the required H equivalent width. These mock H gradients are shown as the solid black lines in Figure 8 for the merger model after 0.2 Gyr (top row); merger model after 0.75 Gyr (second row); merger model after 1.5 Gyr (third row); truncation model after 0.2 Gyr (4th row); truncation model after 0.5 Gyr (5th row); and truncation model after 1.5 Gyr (last row). Each one dimensional spectrum in the two dimensional array is then weighted depending on it’s radial position to represent the overall galaxy light profile. This is done for three different profiles: exponential disk with an effective radius of 5 kpc (1st column); a core–Sersic profile (Graham et al. 2003) with , a flat 200 pc core and an effective radius of 2 kpc (middle column); and a de Vaucouleurs profile with an effective radius of 2 kpc (third column). Since the de Vaucouleurs surface brightness becomes unrealistically large at small it was truncated within the central 40 pc. Using these three profiles gives a series of increasing central concentrations. The effective radius values are typical for such galaxies and are similar to the values obtained by the fits in Figure 5. These galaxy light profiles are shown by the dashed lines in Figure 8. We then convolved our two dimensional spectra in the spatial direction with a Gaussian of widths representing seeing of 0.2, 0.4, 0.6, and 0.8 arcseconds. Note that the seeing in our observations ranged from 0.4 to 0.8 arcseconds. These seeing convolved profiles are shown as the solid red curves in Figure 8. Since binning the data is also affected by the galaxy light profile we reproduce our observational binning for the 0.4 arcsecond case on Figure 8 as the black stars. The error bars are 1Å and are representative of the errors on the line indices in our observational data.
Immediately evident from Figure 8 is that the central concentration of galaxy continuum light has a significant effect on how much the radial gradients are smoothed out. This is because the more centrally concentrated the overall galaxy continuum light is the more it’s spectral signature contaminates the light at other radii when the galaxy image is smeared by the seeing. This can be seen in the progression across a row in Figure 8 going from the least centrally concentrated exponential profile to the most concentrated de Vaucouleur profile. Note that the exponential profile is typical of disk galaxies whilst the core–Sersic and de Vaucouleur profiles are typical of early type galaxies – which, in general, includes E+A samples and the majority of our sample. Of course in cases (such as the 3rd and 4th rows in Figure 8) where the intrinsic profiles are flat they remain so after smearing. Another point to note from Figure 8 is that at the spatial resolution of our observations the central burst of a merger model can be flattened to appear similar to a truncation model, for example, compare the Merger model at 0.75 Gyr and de Vaucouleur profile with that of the 0.2 Gyr truncation model for the cases of 0.6 and 0.8 arcsecond seeing. It is also important to note how sensitive the gradients are to seeing given the radial coverage of our data. While the models suggest that we should be able to detect these kinds of gradients in our outermost bins for the 0.4 arcsecond seeing case, this becomes marginal at 0.6 arcseconds and the merger profiles are close to flat for 0.8 arcsecond seeing. Qualitatively, Figure 8 suggests that the resolution and depth of our observations are around that where we should expect to make marginal detections of radial H equivalent width gradients in galaxies if they were present. This is particularly so for the ‘younger’ ( Gyr) galaxies in our sample (DG_134, DG_106,DG_411) where more extreme gradients are expected.
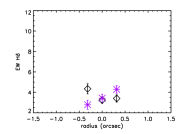
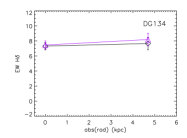
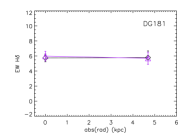
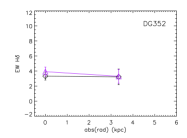
Another important feature of our radial H equivalent width profile predictions in Figure 8 is that they show the central enhancement (in the case of the merger scenario) or deficit (in the case of the truncation scenario) is contained within the central 4 kpc (2 kpc in radius). Therefore, in order to maximize our chances of detecting any gradient in H strength that might exist, we have extracted and combined our spatially resolved spectra of the E+A sample in this manner (i.e. inside and outside the central 4 kpc) and remeasured the H equivalent widths. These two point equivalent width radial profiles are shown in Figure 9. For all six galaxies, no significant gradient if found to be present.


5 Discussion and Summary
The enhancement in the frequency of E+A galaxies in intermediate redshift clusters relative to the field implies that a cluster-specific phenomenon, such as interaction with the ICM, should be responsible for the truncation of the star–formation in a significant fraction of the E+A galaxies in these environments (Poggianti et al. 1999). At face value our observations are in agreement with this expectation. The lack of radial gradients in H equivalent width in our E+A sample is consistent with the ICM being responsible for the truncation of the star formation via gas stripping processes (Rose et al. 2001; Bekki et al. 2005). However, the spatial resolution imposed on our observation by the seeing is similar to the spatial scale of the gradients expected in merger scenarios (Pracy et al. 2005; Bekki et al. 2005). Based on simple models of the effects of seeing marginal detection of H gradients in merger models could be expected from our observations (c.f. 2nd column of Figure 4 with the 2nd column of Figure 8). In addition our expectations for the expected gradients are based on just one set of merger simulations (Pracy et al. 2005; Bekki et al. 2005) and so whilst our spectroscopic observations are more consistent with a truncation model the conclusion is not robust and merger models cannot be ruled out. Given that our observations were taken on a 10-m telescope in nearly the best conditions that can be expected for natural seeing observations from the ground another strategy is required to advance these studies. Better spatial resolution spectroscopic observations of cluster E+As could be obtained by observing low-redshift galaxies where the physical size to angular size ratio is larger (although bright cluster E+A galaxies are extremely rare at the present epoch).
Further support for truncation by the ICM being an important source of the intermediate cluster E+A population is the distinct lack of evidence for tidal disturbance in our sample. A high incidence of tidal disruption and interaction is ubiquitous in low redshift E+A samples (Zabludoff et al. 1996; Norton et al. 2001; Blake et al. 2004; Yamauchi & Goto 2005; Goto et al. 2008; Yang et al. 2008; Pracy et al. 2009). While observing at higher redshift makes detection of such features more difficult, it should be noted that as a result of the superb image quality delivered by ACS/HST, our physical scale resolution is better than the low redshift studies with the exception of Yang et al. (2008)s low redshift HST observations.
The e(a) galaxies we observed do show a tendency to have centrally concentrated emission. This is likely evidence for a centralized starburst. A high fraction of e(a) galaxies are expected to be the result of mergers or tidal interactions (Poggianti & Wu 2000) and these processes are expected to give rise to a centralized starburst as gas is funnelled toward the galaxy centre (Noguchi 1988; Barnes & Hernquist 1991; Mihos et al. 1992; Mihos & Hernquist 1996; Bekki et al. 2005; Bournaud et al. 2008). However, these galaxies are also expected to have uneven dust and age distributions (Poggianti & Wu 2000) and it is difficult to draw conclusions about the distribution of star-formation in these objects without understanding the distribution of dust. The morphology of these galaxies are of very late type with evidence of disturbance or interactions as expected for e(a) galaxies and starbursts in general.
In Summary:
-
We do not detect any significant radial variation in the strength of the H line in any of the six post–starburst galaxies in our sample. However, we do detect a continuous gradient across the face of one galaxy in our sample, DG_411, which is also the one galaxy with evidence of a current interaction. The lack of H equivalent width gradients is consistent with their production being via interaction with the ICM. However, the scale of the expected gradients in merger models is similar to our spatial resolution element, making this conclusion uncertain.
-
In contrast to the local field there is little evidence for tidal disturbance, mergers or interactions in this intermediate redshift cluster sample of E+As. At low redshift such features have been interpreted as evidence for mergers in production of the E+A population. The lack of such features is consistent with ICM truncation of star formation.
-
The post–starburst signature is present at all radial points in each of the sample galaxies with uniformly strong Balmer line absorption and no [OII] emission present in any radial bin.
-
The three e(a) galaxies all show some evidence of centrally concentrated emission with the equivalent width of the [OII] line increasing toward the galactic centre. While one explanation for this is a centralized burst of star–formation the interpretation is clouded by not knowing the spatial distribution of the extinction.
-
The morphological properties of the e(a) galaxies are consistent with a merger/interaction origin.
Acknowledgments
The authors wish to recognize and acknowledge the very significant cultural role and reverence that the summit of Mauna Kea has always had within the indigenous Hawaiian community. We are most fortunate to have the opportunity to conduct observations from this mountain. We would like to thank Matt Auger for providing us with his pipeline reduction software for the LRIS instrument. Parts of this work are based on observations made with the NASA/ESA Hubble Space Telescope, and obtained from the Hubble Legacy Archive, which is a collaboration between the Space Telescope Science Institute (STScI/NASA), the Space Telescope European Coordinating Facility (ST-ECF/ESA) and the Canadian Astronomy Data Centre (CADC/NRC/CSA). M.B.P. and W.J.C. acknowledge the generous financial support of the Australian Research Council throughout the course of this work.
References
- Barnes & Hernquist (1991) Barnes, J. E., & Hernquist, L. E. 1991, ApJ, 370, L65
- Bekki (1999) Bekki, K. 1999, ApJ, 510, L15
- Bekki et al. (2005) Bekki, K., Couch, W. J., Shioya, Y., & Vazdekis, A. 2005, MNRAS, 359, 949
- Bekki et al. (2001) Bekki, K., Shioya, Y., & Couch, W. J. 2001, ApJ, 547, L17
- Blake et al. (2004) Blake, C., Pracy, M. B., Couch, W. J., Bekki, K., Lewis, I., & and 26 other authours. 2004, MNRAS, 355, 713
- Bothun & Dressler (1986) Bothun, G. D., & Dressler, A. 1986, ApJ, 301, 57
- Bournaud et al. (2008) Bournaud, F., Bois, M., Emsellem, E., & Duc, P. A. 2008, Astron. Nachr., in press
- Butcher & Oemler (1978) Butcher, H., & Oemler, Jr., A. 1978, ApJ, 226, 559
- Butcher & Oemler (1984) —. 1984, ApJ, 285, 426
- Caldwell et al. (1996) Caldwell, N., Rose, J. A., Franx, M., & Leonardi, A. J. 1996, AJ, 111, 78
- Cappellari & Emsellem (2004) Cappellari, M., & Emsellem, E. 2004, PASP, 116, 138
- Couch et al. (1994) Couch, W. J., Ellis, R. S., Sharples, R. M., & Smail, I. 1994, ApJ, 430, 121
- Couch & Sharples (1987) Couch, W. J., & Sharples, R. M. 1987, MNRAS, 229, 423
- Dressler & Gunn (1982) Dressler, A., & Gunn, J. E. 1982, ApJ, 263, 533
- Dressler & Gunn (1983) —. 1983, ApJ, 270, 7
- Dressler & Gunn (1992) —. 1992, ApJS, 78, 1
- Dressler et al. (2004) Dressler, A., Oemler, Jr., A., Poggianti, B. M., Smail, I., Trager, S., Shectman, S. A., Couch, W. J., & Ellis, R. S. 2004, ApJ, 617, 867
- Dressler et al. (1999) Dressler, A., Smail, I., Poggianti, B. M., Butcher, H., Couch, W. J., Ellis, R. S., & Oemler, A. J. 1999, ApJS, 122, 51
- Goto (2007) Goto, T. 2007, MNRAS, 381, 187
- Goto et al. (2008) Goto, T., Kawai, A., Shimono, A., Sugai, H., Yagi, M., & Hattori, T. 2008, ArXiv e-prints, 801
- Graham et al. (2003) Graham, A. W., Erwin, P., Trujillo, I., & Asensio Ramos, A. 2003, AJ, 125, 2951
- Gunn & Gott (1972) Gunn, J. E., & Gott, J. R. I. 1972, ApJ, 176, 1
- Mihos & Hernquist (1996) Mihos, J. C., & Hernquist, L. 1996, ApJ, 464, 641
- Mihos et al. (1992) Mihos, J. C., Richstone, D. O., & Bothun, G. D. 1992, ApJ, 400, 153
- Moore et al. (1996) Moore, B., Katz, N., Lake, G., Dressler, A., & Oemler, A. 1996, Nat, 379, 613
- Noguchi (1988) Noguchi, M. 1988, A&A, 203, 259
- Norton et al. (2001) Norton, S. A., Gebhardt, K., Zabludoff, A. I., & Zaritsky, D. 2001, ApJ, 557, 150
- Poggianti et al. (1999) Poggianti, B. M., Smail, I., Dressler, A., Couch, W. J., Barger, A. J., Butcher, H., Ellis, R. S., & Oemler, A. J. 1999, ApJ, 518, 576
- Poggianti & Wu (2000) Poggianti, B. M., & Wu, H. 2000, ApJ, 529, 157
- Poggianti et al. (2009) Poggianti, B. M., et al. 2009, ApJ, 693, 112
- Pracy et al. (2005) Pracy, M. B., Couch, W. J., Blake, C., Bekki, K., Harrison, C., Colless, M., Kuntschner, H., & de Propris, R. 2005, MNRAS, 359, 1421
- Pracy et al. (2009) Pracy, M. B., Kuntschner, H., Couch, W. J., Blake, C., Bekki, K., & Briggs, F. 2009, MNRAS, 396, 1349
- Rose et al. (2001) Rose, J. A., Gaba, A. E., Caldwell, N., & Chaboyer, B. 2001, AJ, 121, 793
- Tran et al. (2004) Tran, K., Franx, M., Illingworth, G. D., van Dokkum, P., Kelson, D. D., & Magee, D. 2004, ApJ, 609, 683
- Vazdekis et al. (2007) Vazdekis, A., et al. 2007, in IAU Symposium, Vol. 241, IAU Symposium, ed. A. Vazdekis & R. F. Peletier, 133–137
- Worthey & Ottaviani (1997) Worthey, G., & Ottaviani, D. L. 1997, ApJS, 111, 377
- Yamauchi & Goto (2005) Yamauchi, C., & Goto, T. 2005, MNRAS, 359, 1557
- Yang et al. (2008) Yang, Y., Zabludoff, A. I., Zaritsky, D., & Mihos, J. C. 2008, ApJ, 688, 945
- Zabludoff et al. (1996) Zabludoff, A. I., Zaritsky, D., Lin, H., Tucker, D., Hashimoto, Y., Shectman, S. A., Oemler, A., & Kirshner, R. P. 1996, ApJ, 466, 104