Lifetime and Coherence of Two-Level Defects in a Josephson Junction
Abstract
We measure the lifetime () and coherence () of two-level defect states (TLSs) in the insulating barrier of a Josephson phase qubit and compare to the interaction strength between the two systems. We find for the average decay times a power law dependence on the corresponding interaction strengths, whereas for the average coherence times we find an optimum at intermediate coupling strengths. We explain both the lifetime and the coherence results using the standard TLS model, including dipole radiation by phonons and anti-correlated dependence of the energy parameters on environmental fluctuations.
pacs:
03.65.Yz, 74.50.+r, 85.25.Dq, 77.84.BwTwo-level defects in amorphous insulators are of fundamental interest due to their impact on many low temperature properties, such as the heat conductivity Phillips1987 (1) and the generation of noise Shnirman2005 (2, 3). On the practical side, these effects limit the operation of solid state devices, for example amplifiers Kirton1989 (4) and CCD detectors Saks1980 , and increase the dielectric loss of insulators Martinis2005 .
Recently, a new type of solid state device has emerged in which quantum coherence is maintained over a large distance. In particular, superconducting Josephson qubits allow one to study quantum coherence at the macroscopic level Shumeiko2005 . Two-level defects in their amorphous oxide tunnel barriers (usually made of AlOx () Tan2005 ) have been found to limit the performance of these devices Cooper2004 ; Martinis2005 ; Lucero2008 . In the phase qubit, it was found that at certain biases the qubit is strongly coupled to spurious two-level states (TLSs) which result in free oscillations with the qubit and effectively reduce its coherence Simmonds2004 . Similar effects have been observed in the flux qubit as well Lupaccu2009 , although these are less common due to its smaller junction. Supercondcuting qubits hold promising features for the implementation of quantum information processing devices, however a significant improvement in defect density is required for future progress.
These defects are thought to arise from charge fluctuators in the insulating material of the junction, presumably O-H bonds Martinis2005 . Measurements on dielectrics at high temperature and power combined with measurements on the phase qubit at low temperature strongly support a two-level model for these fluctuators, emerging from tunneling between two configurational states of the charge inside the junction. The notion of coupling of the phase qubit to a strongly anharmonic microscopic system was further fortified through careful analysis of the multilevel spectrum of the phase qubit near resonance with a defect Ustinov2010 . Neeley et al. have demonstrated coherent control over a single defect, and characterized its coherence and relaxation time Neeley2008b . Other attempts are being made to reduce the impact of defects by improving junction materials using epitaxial growth Pappas2006 or by fabricating dielectric free junctions Tettamanzi2006 .
Several mechanisms have been proposed for relaxation and dephasing of the dielectric defects themselves. Energy relaxation is caused by coupling to phonon states, while dephasing could be caused by spectral diffusion Phillips1987 (1). However, to date, only limited measurements were carried out on TLSs to characterize these processes at the single defect level Palomaki2010 . Such measurements could be used to better understand the nature of the defects and their decay mechanisms, and possibly engineer long-lived quantum memories in future devices. In Palomaki2010 , the coherence times of several TLSs were measured spectroscopically and were found to distribute as , where is the spectroscopic coherence time. Neeley’s method Neeley2008b of probing the TLS adds the capability of measuring the coherence time more accurately and also measure their lifetime separately.
In this letter, we present a measurement of the decay of energy and coherence for a large ensemble of TLSs in a small area junction using the phase qubit. We find that on average, the energy relaxation time (), follows a power law dependence on the coupling parameter to the phase qubit. The exponent of this power law is in fair agreement with what is expected from phonon radiation by a dipole (proportional to the coupling strength) inside the junction. The average dephasing time () is coupling dependent as well, peaking at intermediate couplings. We interpret this optimum coupling to be caused by anti-correlated fluctuations in the physical parameters which determine the TLS energy.
For small area junctions (), the typical measurement bandwidth allows us to detect and measure about 10 TLSs in a particular cooldown. Instead of using many different samples to acquire sufficient statistics, we use the fact that heating resets the TLS characteristics. The device is thermally anchored to the mixing chamber of a dilution refrigerator during measurement. We find that the TLS distribution is reset upon raising the temperature above 20 K and cooling down to the base temperature (10 mK). Some memory of the TLS distribution remains if the temperature is increased to only 1.5 K SuppMat . We utilize this feature to produce a new set of TLSs and generate an ensemble. The data was taken over 82 different TLSs, obtained from 8 different cooldowns.
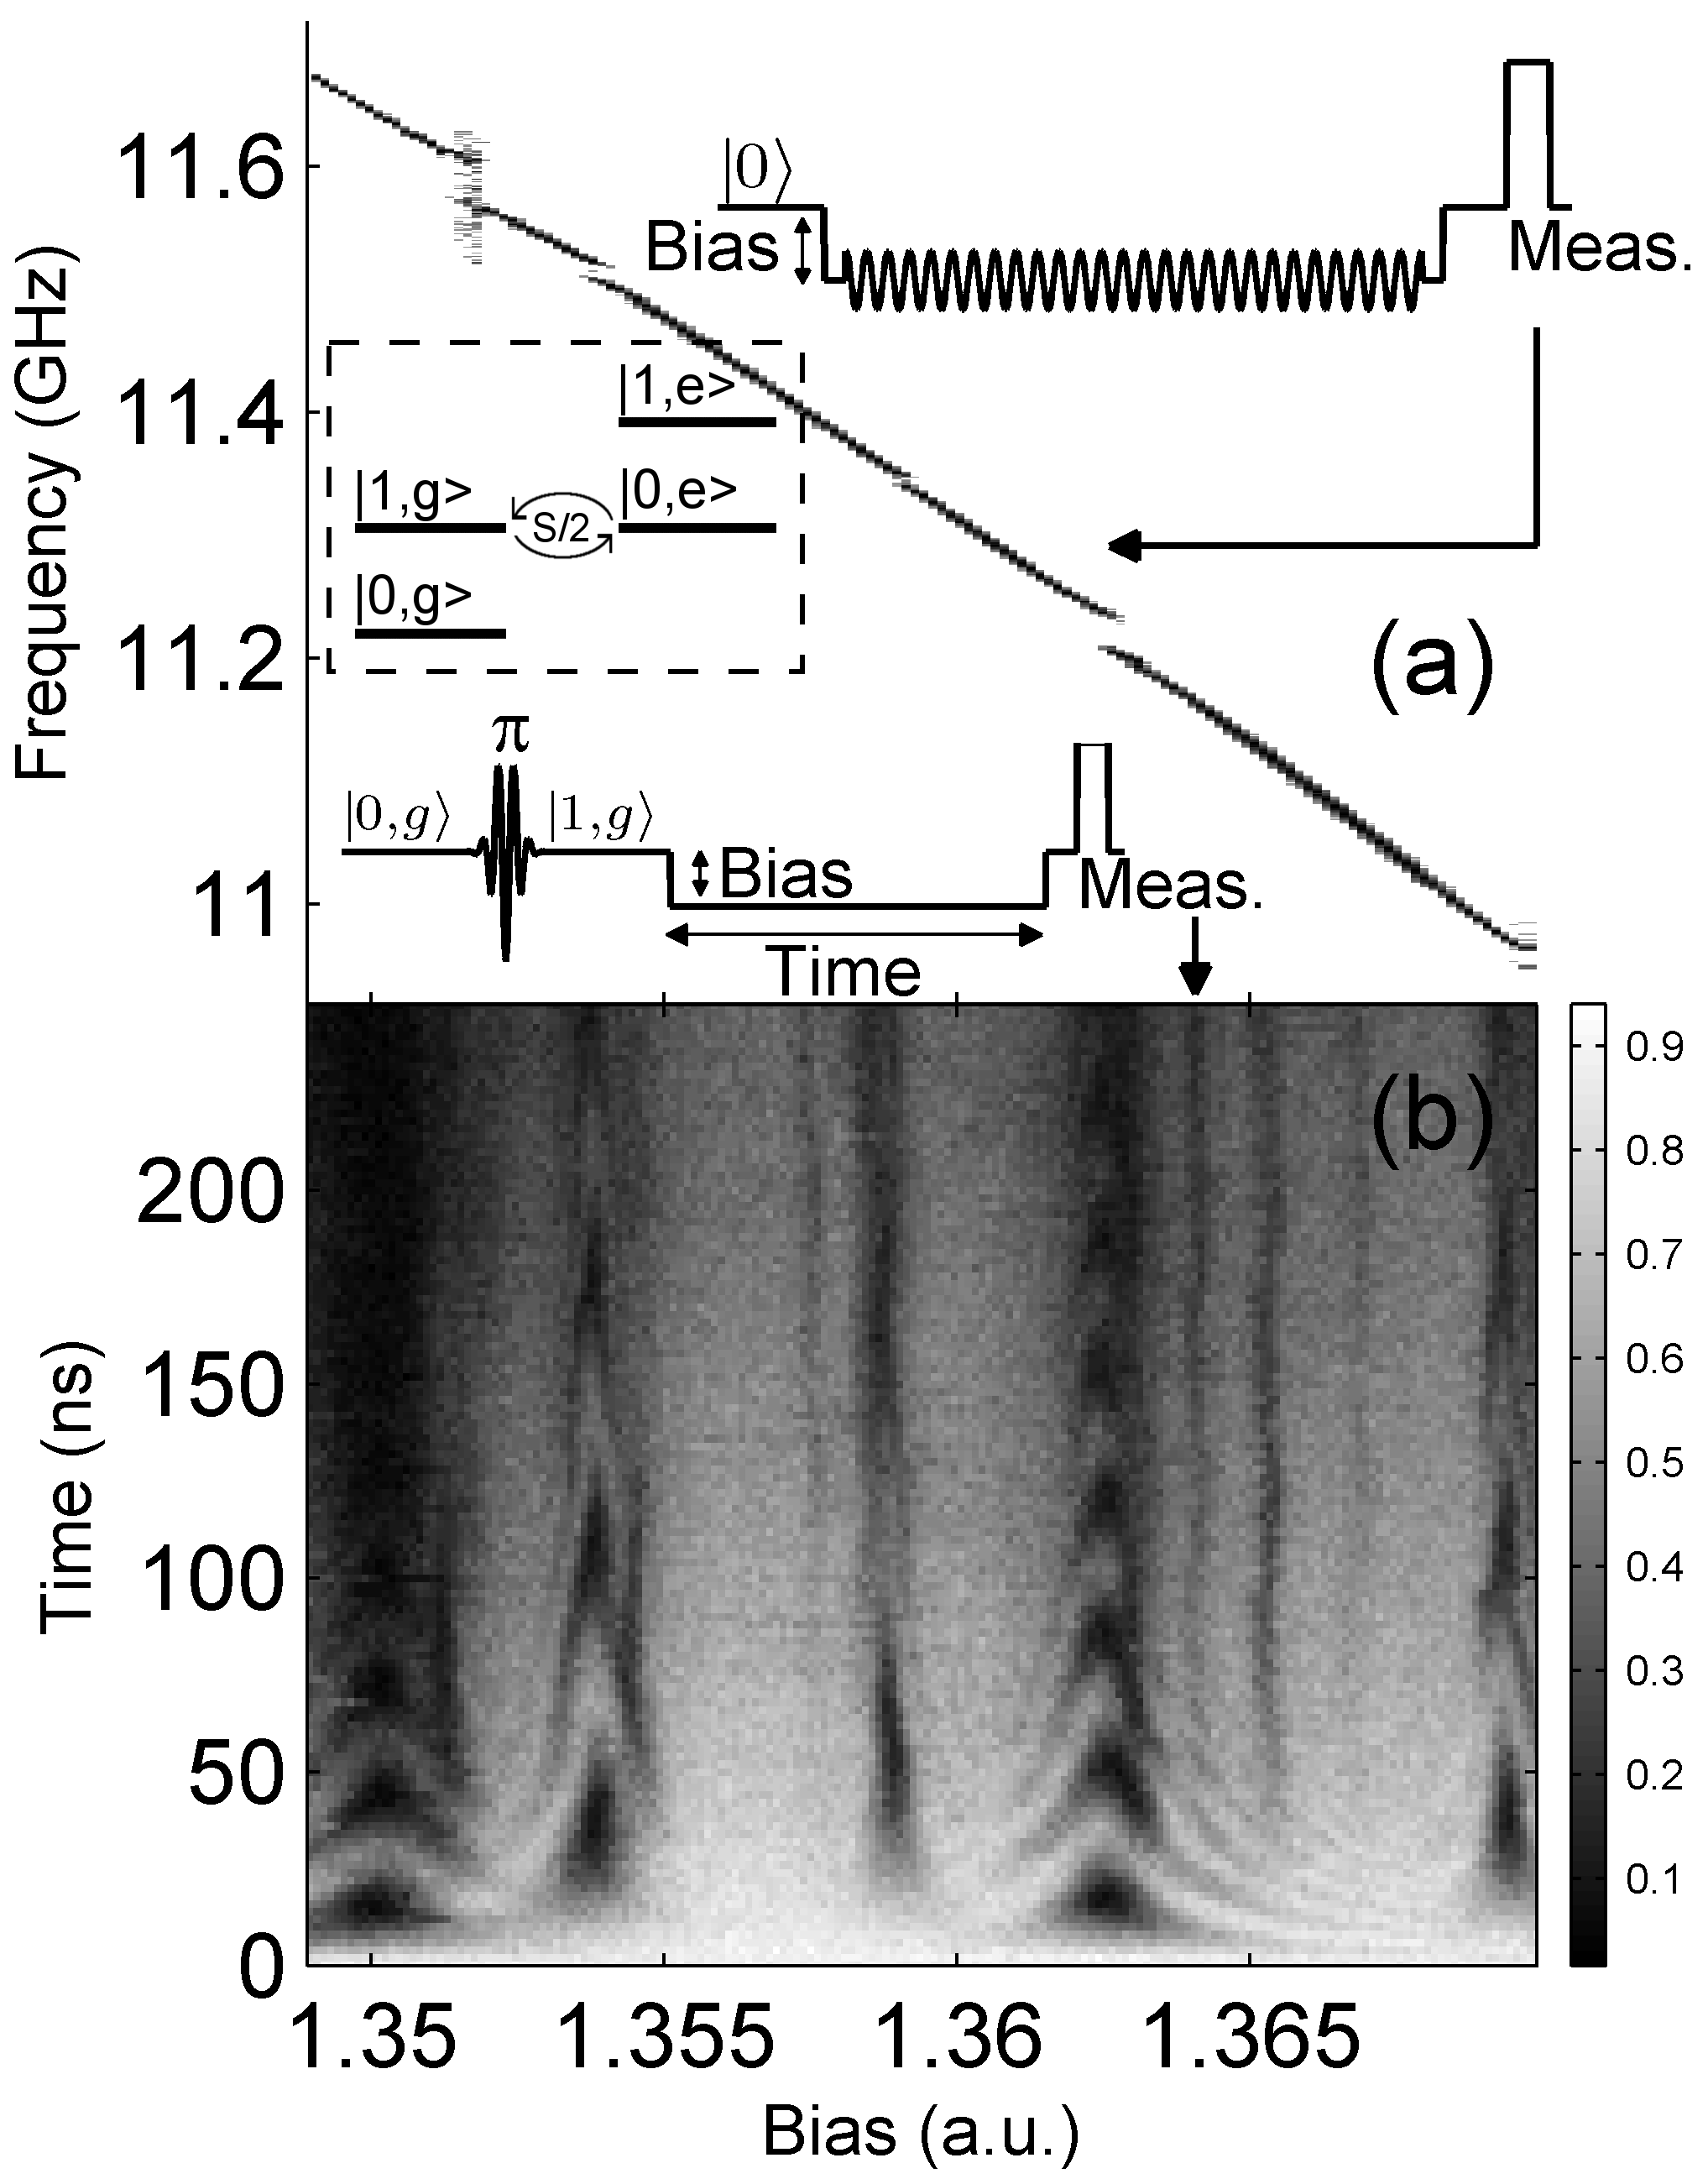
The initial identification of TLSs and their coupling parameters are carried out as follows. First, the qubit spectrum is swept over the bias 111The qubit loop is coupled to an external bias source through a flux transformer, which sets the qubit energy Martinis2002 . to locate the frequencies of TLSs from the positions of the avoided level crossing structures (see Fig. 1a). A complementary picture of the interacting qubit-TLS system in the time domain is shown in Fig. 1b, where we excite the qubit with a short resonant pulse (-pulse) far away from any observable TLS and then apply a bias pulse of varying amplitude and length. As seen in the figure, for bias values where the qubit is resonant with a TLS we observe oscillations that have the same frequency as the splitting size in the spectrum.
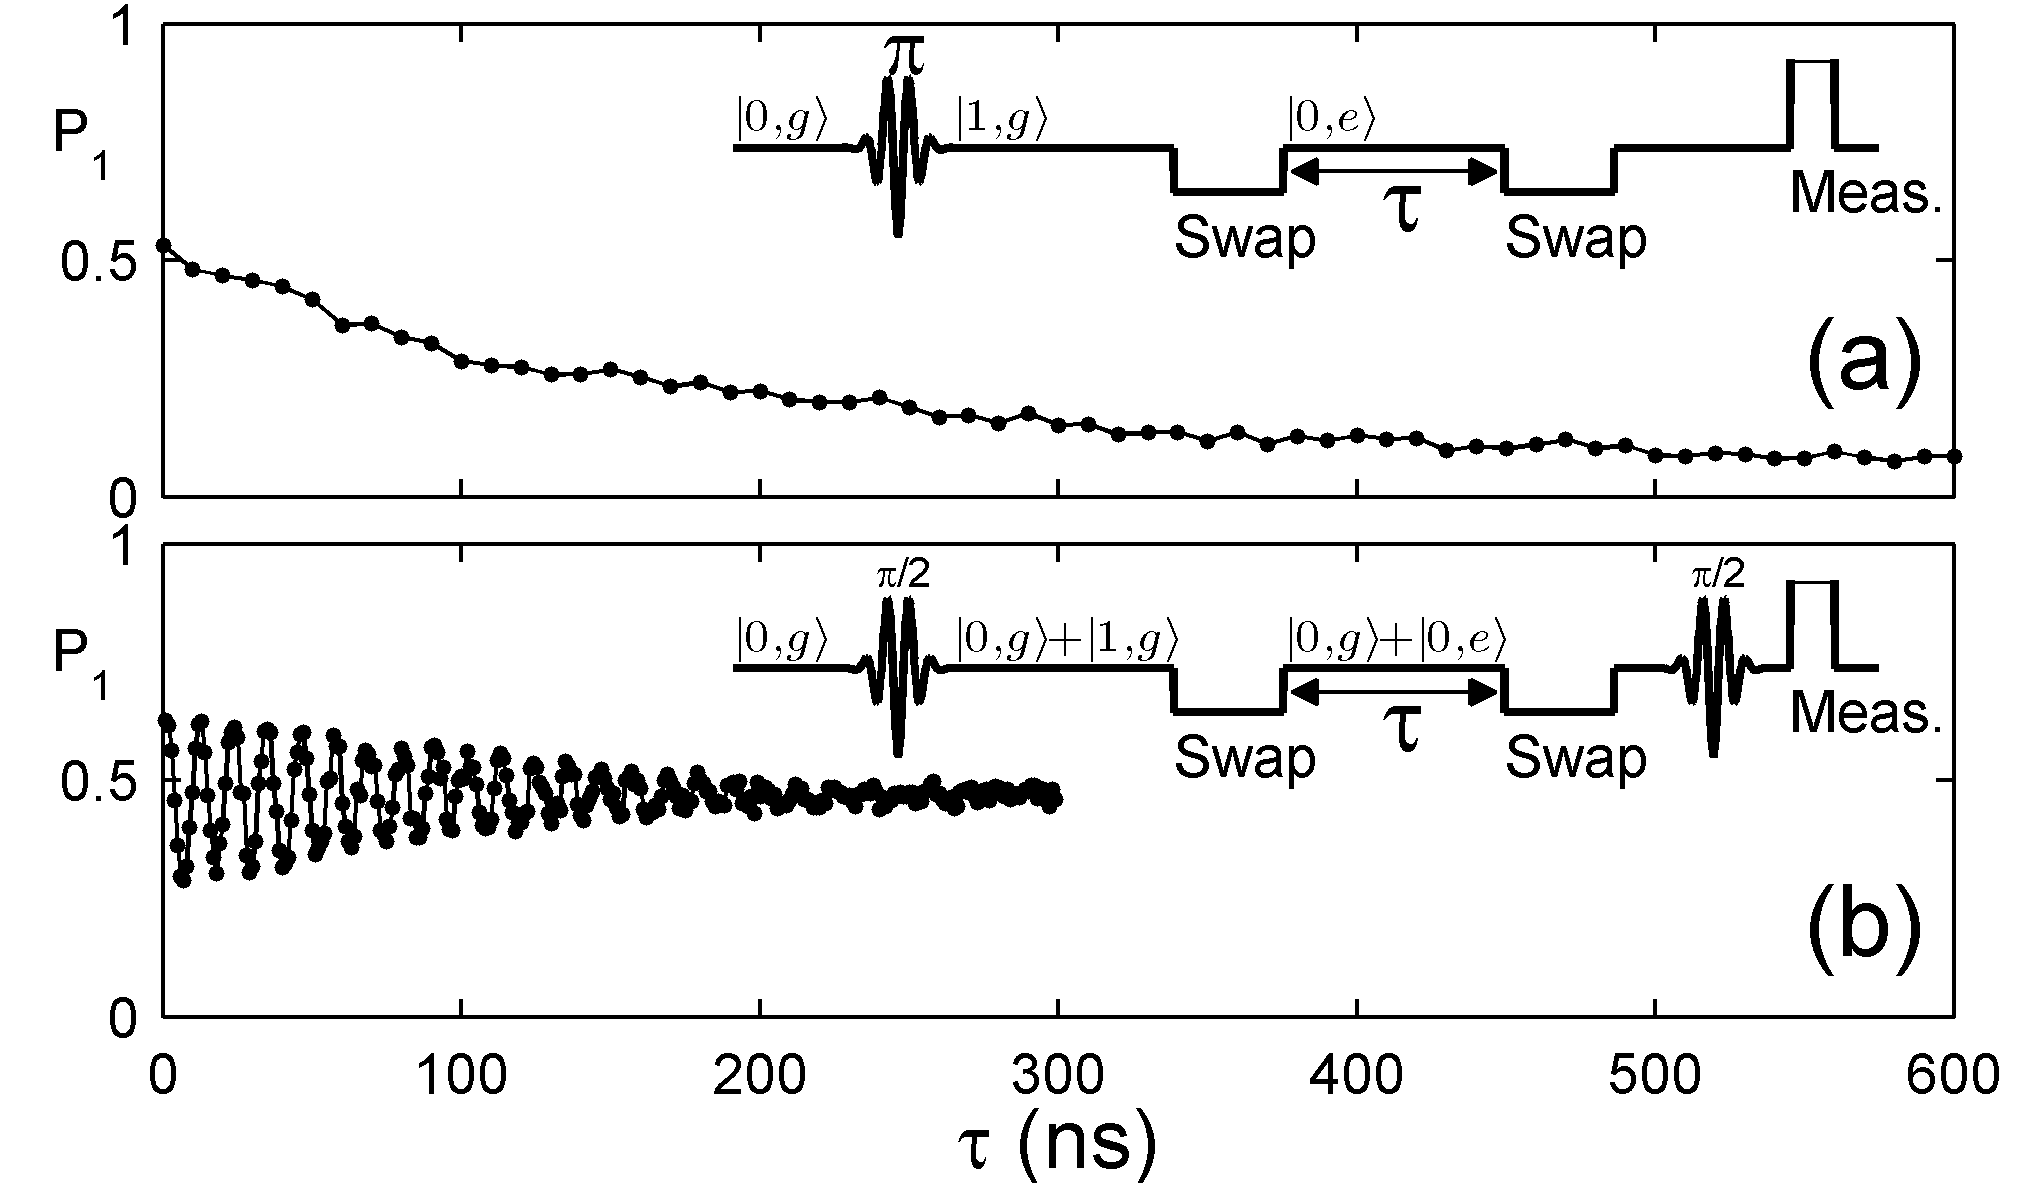
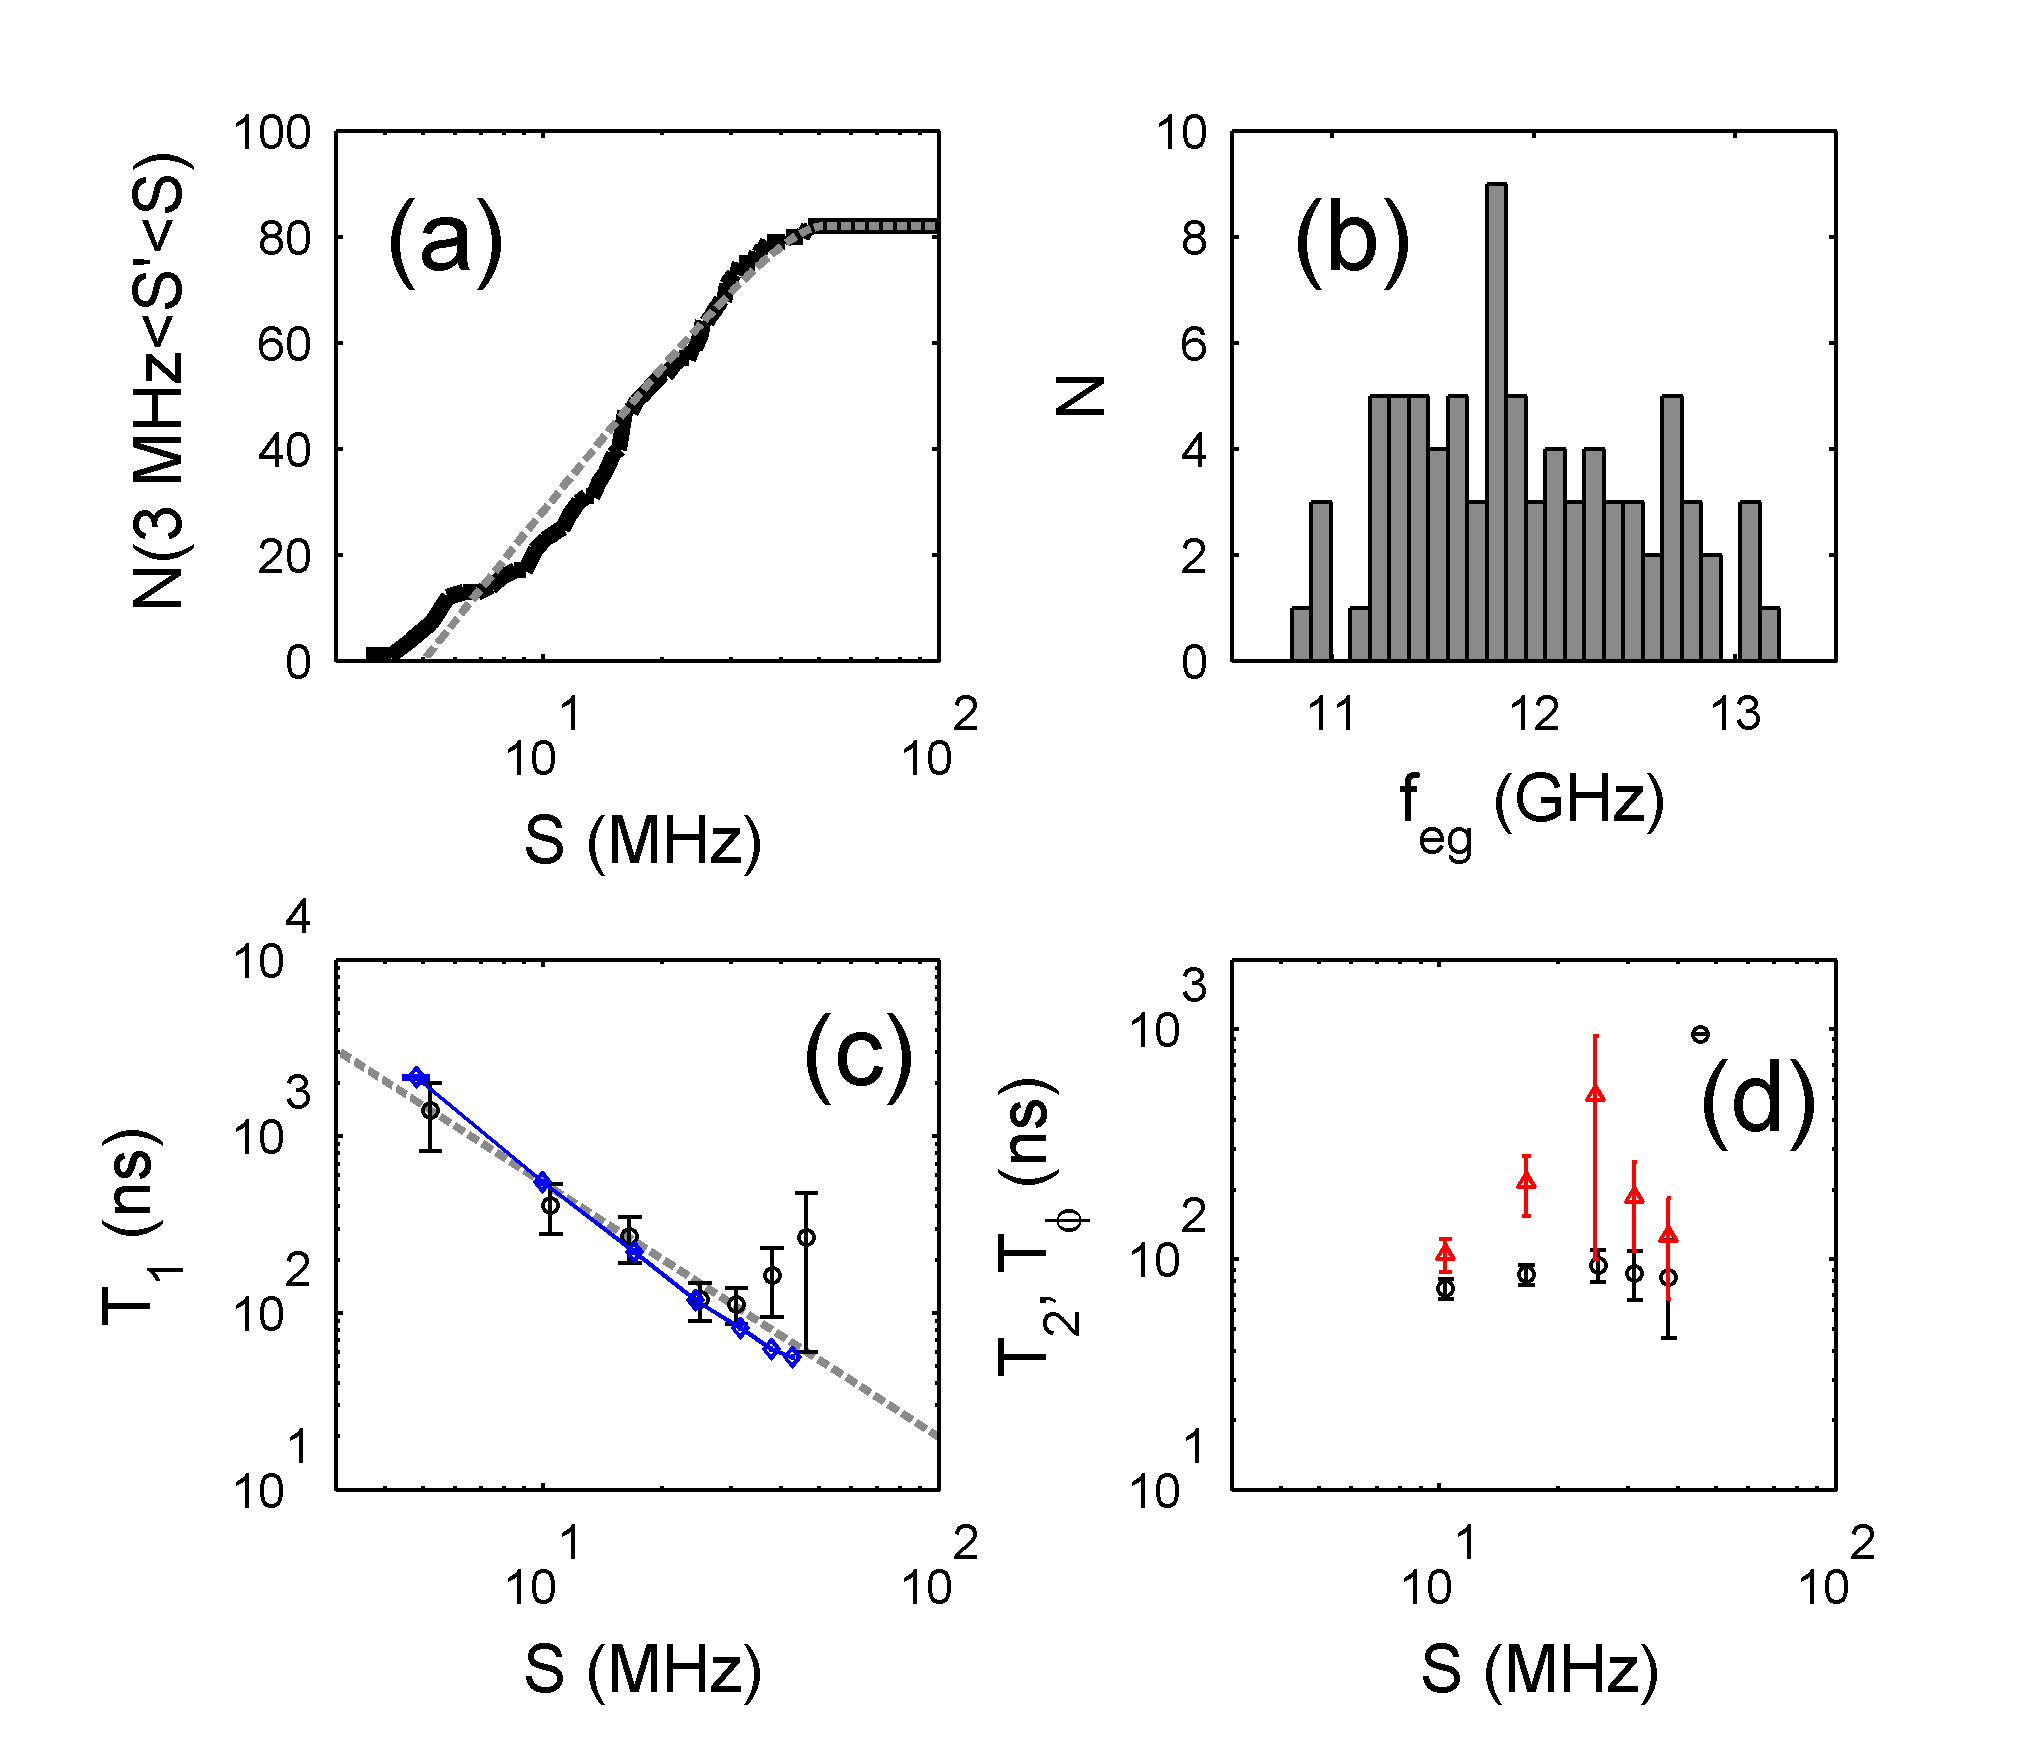
Following Neeley et al. Neeley2008b , the characteristic energy relaxation and decoherence time scales were extracted from and Ramsey experiments on the TLS, with sequences schematically represented in the insets of Fig. 2. Figure 2a and 2b show representative and decay curves of the same TLS with characteristic times of 187 ns and 148 ns respectively, obtained from a fit to a decaying exponent and an oscillatory decaying exponent. The size distribution of the observed splittings (see Fig. 3a) follows the theoretical curve predicted by the standard model for two-level defects and agrees with previous results on similar junctions (generated by measuring different samples) Martinis2005 . The maximal splitting size is found to be 45 MHz. Theory predicts Martinis2005 that this maximal splitting depends on junction parameters and defect size according to , where is the barrier thickness, is the spatial size of the dipole, is the junction capacitance and is the qubit energy. From the measured and known junction parameters we compute a dipole size . The minimal observable splitting size is MHz, and is mainly limited by the coherence time of the qubit. In addition, we find the distribution of TLS energies (, the energy between the ground state and excited state) to be constant throughout our qubit measurement bandwidth (see Fig. 3b), consistent with theory.
Although most of the decay curves of the TLSs are similar in their shape (i.e. a simple exponential decay), their decay times range almost 3 orders of magnitude, from 12 ns to more than 6000 ns. Coherence times on the other hand range from 30 ns to only 150 ns (excluding a single anomalous TLS which will be discussed later). For comparison, when the qubit is biased far from any observable splitting, its lifetime is 270 ns, and its coherence time is 90 ns. TLS energy relaxation times at a given splitting are not random. We find that they are shorter for larger splittings (stronger interaction with the qubit), although short lifetimes are measured for the smallest splittings as well. This trend is apparent in Fig. 3c where we plot average values as a function of splitting. In this plot we divide the ensemble into groups of TLSs having similar splitting values, in a 7 MHz window size. The error bar represents the statistical spread of the data within this window SuppMat . We find the average values , excluding two points SuppMat , to be best fitted by a power law , where SuppMat . Figure 3d (black circles) shows the processed data, obtained similarly from only 43 different TLSs SuppMat . In this case we observe a weak dependence on the coupling with a peak at MHz. This feature is more pronounced in the dephasing time , represented by red triangles in Fig. 3d.
The results can be understood within the standard TLS model. The excited state of the TLS involves a local deformation of the insulator. This deformation couples to phonon modes, leading to the decay of the TLS excitation. The expected lifetime for such a process Phillips1987 (1), is given by
| (1) |
where is the deformation potential, and are the speeds of sound for the longitudinal and transverse modes respectively, is the energy splitting due to tunneling and is the mass density. This is consistent with a power law dependence on , since the interaction strength with the qubit satisfies Martinis2005 .
The interaction of a TLS with the qubit is that of an electric dipole with an electric field, and therefore depends on the dipole orientation Martinis2005 . This feature explains the large spread in the data at a given splitting: both large dipoles (large ) perpendicular to the junction’s electric field and small dipoles aligned with the field can have the same but different lifetimes. To more rigorously compare experiment with this theory, we simulate an ensemble of TLSs with uniform distribution of dipole orientation and log distribution of dipole moment sizes Martinis2005 , from which we calculate the average lifetimes as a function of splitting size SuppMat . The simulation data (see Fig. 3c) yields an average exponent SuppMat , in agreement with our measurement.
The magnitude of the times that we extract from the experiment at a given splitting can be compared to the expected values for defects inside an AlOx dielectric using Eq. 1. We approximate the deformation potential by Sethna1982 , where is the average speed of sound of the transverse and longitudinal modes and is the local difference in volumes. For Al2O3 values with the difference in volumes taken as , where is the extracted dipole size, we get 1 eV, consistent with defects in other dielectrics Clare2005 (3). Since the dielectric layer thickness is much smaller than the relevant phonon wavelength, the speed of sound in Eq. 1 is set by the aluminum layers of the electrodes. Using the speed of sound for thin aluminum films CRC , we get ns which is very similar to what we measure. A more specific estimation should take into account the size of the junction and the layered structure.
Assuming the dephasing process is caused by fluctuations in energy, we note that the maximum observed in Fig. 3d can be explained by an anti-correlated dependence of the charging energy and tunneling energy on fluctuations in the TLS environment. According to the TLS model, where is the energy difference between the bare states of two spatial configurations and and is the tunneling interaction energy. Both and are dependent on a set of environmental parameters , which fluctuate in time. As is standard for the TLS model, we assume a linear sensitivity for on and an exponential sensitivity for : with overall dimensional normalization constants and and parameter specific constants and . The resulting fluctuations in energy, to first order in fluctuations in these parameters, are given by . This expansion becomes interesting for the situation where as there is a possibility for the contribution in to pairwise cancel. Since , where is the dipole orientation relative to the junction’s electric field, we expect to find such a cancellation at a particular splitting . Note that the dependence on smears this somewhat but we still expect a significant effect, as is observed in Fig. 3d.
As seen in the figures, the power-law describing cannot explain all the measured TLSs. We find that three out of 82 TLSs with large splittings (37 MHz, 41 MHz and 45 MHz) have much longer lifetimes than expected (220 ns, 243 ns and 476 ns - respectively). In addition, one TLS out of 41 has much longer coherence than all the others (about a factor of 6 longer than the longest of all the others), associated with a splitting of size 30 MHz. Other anomalies we discovered are related to the stability of a particular TLS in time. We find that the energy of some TLSs (about 5 %) changes spontaneously at varying time scales, from seconds to days. All the rest were remarkably stable SuppMat .
Some of these changing TLSs have long lifetime (a few microseconds), which is consistent with the power-law trend we discussed above. Furthermore, we also measure a few representative TLSs as a function of temperature. We find no significant change in and below 100 mK, consistent with the expected Phillips1987 (1) dependence. We also find that the instability of some TLSs increases at elevated temperatues (i.e, the change in TLS energy becomes more frequent). We conclude that some of the TLSs we measure have a different nature, perhaps related to their internal structure or position inside the junction.
In conclusion, the energy decay and dephasing times of two-level defects in an AlOx barrier of a Josephson junction are measured as a function of the coupling parameter with the phase qubit. The lifetimes vary substantially in our range of splittings, and agree with the theoretically predicted phonon radiative loss, which is dipole size dependent. The dephasing times show an extremum at intermediate couplings, which we attribute to an anti-correlated dependence on fluctuations in the environmental parameters which set the TLS energy. Such a dependence may distinguish between different theoretical models for TLSs. Our results demonstrate the power of the phase qubit as a dynamical coupling element to microscopic systems at the single microwave photon level.
We acknowledge fruitful discussions with Clare C. Yu. This work was supported by ISF grant 1835/07 and BSF grant 2008438.
References
- (1) W. A. Phillips, Reports on Progress in Physics, Volume 50, Number 12, 1657 (1987).
- (2) A. Shnirman, G. Schon, I. Martin, and Y. Makhlin, Phys. Rev. Lett., 94, 127002 (2005).
- (3) L. C. Ku, and C. C. Yu, Phys. Rev. B, 72, 024526 (2005).
- (4) M. J. Kirton et al., Semiconductor Science and Technology, 4, 1116 (1989).
- (5) N. Saks, Electron Device Letters, IEEE, 1, 131 (1980), ISSN 0741-3106.
- (6) J. M. Martinis et al., Phys. Rev. Lett., 95, 210503 (2005).
- (7) G. Wendin and V. S. Shumeiko, ArXiv Condensed Matter e-prints (2005), arXiv:cond-mat/0508729.
- (8) E. Tan, P. G. Mather, A. C. Perrella, J. C. Read, and R. A. Buhrman, Phys. Rev. B., 71, 161401 (2005).
- (9) K. B. Cooper et al., Phys. Rev. Lett., 93, 180401 (2004).
- (10) E. Lucero et al., Phys. Rev. Lett., 100, 247001 (2008).
- (11) R. W. Simmonds et al., Phys. Rev. Lett., 93, 077003 (2004).
- (12) A. Lupascu, P. Bertet, E. F. C. Driessen, C. J. P. M. Harmans, and J. E. Mooij, Phys. Rev. B, 80, 172506 (2009).
- (13) P. Bushev et al., ArXiv e-prints (2010), arXiv:1005.0773.
- (14) M. Neeley et al., Nat Phys, 4, 523 (2008), ISSN 1745-2473.
- (15) S. Oh et al., Phys. Rev. B, 74, 100502 (2006).
- (16) G. Tettamanzi, et al., in 2006 International Conference on Nanoscience and Nanotechnology (2006).
- (17) T. A. Palomaki, et al., Phys. Rev. B, 81, 144503 (2010).
- (18) See supplementary material.
- (19) J. P. Sethna, Phys. Rev. B, 25, 5050 (1982).
- (20) D. R. Lide, CRC Handbook of Chemistry and Physics, 88th Edition (CRC, 2007) ISBN 0849304881.
- (21) J. M. Martinis, S. Nam, J. Aumentado, and C. Urbina, Phys. Rev. Lett., 89, 117901 (2002).