Vacancy ordering effects on the conductivity of yttria- and scandia-doped zirconia.
Abstract
Polarizable interaction potentials, parametrized using ab initio electronic structure calculations, have been used in molecular dynamics simulations to study the conduction mechanism in Y2O3- and Sc2O3-doped zirconias. The influence of vacancy-vacancy and vacancy-cation interactions on the conductivity of these materials has been characterised. While the latter can be avoided by using dopant cations with radii which match those of Zr4+ (as is the case of Sc3+), the former is an intrinsic characteristic of the fluorite lattice which cannot be avoided and which is shown to be responsible for the occurrence of a maximum in the conductivity at dopant concentrations between 8 and 13 %. The weakness of the Sc-vacancy interactions in Sc2O3-doped zirconia suggests that this material is likely to present the highest conductivity achievable in zirconias.
1 Introduction
Yttria-doped zirconia (YSZ) is a fluorite-structured oxide ion conductor used as an electrolyte in a solid-oxide fuel cell (SOFC) inter alia. Substitution on the cation sublattice of the Zr4+ions by the larger Y3+ ions stabilizes the eight-coordinate cubic structure and, because of the lower valency, introduces oxide ion vacancies on the anion lattice which then allow oxide ion diffusion 1. If diffusion occurred by an independent vacancy-hopping mechanism, one might expect that the dependence of the conductivity on vacancy concentration, , would be , which maximizes at . However, the maximum actually occurs at a much lower vacancy concentration – where roughly 4% of the oxide ion lattice sites are unoccupied 555If the compositions is denoted (M2O3)(1-x)(ZrO2)x, where M is a trivalent cation, then the fraction of unoccupied anion lattice sites, or vacancy concentration, is given by . This has been ascribed to the reduction in the vacancy mobility by ordering processes. These can be caused by the differences between the host and dopant cations, which lead to a preference for vacancies to bind close to a certain cation species 2, 3, 4, or by the interaction between the vacancies themselves 5, 6.
In the case of YSZ, adding Y3+ ions has two competing effects: on the one hand, adding more dopant increases the number of vacancies and therefore increases the mobility of the remaining anions; on the other hand, since the migration barrier of an oxygen crossing a Y-Zr or Y-Y edge is much higher than in the case of a Zr-Zr edge 7, 8, 9 (because Y3+ is a much bigger cation 10 than Zr4+), adding more dopant will increase the fraction of cation edges associated with high migration energy barriers, thus effectively reducing the overall number of mobile oxygens. It is worth noting that this can be seen from a vacancy perspective: vacancies prefer to bind to be nearest neighbours to the smaller cations (Zr4+ in this case) and this reduces their overall mobility. If we express the oxygen diffusion coefficient, , as 11
| (1) |
where is a pre-exponential factor, the temperature in Kelvin, Boltzmann’s constant and is the oxygen migration enthalpy, increasing the number of vacancies will increase whereas increasing the number of Y-Zr or Y-Y edges will increase the migration enthalpy, . The resulting diffusion coefficient will peak for a certain dopant concentration, which is smaller than would be expected from an independent vacancy-hopping mechanism. This explanation is almost universally accepted 12, 7, 8, 13, 11, 14, 15 and has been generalised to other doped fluorite systems 8, 14, 15, 16. In scandia-stabilised zirconia, however, the two cations have very similar radii and cation-vacancy ordering effects are very weak 3, 4, 15, 17. For this reason the drop in the conductivity observed in this material (at a slightly greater dopant concentration than in YSZ) has to be caused by some other effect.
Vacancy-vacancy interactions have also been proposed as a factor hindering the ionic conductivity of these materials 5, 18, 19, 20. Direct evidence of vacancy-vacancy ordering even at the high temperatures of interest for conductivity studies, is seen in diffuse neutron scattering patterns obtained for YSZ 5. In this study, intense diffuse peaks are observed in the neutron and x-ray diffraction patterns at positions which are forbidden for a simple fluorite lattice. Some of these peaks have been interpreted as caused by the local relaxation around small aggregates in which pairs of vacancies along the direction pack together along the direction. That this vacancy pair configuration is favourable is validated by the ab initio static energy calculations of Bogicevic and co-workers 6 and Pietrucci et al. 21. By studying the relaxation times observed in the quasielastic neutron scattering at different points in reciprocal space, Goff et al. showed that the vacancies associated with the aggregates moved more slowly than isolated vacancies and suggested that this was the cause of the decrease in the conductivity at high vacancy concentrations.
In the preceding paper we examined cation-vacancy and vacancy-vacancy ordering effects in the Zr0.8(Y/Sc)0.2O1.9 system, using computer simulations. We studied systems in which the proportion of Y3+ and Sc3+ is varied at constant vacancy concentration (this is 5%, close to the composition at which the conductivity maximum occurs in YSZ). The simulations reproduced the structural information from diffraction experiment and also the variation of the conductivity as the Y/Sc ratio was varied. We found evidence of both cation-vacancy and vacancy-vacancy ordering and the associated energies were consistent with the ab-initio data 6. The cation-vacancy effects were much stronger in the Y-rich samples, which is consistent with the lower conductivity of those materials, whilst the vacancy-vacancy ordering seemed to be almost independent of the nature of the dopant cation, at least at these dopant levels.
The objective of the present paper is to examine the interplay between these two mechanisms and to discover how they combine to determine the conductivity of a particular material at a particular doping level. We will examine the properties of (Y2O3)x - (ZrO2)1-x and (Sc2O3)x - (ZrO2)1-x (which we dub ScSZ) obtained in simulations at high temperature, with varying and, with it, the vacancy concentration. The ultimate purpose is to elucidate to what extent it might be possible to further improve the conductivities of this class of material by further optimisation of the doping strategy. Although both mechanisms clearly exist, it is not clear to what extent they are coupled. Does the cation-vacancy interaction influence the vacancy-vacancy interaction to a significant degree, for example? Our strategy is, firstly, to compare the results of our simulation with measurable quantities which bear upon the properties of the vacancies, notably the conductivity and diffuse scattering. No new experimental data is reported in the present paper, the conductivities of both systems have been measured previously 22, 2 and the diffuse neutron scattering in the YSZ system was measured in single crystal studies by Goff et al. 5 for . Secondly, having validated that our simulations are reproducing these observables sufficiently closely to assert that the behaviour of our simulated systems is paralleling that of the real materials in this regard, we will examine directly the properties of the vacancies themselves in a way which cannot be replicated in a real experiment. In addition to the simulation of these materials with realistic potentials, we will also report results for model systems for which the potentials have been altered (for example, by equalization of cation charges) in order to illustrate the physical factors responsible for a particular aspect of the observed behaviour.
2 MD simulation and analysis
The interaction potential (which we usually dub DIPPIM), and the procedure we used to parameterize it, has already been described in preceding work 23, 24, 25. In this potential, the ionic species carry their valence charges (Zr4+, Y3+, Sc3+ and O2-), and the polarization effects that result from the induction of dipoles on the ions are accounted for. The parameters of the interaction potential for these systems were obtained from the application of a force-and dipole-matching procedure aimed at reproducing a large set of first-principles (DFT) reference data 26 on the condensed phase. Such potentials have been shown to provide an accurate and transferable representation of the interactions in a number of oxides 27, 26, 28, 23, 24, 25, 29, 30.
In addition to these “realistic" potentials we also construct "ideal" model systems (which we will refer to as i-YSZx) which contains the same concentration of vacancies as (Y2O3)x - (ZrO2)1-x with the same value. In i-YSZx all the cations carry the same charge, such that the total cation charge balances that of the O2- ions present in the simulation, and all cations have the same short-range interaction potentials as the Zr4+ ions in the original potential. This idealized system allows us to eliminate the effects of differing charges and lattice strain induced by having host and dopant cations and gives an idealised reference system in which the cation-vacancy ordering effects are absent.
All the simulations were performed, unless otherwise stated, using a cubic simulation box with
4 x 4 x 4 unit cells of the fluorite structure, i.e. 256 cations and a variable number of oxygen ions, depending on cation composition. For each dopant concentration, a certain number of Zr4+ ions were replaced with Sc3+ or Y3+ ions and their positions were randomly distributed over the cation sublattice 23, 25. In our previous work 25 we concluded that local cation ordering, as observed in Y3NbO7, was much less important in Y2Zr2O7 and we presume that this remains true at other compositions as well as in ScSZ (where the site mismatch between Sc3+ and Zr4+ is even smaller than in the Y3+ and Zr4+ case 10 ), so that a random distribution of cations is appropriate. Vacancies were randomly assigned to the oxide sublattice in the initial configuration. The time step used was 1 fs and all the runs were performed at constant volume and temperature (NVT ensemble), with thermostats as described elsewhere 31. The cell volume was obtained from a previous run in a NPT ensemble with zero applied pressure. Coulombic and dispersion interactions were summed using Ewald summations while the short-range part of the potential was truncated to half the length of the simulated box (usually about 10 Å).
In order to calculate ionic conductivities, we ran long simulations (0.5 5 ns) at high temperatures (T 1250 K) on YSZ and ScSZ. Each simulation was long enough to allow each oxygen ion to move, on average, by a distance of at least Å, i.e. the oxygen-oxygen bond distance. Ionic conductivities were estimated from the slope of a plot of the mean-square displacement of the charge versus time, i.e. 32
| (2) |
where is the charge on ion , the displacement made by the ion in time and …. denotes an average over the simulation run. This quantity suffers from poor statistics, especially when the mobility of the ions is low, and so we have also calculated conductivities from the Nernst-Einstein expression
| (3) |
which neglects correlations between the diffusive jumps of different ions.
To compare with the diffuse neutron diffraction results we calculate the intensity of (total) scattering at some point in reciprocal space from
| (4) |
where the sums run over all ions in the sample, is the vector joining ions and and is the neutron scattering length of the species to which belongs. Because of the periodic boundary conditions, the accessible vectors with a cubic simulation cell of side are restricted to the set where , , and are integers, and this provides a limit to the resolution of the simulated pattern. For these calculations we used a cubic simulation box with 6 x 6 x 6 fluorite unit cells, which gives a resolution of approximately 0.2 Å-1. We made extensive use of the cubic symmetry to average over the scattering calculated from symmetry-related -vectors. These simulations were started at 1800 K and then slowly cooled down to 800 K with a cooling rate of 1012 K s-1. In this temperature range, oxygen ion diffusion is observed while, below 800 K, no diffusion can be observed on the available timescale. For this reason the simulations at low dopant content ( = 0.9) were further quenched down to room temperature (300 K). Although this should not influence the vacancy ordering this will increase the tetragonal distortions in the sample (see discussion below).
The relaxation of the structures responsible for the diffuse scattering at a particular point in reciprocal space can be measured in a quasielastic neutron scattering experiment. In the simulation the quantity to be calculated for comparison with the experimental data is the intermediate scattering function , given by
| (5) |
again, the calculated quantities may be averaged over the symmetry-related -vectors.
We can identify the positions of vacancies for some instantaneous ionic configuration by finding which of the coordination tetrahedra around the anion sites are empty. The details of this procedure are reported in previous papers 32, 25. Because the cations are not diffusing we can monitor the properties of each tetrahedron from the identities and instantaneous positions of the four cations which sit at its vertices. Such a tetrahedron is empty if no anion is within the volume bounded by the four planes defined by the positions of each set of three of the cations. Because the oxide ions may perform large-amplitude vibrations about their average sites at the temperatures of interest for dynamical studies we only assign a vacancy to a tetrahedral site if the tetrahedron has been empty for a minimum of two frames (i.e. 100 fs). The position of the vacancy is defined by that of centre of the tetrahedron (which is given by the average positions of the four surrounding cations). Once the positions of vacancies are identified, we can us them to build radial distribution functions (rdfs) to study the ordering tendencies in real space. Integration of the rdf can be used to define coordination numbers. For example integrating the vacancy–vacancy rdf, gV-V from zero out to the position of first minimum of the gV-V rdf gives the average number of vacancies which are nearest-neighbours another vacancy:
| (6) |
where is the density of vacancies.
3 Comparison with experimental data
In this section we will compare our MD data with the available experimental data on (Y2O3)x-(ZrO2)1-x and (Sc2O3)x-(ZrO2)1-x. Although our methodology has already been thoroughly tested in the preceding paper 17 as well as in our previous work 23, 25 for = 0.11, = 0.33, we will first ensure that our simulations at different dopant concentrations reproduce the experimental data which is influenced by the vacancy ordering effects, before drawing conclusions on the conduction mechanism of YSZ and ScSZ. A comparison will be therefore made with the conductivity, quasielastic and diffuse scattering data 5, 22, 33, 34.
3.1 Conductivity
In figure 1 we show the calculated Nerrnst-Einstein conductivities for both YSZ and ScSZ as a function of dopant concentration at 1670 K. For YSZ, we also report the experimental values from ref. 33, 34. The MD data on YSZ are seen to be in reasonable quantitative agreement with experiment. The dependence of the conductivity on the dopant concentration also looks promising. Both curves show a peak in the conductivity at = 8-9 % and 12-13 % for YSZ and ScSZ respectively in good accord with the experimental data. However, the rise in conductivity shown by our simulations is smaller than that of the experimental data. This may be caused by two effects. Firstly, at higher dopant concentrations, the Nernst-Einstein approximation of independent ion jumps is not accurate. To this end, we calculated the ionic conductivities from equation 2 at the dopant concentrations shown in figure 1, and found that these are in close agreement with the Nernst-Einstein values for 0.10 but systematically lower to an increasing degree as increases, for 0.10. Secondly, the small systems studied in this paper, which do not allow the formation of grain boundaries and tetragonal domains, might affect the behaviour of the low dopant concentration part of the curve (see also discussion below).
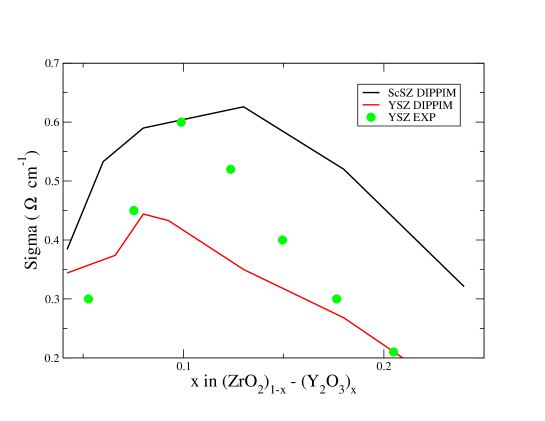
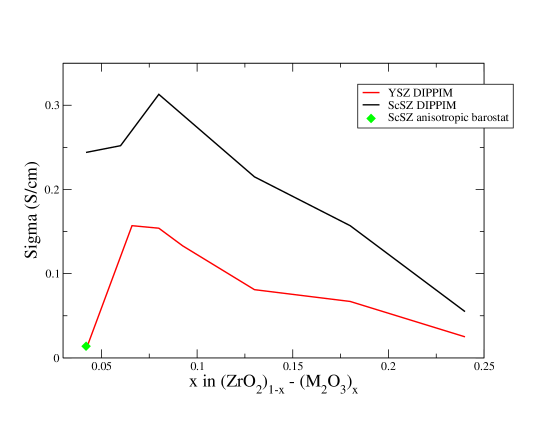
The conductivities shown above were calculated from simulations in which the cubic fluorite symmetry was enforced. This was done by equilibrating the simulation using an isotropic barostat 31, before conducting the production runs at constant volume. As it is well known 5, 1, YSZ and ScSZ are not cubic at low temperatures and dopant concentrations. For this reason, when the conductivity versus dopant concentration curves are calculated at lower temperatures, a slightly different behaviour is observed (see bottom part of figure 1). The maximum has, in fact, shifted to lower dopant concentrations (approximately 6 % and 8 % for YSZ and ScSZ respectively) and the curve’s shape looks very similar to that of Gd2O3-doped ZrO2 (see figure 4 in reference 2, a material which, due to Gd’s big ionic radius, is cubic for almost all compositions). A shift of the maximum’s position as the temperature is lowered is also observed experimentally 33, 34, though not as strong as that indicated by the comparison of the top and bottom part of figure 1.
We think that the changes observed in figure 1 are mainly caused by the fact that the real material is not locally cubic at these temperatures and low dopant concentrations5, 1 , so that the simulations, in which the cubic symmetry is enforced within a cell which is too small to allow the formation of distorted domains, tend to overestimate the conductivity of these materials. To confirm this, we relaxed the cubic fluorite symmetry in a simulation of 4% ScSZ and allowed the simulation cell to change its shape, by using an anisotropic barostat 31. The simulation quickly adopted a non-cubic symmetry. The conductivity obtained for this system is shown in the bottom part of figure 1 as a green diamond. It can be appreciated that this is indeed much lower (more than ten times!) than the conductivity obtained from a cubic simulation. In the reminder of this paper, however, we will focus on highly-doped stabilised zirconias only, i.e. those materials with more than 8 % of dopant, which are fully stabilised at every temperature. These systems are therefore not affected by the above-mentioned problem and therefore simulations, in which the cubic symmetry is enforced, can be used.
3.2 Diffuse scattering in YSZ
As we remarked in the Introduction, the most direct evidence for vacancy-vacancy ordering effects in the temperature range of interest for conductivity measurements comes from the single-crystal diffuse neutron scattering data obtained by Goff et al. 5. In figure 2 we have compared the experimental patterns obtained for (Y2O3)x - (ZrO2)1-x, with = 0.09 and = 0.24 respectively, with patterns calculated in the simulations for very similar compositions.
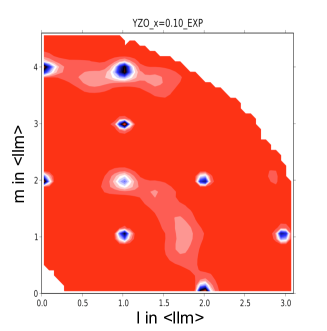
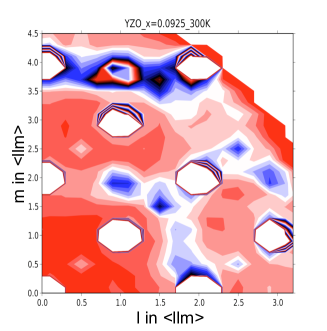
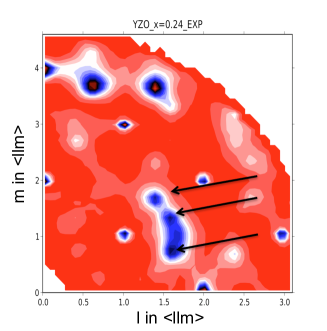
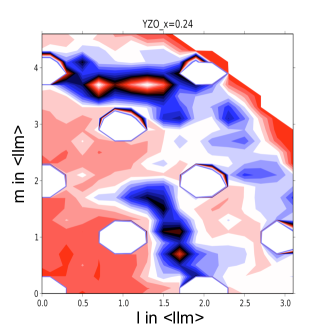
The = 0.09 (T = 300 K) composition corresponds to the maximum of the conductivity plot for YSZ. The figure shows a plane in reciprocal space. Sharp intense peaks are seen in the experimental data at the fcc Bragg positions , , , , , , etc.; in the simulation data the Bragg peaks are centred on the same values but are broader because of the lower resolution. The remainder of the intensity which appears in the pattern is diffuse scattering and is indicative of local structural deformations. At = 0.09 the most intense diffuse features in the experimental data appear at and , these are forbidden reflections for the fluorite structure. According to the analysis of Goff et a.l these peaks are a consequence of local tetragonal distortions of the fluorite structure which occur at relatively low concentrations of Y2O3. Recall that in pure ZrO2, a tetragonal phase is more stable than the cubic one and that Y2O3 is added to stabilize the latter. At low Y2O3 concentrations local tetragonal distortions with random orientation occur even within a single crystal. Comparison with the MD data shows that the same diffuse features are present in the simulation data, together with other features which are comparatively weak in the experimental data. This indicates that the tendency to local tetragonal distortion is reproduced in the simulated system: the differences in the intensity distribution and the widths of the diffuse features compared to experiment may be attributed to the small size of our simulation cell which sets a limit to the range of correlation of the tetragonal deformation which can be accommodated and thus leads to broader, weaker diffuse features. Both sets of data also show a broad, weak feature at which is associated with a pattern of lattice deformation about isolated vacancies 5.
As the Y2O3 concentration is increased to = 0.24 (T = 800 K), the and features disappear and the diffuse scattering becomes dominated by new features (highlighted by the arrows in the bottom part of figure 2) which may be described as belonging to a superlattice at , where is an fcc Bragg peak position 5. This pattern has been interpreted as caused by small aggregates of divacancy clusters (vacancies paired along the direction) packed along the direction, as found in the Zr3Y4O12 compound. These aggregates are typically 15 Å in diameter 5. This structure is consistent with the most stable arrangement of vacancy pairs found by Bogicevic 6 in his analysis of vacancy-ordering tendencies in YSZ and with our analysis in the preceding paper. Comparison with the simulation data shows that the signature of this particular vacancy-vacancy ordering has been reproduced in the simulation. Interestingly, since our simulations at = 0.24 were run at T = 800 K, this means that these ordering effects are still present at high temperature and that therefore they will affect the conducting properties of these materials at the temperatures of interest for technological applications.
Although we have only discussed the diffuse scattering results for YSZ itself, similar diffuse scattering patterns were obtained in calculations on ScSZ, for which there is no single crystal data.
3.3 Quasielastic scattering
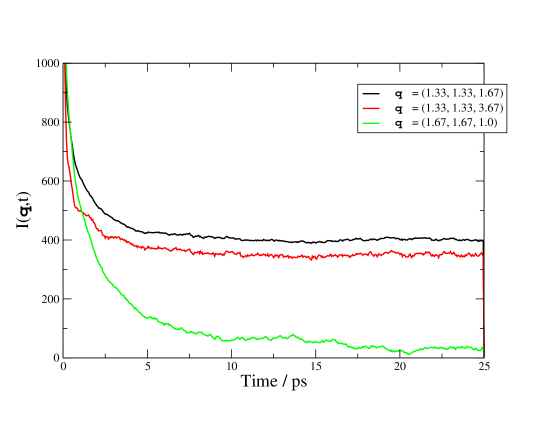
As a final comparison with experiment, we now attempt to reproduce the quasielastic data from ref. 5. Goff et al. 5 showed that the relaxation times of the quasielastic scattering at different points in reciprocal space varied significantly. Close to the diffuse scattering feature associated with the isolated vacancies (at = (1.67, 1.67, 1) the intermediate scattering function at 1800 K relaxed quite rapidly, on a timescale of 1.3 ps, which gives a timescale for the independent vacancy hopping. However, at = (1.33,1.33,1.67) and = (1.33,1.33,1.67), where the diffuse scattering is associated with clusters of vacancy pairs, the relaxation was much slower, leading to an unresolved elastic peak in the associated spectra. Goff et al. deduced from this that those vacancies involved in the clusters moved much more slowly than the free ones, giving compelling evidence for the effect of vacancy-vacancy interactions on diffusion.
The intermediate scattering function at these three values was calculated as explained in the previous section, from a simulation at 1800 K on 13 % YSZ; these were the conditions of the experimental study. The results are shown in figure 3. It can be seen that only at = (1.67, 1.67, 1) does the intermediate scattering function relax to zero on the timescale of the simulation. At = (1.67, 1.67, 1) the relaxation time is 1.7 ps 666This was obtained by fitting an exponential decay to the curve in figure 3., to be compared with the 1.3 ps seen experimentally. At the other values there would be a significant unresolved "elastic" peak in the spectrum indicating that the defect aggregates responsible for the scattering at these values are immobile on the timescale on which the correlation function has been calculated. The simulations are thus in good quantitative accord with the experimental results.
4 Analysis of the vacancy ordering
Although the diffuse scattering comparison discussed above demonstrates that the ordering effects present in the real material are reproduced in the simulations, the degree of ordering is more conveniently illustrated in real-space, by comparing cation-vacancy and vacancy-vacancy radial distribution function, obtained for different dopant concentrations.
In the preceding paper, we have already illustrated how the cation-vacancy radial distribution functions provide information about the tendency of vacancies to associate with particular cation types. Our results are consistent with earlier suggestions 22, 3, 4, 2 that the cation-vacancy interactions are driven by the lattice strain associated with the difference in size between the host and dopant cations. The fact that vacancies and trivalent dopants have the same charge, and would therefore be expected to repel, seems to play a much smaller role. It was shown that in YSZ, where there is a substantial disparity in size between the two cations, there was a high tendency for the vacancies to occur in the first coordination shell of Zr, relative to Y. This can be interpreted as allowing the Zr to reduce its coordination number from the 8 of the normal fluorite structure. In ScSZ, where the cation sizes are much closer, this tendency was much less marked. The stronger cation-vacancy ordering effect in YSZ provides a natural way of explaining the higher conductivity of ScSZ at the low dopant level which was the focus of the previous study. However, in view of the weakness of the effect in ScSZ, unless the cation-vacancy becomes much stronger at higher dopant levels, it seems likely that other factors contribute to the drop in conductivity and the appearance of a maximum at relatively low dopant levels.
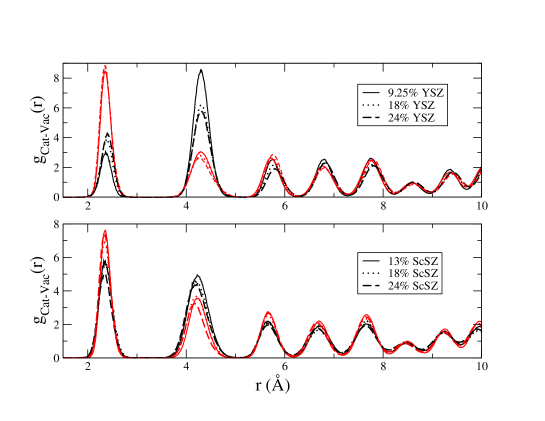
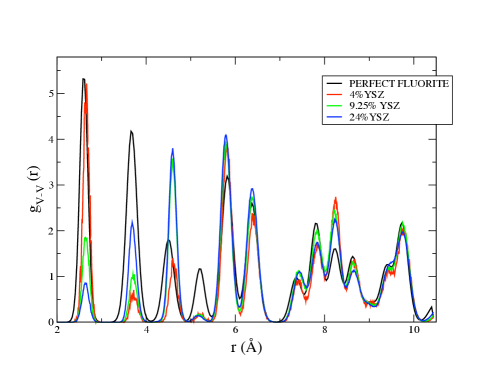
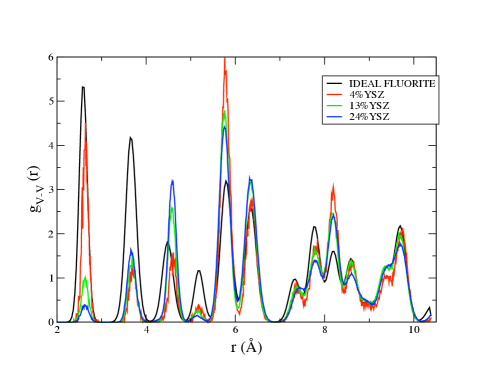
In figure 4, we show the cation-vacancy radial distribution functions for YSZ and ScSZ for different dopant concentrations at 1250 K. We choose to show the concentration at which the maximum in the conductivity is observed (9% and 13% for YSZ and ScSZ, respectively) and then two higher concentrations (18% and 24%). The rdfs for YSZ show that there is a preference for vacancies to be nearest neighbours to the small Zr4+ cations, as found in the preceding paper for 11% YSZ. Interestingly, these binding tendencies become weaker as more dopant cations are added. This is probably caused by the fact that, as we add more Y2O3, the number of dopant cations increases (as well as the number of vacancies) and it becomes more difficult for the vacancies to avoid the dopant cations. In ScSZ, on the other hand, the vacancies have almost no preference for a certain cation species for all the dopant concentrations, as shown in figure 4, and this preference becomes even weaker as the dopant concentration is increased. Figure 4 seems therefore to confirm the hypothesis that cation-vacancy interactions alone cannot explain the anomalous behaviour of the conductivity in these materials. These effects are almost absent in ScSZ at the temperatures of interest and they become even less important at higher dopant concentrations. We now focus on the importance of vacancy-vacancy interactions.
It might be anticipated that the vacancy-vacancy ordering would be affected by the vacancy-cation ordering. For this reason it is convenient to supplement the information on the vacancies in the real systems YSZ and ScSZ with that calculated on the ideal system i-YSZx, where all the cations are identical, so that the only vacancy-ordering effects are caused by the vacancy-vacancy interactions. The vacancy-vacancy rdfs for YSZ, ScSZ and i-YSZx have been studied as a function of the vacancy concentration and temperature. The peaks appear at the positions of the (simple cubic) oxide lattice sites, so that the first peak corresponds to a nearest-neighbour position along , the second to , the third to etc. If the vacancies were randomly distributed over the lattice sites, with no correlations between them, the vacancy-vacancy rdf would have the same appearance as an anion-anion rdf () for a perfect fluorite system (for instance PbF2) and we have included a plot of in both figures to illustrate the strength of the vacancy-vacancy correlations which are actually found: the relative intensities of the peaks in , relative to those in , give a guide to the probability of finding vacancies at these separations compared to the random distribution.
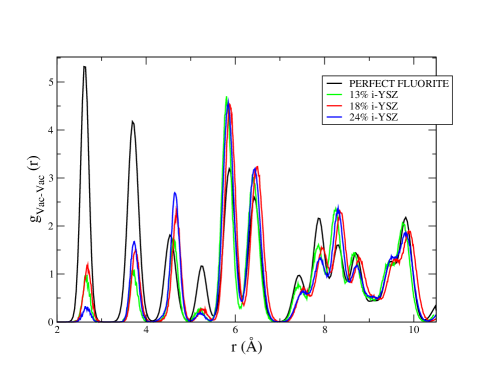
The data for YSZ are illustrated in the top part of figure 5 for a simulation at 1250 K and for three different dopant concentrations, . At small separations it is clear that the and relative positions are very unfavourable relative to the random distribution, and that the occupancy of the position is considerably enhanced. These propensities are consistent with the relative energy order which Bogicevic 6 found in ab initio studies of the stability of different vacancy pairs at 0 K. Indeed we have already seen in the preceding paper that the enthalpy difference between the <110> and <111> vacancy pairs coincides well with the energy difference found in the ab-initio studies. These propensities are also consistent with the interpretation 5 of the diffuse scattering in the = 0.24 sample discussed above. Also, these propensities do not seem to change as a function of the dopant concentrations studied here. It is interesting to note that occupancy of a pair of positions separated by the vector results in a substantial lattice distortion, as seen in the position of the corresponding peak in compared to . It is also clear that the vacancy-vacancy correlations extend well beyond the first unit cell and, indeed, the rdf only begins to match that of the random distribution for separations larger than 9 Å. The position seems particularly unfavourable, but there is an enhanced occupation of the and positions which suggests that the pairs of vacancies are themselves beginning to order. It is well known that at the composition Y4Zr3O12, corresponding to = 0.4, the YSZ system forms a compound which can be described as based on the fluorite structure with ordered vacancy pairs in positions which are themselves ordered along the direction and this appears to be the tendency which is being picked up in even at considerably smaller values.
The middle and bottom parts of figure 5 shows the vacancy-vacancy rdfs for ScSZ and i-YSZx. These show very similar trends to those observed in YSZ, with vacancies preferring pairing up in the direction. A comparison between the top and middle part of figure 5 shows that these ordering tendencies are quite similar between the two materials and that therefore they are not influenced by the dopant cation species. The implications of this finding are that the vacancy-vacancy ordering tendencies are not affected by the nature of the dopant species and that they are an intrinsic property of the fluorite lattice.
5 Discussion and conclusions
We have established that the strength of the vacancy-vacancy ordering effects is very similar in YSZ, ScSZ and i-YSZx. Goff et al. showed that the vacancy clustering affects the conductivity of these materials by reducing the mobility of the vacancies 5 and we have confirmed this idea in the simulated systems. It remains to show at what dopant levels the vacancy-vacancy ordering effects begin to influence the conductivity.
We can do this conveniently by calculating the -dependence of the conductivity of i-YSZx, in which there are no dopant-vacancy interactions, and comparing it with that of the real materials. This is shown in figure 6. The shape of the conductivity versus curve for i-YSZx follows closely that of ScSZ, especially in the vicinity of the maximum, although the i-YSZx values are systematically higher. At higher dopant concentrations, the two curves differ and this may reflect the fact that at these higher concentrations the equalisation of the charges on all the cations in i-YSZx exerts a significant effect on the interactions and also the short-range potential in this system is, on average, slightly less repulsive than in the real systems.
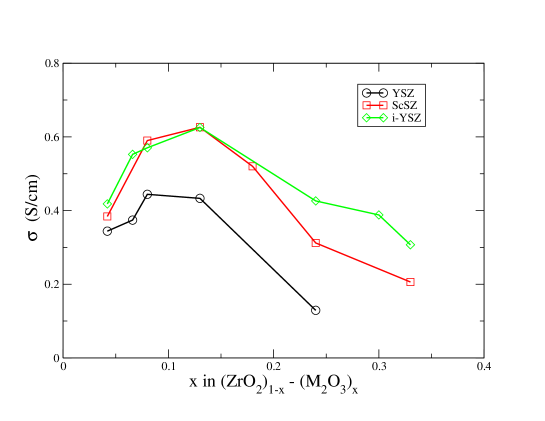
Figure 6 shows that, even if all the differences between the cation species are removed, a drop in the conductivity is still observed in i-YSZx and this happens at 13%, which is approximately the same vacancy concentration as in the “real” materials. This demonstrates that the observed anomalous behaviour is mainly caused by vacancy-vacancy interactions. Vacancy-vacancy interactions are caused by the fact that vacancies are charged and distort the lattice 6. As more vacancies are introduced in the material, they will try to minimise these interactions by ordering over the fluorite lattice. This limits the mobility of vacancies by correlating their motion, as explained in ref. 21. Unlike cation-vacancy interactions, which can be reduced by choosing a suitable dopant cation which matches the radius of Zr4+, vacancy-vacancy interactions cannot be minimised in such a way. This also implies that this is an intrinsic effect and therefore a “property” of the fluorite lattice. This explains the weak dependence of the maximum’s position on the dopant cation’s radius observed by Arachi et al. 2. Dopants with larger radii (Y3+, Dy3+, Gd3+) will increase the cation-vacancy interaction and therefore slightly lower the maximum’s position, but will not influence very much the vacancy-vacancy interactions, which is the main cause of the anomalous behaviour of the conductivity of these materials. For this reason ScSZ is probably the stabilised zirconia with the highest achievable ionic conductivity, as the Sc3+ radius matches that of Zr4+ most closely.
Acknowledgements
DM thanks the Moray Endowment Fund of the University of Edinburgh for the purchase of a workstation. DM also wishes to thank the EPSRC, School of Chemistry, University of Edinburgh, and the STFC CMPC for his PhD funding. STN wishes to thank the EU Research and Technology Development Framework Programme for financial support.
References
- Hull 2004 S. Hull, Rev. Prog. Phys., 2004, 67, 1233–1314
- Arachi et al. 1999 Y. Arachi, H. Sakai, O. Yamamoto, Y. Takeda and N. Imanishai, SOLID STATE IONICS, 1999, 121, 133–139
- Khan et al. 1998 M. Khan, M. Islam and D. Bates, JOURNAL OF MATERIALS CHEMISTRY, 1998, 8, 2299–2307
- Zacate et al. 1999 M. O. Zacate, L. Minervini, D. J. Bradfield, R. W. Grimes and K. E. Sickafus, Solid State Ionics, 1999, 243
- Goff et al. 1999 J. Goff, W. Haynes, S. Hull, M. Hutchings and K. Clausen, Phys. Rev. B, 1999, 59, 14202
- Bogicevic and Wolverton 2003 A. Bogicevic and C. Wolverton, Phys. Rev. B, 2003, 67, 024106
- Kilo et al. 2003 M. Kilo, C. Argirusis, G. Borchardt and R. Jackson, Phys. Chem. Chem. Phys., 2003, 5, 2219
- Krishnamurthy et al. 2000 R. Krishnamurthy, Y.-G. Yoon, D. J. Srolovitz and R. Car, J. Am. Ceram. Soc., 2000, 87, 1821
- Kushima and Yildiz 2009 A. Kushima and B. Yildiz, ECS Transactions, 2009, 25, 1599
- Shannon 1976 R. Shannon, ACTA CRYSTALLOGRAPHICA SECTION A, 1976, 32, 751–767
- Devanathan et al. 2006 R. Devanathan, W. Webber, S. Singhal and J. Gale, Solid State Ionics, 2006, 177, 1251
- Sawaguchi and Ogawa 2000 N. Sawaguchi and H. Ogawa, Solid State Ionics, 2000, 128, 183
- Pornprasertsuk et al. 2005 R. Pornprasertsuk, P. Ramanarayanan, C. Musgrave and F. Prinz, J. Appl. Phys., 2005, 98, 103513
- Martin 2006 M. Martin, J. Electroceram., 2006, 17, 765–773
- Devanathan et al. 2009 R. Devanathan, S. Thevuthasan and J. Gale, Phys. Chem. Chem. Phys., 2009, 11, 5506
- Sato et al. 2009 K. Sato, K. Suzuki, K. Yashiro, T. Kawada, H. Yugami, T. Hashida, A. Atkinson and J. Mizusaki, Solid State Ionics, 2009, 180, 1220
- Norberg et al. 2010? S. Norberg, S. Hull, L. Peng, J. Irvine, D. Marrocchelli and P. Madden, submitted to Journal of Material Chemistry, 2010?, 405403
- Irvine et al. 2000 J. Irvine, A. Feighery, D. Fagg and S. Garcia-Martin, Solid State Ionics, 2000, 136, 879–885
- Garcia-Martin et al. 2000 S. Garcia-Martin, M. Alario-Franco, D. Fagg, A. Feighery and J. Irvine, CHEMISTRY OF MATERIALS, 2000, 12, 1729–1737
- Garcia-Martin et al. 2005 S. Garcia-Martin, M. Alario-Franco, D. Fagg and J. Irvine, Journal of Material Chemistry, 2005, 15, 1903–1907
- Pietrucci et al. 2008 F. Pietrucci, M. Bernasconi, A. Laio and M. Parrinello, Phys. Rev. B, 2008, 78, 094301
- Kilner and Brook 1982 J. Kilner and R. Brook, Solid State Ionics, 1982, 6, 237 – 252
- Norberg et al. 2009 S. Norberg, I. Ahmed, S. Hull, D. Marrocchelli and P. Madden, J. Phys.: Condens. Matter, 2009, 215401
- Marrocchelli et al. 2009 D. Marrocchelli, P. A. Madden, S. T. Norberg and S. Hull, SOLID-STATE IONICS-2008, 506 KEYSTONE DRIVE, WARRENDALE, PA 15088-7563 USA, 2009, pp. 71–78
- Marrocchelli et al. 2009 D. Marrocchelli, P. Madden, S. Norberg and S. Hull, J. Phys.: Condens. Matter, 2009, 21, 405403
- Madden et al. 2006 P. Madden, R. Heaton, A. Aguado and S. Jahn, J. Mol. Struct.: THEOCHEM, 2006, 771, 9–18
- Wilson et al. 2004 M. Wilson, S. Jahn and P. Madden, JOURNAL OF PHYSICS-CONDENSED MATTER, 2004, 16, S2795–S2810
- Jahn and Madden 2007 S. Jahn and P. Madden, Phys. Earth Planet. Inter., 2007, 162, 129–139
- Marrocchelli et al. 2009 D. Marrocchelli, M. Salanne, P. A. Madden, C. Simon and P. Turq, MOLECULAR PHYSICS, 2009, 107, 443–452
- Marrocchelli et al. 2010 D. Marrocchelli, M. Salanne and P. A. Madden, Journal of Physics: Condensed Matter, 2010, 22, 152102
- Martyna et al. 1994 G. Martyna, D. Tobias and M. Klein, J. Chem. Phys., 1994, 101, 4177–4189
- Castiglione et al. 2001 M. Castiglione, M. Wilson, P. Madden and C. Grey, JOURNAL OF PHYSICS-CONDENSED MATTER, 2001, 13, 51–66
- Subbarao and Ramakrishnan 1979 E. Subbarao and T. Ramakrishnan, Fast Ion Transport in Solids, New York: Elsevier/North Holland, 1979, pp. 653–656
- Nakamura and Wagner 1986 A. Nakamura and J. J. Wagner, J. Electrochem. Soc., 1986, 1542, 133