Variable O vi and N v Emission from the X-ray Binary LMC X-3:
Heating of the Black Hole Companion11affiliation: Based on observations with (1) the NASA/ESA Hubble Space Telescope, obtained at the Space Telescope Science
Institute, which is operated by the Association of Universities for
Research in Astronomy, Inc., under NASA contract NAS 5-26555, (2)
the NASA-CNES/ESA Far Ultraviolet Spectroscopic Explorer
mission, operated by Johns Hopkins University, supported by NASA
contract NAS 5-32985, and (3) the 6.5 meter Magellan
Telescopes located at Las Campanas Observatory, Chile.
Abstract
Based on high-resolution ultraviolet spectroscopy obtained with the Far Ultraviolet Spectroscopic Explorer (FUSE) and the Cosmic Origins Spectrograph, we present new detections of O vi and N v emission from the black-hole X-ray binary (XRB) system LMC X-3. We also update the ephemeris of the XRB using recent radial velocity measurements obtained with the echelle spectrograph on the Magellan-Clay telescope. We observe significant velocity variability of the UV emission, and we find that the O vi and N v emission velocities follow the optical velocity curve of the XRB. Moreover, the O vi and N v intensities regularly decrease between binary phase = 0.5 and 1.0, which suggests that the source of the UV emission is increasingly occulted as the B star in the XRB moves from superior to inferior conjunction. These trends suggest that illumination of the B-star atmosphere by the intense X-ray emission from the accreting black hole creates a hot spot on one side of the B star, and this hot spot is the origin of the O vi and N v emission. However, the velocity semiamplitude of the ultraviolet emission, 180 km s-1, is lower than the optical semiamplitude; this difference could be due to rotation of the B star. Comparison of the FUSE observations taken in November 2001 and April 2004 shows a significant change in the O vi emission characteristics: in the 2001 data, the O vi region shows both broad and narrow emission features, while in 2004 only the narrow O vi emission is clearly present. Rossi X-ray Timing Explorer data show that the XRB was in a high/soft state in the Nov. 2001 epoch but was in a transitional state in April 2004, so the shape of the X-ray spectrum might change the properties of the region illuminated on the B star and thus change the broad vs. narrow characteristics of the UV emission. If our hypothesis about the origin of the highly ionized emission is correct, then careful analysis of the emission occultation could, in principle, constrain the inclination of the XRB and the mass of the black hole.
Subject headings:
stars: individual (LMC X-3)1. Introduction
How do black holes affect and interact with their surroundings? This is one of the highest priority questions of current astrophysics. Typically, the angular momentum of accreting material drives the formation of a disk around the black hole. The hot inner accretion disk is a powerful source of high-energy X-ray radiation, since immense gravity can cause substantial heating of matter spiraling in toward the black hole. In general, the X-rays emerging from the inner disk and corona can illuminate and ionize surrounding material, and in the case of black holes in binary star systems, the high-energy emission can affect matter on the surface of the companion star, in the stellar wind, in the accretion flows, or the outer disk. A significant amount of the X-ray radiation could be reprocessed into ultraviolet/optical photons. Such reprocessing might account for the continuum and/or some of the observed emission features in the UV/optical spectra of black-hole systems (although UV/optical continuum emission can also emanate directly from the accretion disk). For this reason, the study of UV spectra of black hole systems can provide valuable insights about the physics of accreting black holes and the impact they have on their surroundings. The analysis of the variability of the UV radiation from a binary star system as a function of orbital phase can determine the location of the region producing the UV photons, the physical conditions existing in the region, the mechanism producing the radiation, and kinematic parameters of the binary itself.
LMC X-3, which was first discovered by Leong et al. (1971), is an excellent target for this type of study. It is a bright X-ray binary (XRB) system in the Large Magellanic Cloud composed of a B3 V star (V ) and a central black-hole (Cowley et al. 1983, hereafter C83). It is one of the few black-hole candidates that are persistently luminous in X-rays and also bright enough to be observed with high-resolution ultraviolet spectrographs with good signal-to-noise (S/N). The black hole is believed to be undergoing accretion from its B-star companion via Roche lobe overflow with an orbital period of 1.7 days (C83; Soria et al. 2001). Spectroscopic observations of the B star indicate a large radial velocity semiamplitude, (C83). Although LMC X-3 has been intensively studied in the X-ray band, UV spectroscopic observations of this target are more sparse. The first Far Ultraviolet Spectroscopic Explorer (FUSE) observation of LMC X-3 was made by Hutchings et al. (2003, hereafter H03) in November 2001. During the 24 ks exposure, LMC X-3 was in its brightest X-ray phase. These observations revealed a broad emission feature in the vicinity of the O vi 1031.9,1037.6 doublet, which Hutchings et al. argue is due to the blend of the 1031.9 and 1037.6 Å lines (see their Figure 4). From this emission, they measured a shift in the O vi emission velocity between two binary phases of about 100-150 km s-1. Assuming the O vi emission arises in the inner parts of the black hole’s accretion disk, they conclude that the minimum mass of the B star and the black hole are 13 and 15 , respectively. However, their measurement of the velocity variation of O vi emission with binary phase suffers from some uncertainties. First, the ephemeris they used to determine the phase is from more than 20 years ago. Over such a long time baseline, the errors contained in the ephemeris could be accumulated, resulting in phases that are off by 0.1 at the level. Another source of uncertainty is the limited phase coverage of their observations. Due to the modest S/N of their FUSE data, Hutchings et al. summed their FUSE spectra into only two phase bins centered at phases = 0.53 and 0.70, which only loosely constrains , the velocity semiamplitude of the black hole. Overall, these limitations preclude any firm conclusions about the nature and implications of the O vi emission.
An updated ephemeris and expanded UV spectroscopy with better orbital coverage are needed to better constrain the implications of the UV emission lines and the characteristics of this XRB system. In this paper, we revisit LMC X-3 with a new ephemeris and new UV observations. We update the ephemeris of LMC X-3 based on high-resolution optical spectroscopy recently obtained with the 6.5m Magellan-Clay telescope. We also report new ultraviolet observations of LMC X-3 from two high-resolution instruments. First, we present temporal monitoring of the O vi emission using FUSE data with a much longer time baseline that provides more than three quarters of the LMC X-3 orbit. With the extended FUSE data, we detect narrow O vi emission from the binary system and measure the variations in velocity and intensity of the emission as a function of orbital phase. Second, we complement the O vi analysis with new observations of the N v 1238.8,1242.8 doublet obtained with the Cosmic Origins Spectrograph (COS) on board the Hubble Space Telescope (HST). The N v emission is detected at high significance in the COS data and provides corroborating evidence of the velocity and intensity variations of the highly ionized emission. During the time of the FUSE observations in 2004, LMC X-3 was also observed quasi-simultaneously in the X-ray bandpass with Chandra and the Rossi X-ray Timing Experiment (RXTE); see Wang et al. (2005) for full details. While our emphasis in this paper is on the UV emission lines, we also briefly comment on the affiliated X-ray observations. With the combination of this information, we investigate the following questions: (1) Does the O vi emission originate in the accretion disk, the ionized stellar wind, the illuminated surface of the B star, or a hot spot (e.g., from the spot where overflowing Roche lobe material impacts the accretion disk)? (2) Does the N v doublet emission arise in the same region as the O vi emission, i.e., are the N v and O vi features physically associated?
2. Observations
2.1. Optical Spectroscopy
Fifty three spectra of the optical counterpart (Warren & Penfold 1975) of the X-ray binary system were obtained on the nights of 2005 January 20–24, 2007 December 20–21, and 2008 February 27 – 2008 March 1 using the Magellan Inamori Kyocera Echelle (MIKE) spectrograph (Bernstein et al., 2003) on the 6.5 m Magellan-Clay telescope at Las Campanas Observatory. The instrument was used in the standard dual-beam mode with a slit and the binning mode. With a few exceptions, the typical exposure time was 1800 s. We only focus on spectra from the blue arm, which has a wavelength coverage of 3430–5140 Å and resolving power of . The radial velocities were determined from these new spectra using the fxcor task within IRAF and then fitted to a circular orbit model. The typical uncertainties of the radial velocities are 3.5 km s-1.
2.2. Ultraviolet Spectroscopy
2.2.1 FUSE Observations
Following the initial observations of Hutchings et al. (2003), LMC X-3 was observed again with FUSE in April 2004, and during the latter campaign quasi-simultaneous observations were recorded with Chandra and RXTE (Wang et al., 2005). The 2004 FUSE observations provided a total exposure time of 86 ks ( longer than the original FUSE observations obtained in H03). LMC X-3 is a variable source, and in April 2004 the average UV flux of the target turned out to be fainter in the relevant spectral regions compared to the UV flux when Hutchings et al. (2003) observed it in November 2001. Consequently, the S/N ratios are comparable in the FUSE data obtained in 2001 and 2004. However, the addition of the later data set significantly improves the orbital coverage of the O vi data. Both the 2001 and 2004 FUSE data were reduced with CALFUSE, version 3.0 (Dixon et al., 2007). It is important to note that the FUSE SiC channels suffer from scattered solar light problems in the 2004 data, and in this paper we only use the data from the LiF channels (details regarding the design and performance of FUSE can be found in Moos et al., 2000, 2002).
In Figure 1, we compare the FUSE observations of LMC X-3 obtained in 2001 (black histogram) and in 2004 (red histogram) in the wavelength range near the O vi doublet (in this figure, all of the data obtained in 2001 are accumulated into a single spectrum, and likewise all of the 2004 data are coadded).
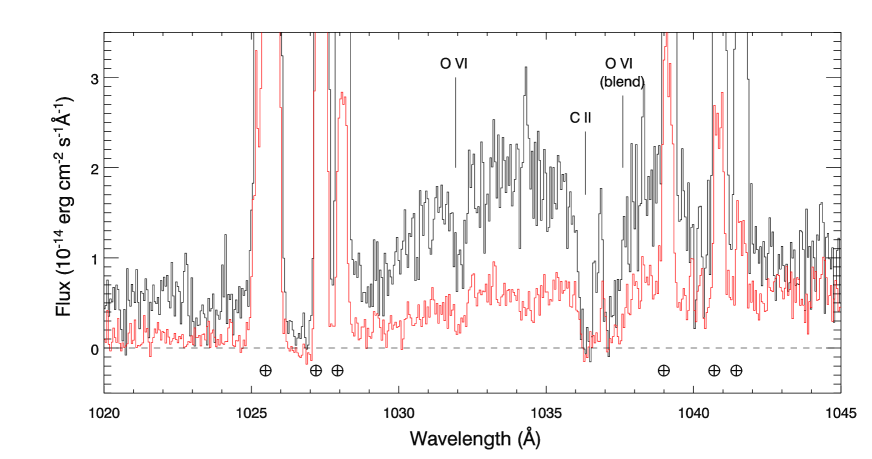
Bright airglow emission lines from the Earth’s atmosphere are marked (), and well-detected absorption lines from the O vi doublet and C ii 1036.3 near (heliocentric) 0 km s-1 are also labeled (analysis of the absorption lines in the FUSE spectrum of LMC X-3 is reported in Wang et al., 2005). The substantial variation in the UV flux is immediately obvious, but we note that the flux variation cannot be described with a simple scale factor applied to the entire spectrum. For example, the continuum is roughly two times brighter at 1045 Å but is roughly brighter near the putative O vi emission at 1034 Å. It is difficult to draw conclusions about the long-term UV flux variability with observations at only two epochs, but it appears that while the O vi emission intensity decreased along with the continuum in the 2004 observation, there is not a strict correlation. We will show below that narrow O vi emission lines are detected in the 2004 data, but it is possible that the broad O vi emission was not present in the later observation for some reason. The shape of the X-ray spectrum of LMC X-3 also changed between 2001 and 2004 (see §3.4), so it is possible that the changes of the broad O vi feature are related to changes in the X-ray flux.
2.2.2 COS Observations
There are some limitations of the spectroscopic UV dataset from FUSE presented in the previous section. First, LMC X-3 is a challenging target for FUSE because the UV flux is relatively low, so the data can be noisy. Also, in the FUSE wavelength range, emission lines from the Earth’s atmosphere are a potential source of confusion (see below). Moreover, FUSE is no longer operating, so we cannot contemplate follow-up FUSE spectroscopy. Fortunately, all of these problems can be overcome with COS (Green et al., 2003), the new spectrograph on HST, with some caveats. COS has limited sensitivity in the 912 1130 Å range (McCandliss et al., 2010), but this region can only be observed with COS at low spectral resolution ( 2000). COS could observe LMC X-3 with higher resolution () at Å, but at the expense of missing the OVI doublet. However, other highly ionized species are accessible in the Å range (e.g., N v 1238.8, 1242.8 or C IV 1548.2,1550.8).

We have recently observed LMC X-3 with COS using the high-resolution G130M and G160M modes (Program 11642). The target was observed on 15 December 2009 with total exposure times of 16.9 ks (G130M) and 2.7 ks (G160M). The data were calibrated with the pipeline CALCOS (version 2.11b), and major fixed-pattern noise features due to grid wires in the cross delay line detector were removed with a flat field developed by K. France. This flat field does not correct for all types of fixed-pattern noise in COS spectra (e.g., Sahnow et al., 2010), but for the measurement of broad and bright emission lines presented in this paper, the lower-level fixed pattern noise does not have a significant impact on the results.
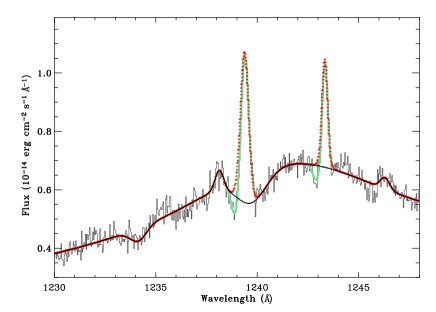
The regions of the COS G130M and G160M spectra of LMC X-3 covering the N v and C IV emission lines are shown in Figure 2. Emission in these species was previously detected from LMC X-3 by Cowley et al. (1994) using low-resolution spectra obtained with the Faint Object Spectrograph on HST as well as the International Ultraviolet Explorer. Our new COS data offer two advantages over the previous observations: (1) the spectral resolution is 10 times higher, so variations in the velocity centroids can be measured more accurately, and (2) the S/N is higher, and consequently the data can be divided into phase bins for investigation of emission variability vs. binary phase. As we will show below, the N v velocities are consistent with the optical orbital velocities of LMC X-3 and are also consistent with the velocity trends exhibited by the O vi doublet. The G160M spectrum is considerably noisier and the C IV emission features are weaker, so in this paper we will focus on the velocity and amplitude variations of the N v lines and their comparison to the O vi emission.
3. Results
3.1. New Ephemeris of LMC X-3
We have analyzed the optical observations of LMC X-3 in a manner analogous to the recent study of LMC X-1 (Orosz et al., 2009). Among the 53 optical spectra that we obtained with the Magellan-Clay telescope, we exclude seven observations from our analysis due to their relatively large residuals in the radial velocity.111Five of the seven outliers were obtained on the same night, so it is possible that a subtle problem with the wavelength calibration on that particular night compromised those measurements. The remaining 46 radial velocities are then fitted to a circular orbit model, which returns the systemic velocity , the time of inferior conjunction of the optical star (phase 0), and the velocity semiamplitude of the secondary , when given the value of the orbital period . We construct a periodogram as shown in the top panel of Figure 3 using a wide range of trial periods. The best fit indicates days and , where the uncertainties on the individual measurements are scaled to give .
We also tried including the radial velocities published in C83 in order to refine our measurement. However, the systemic velocities obtained from the two data sets are quite different: 406 km for MIKE and 310 km for Cowley et al. The cause for this difference is not clear, although it is not uncommon to find that the systemic velocity changes depending on what line is used (one even sees shifts when one uses different Balmer lines). We thus first simply subtracted the respective systemic velocities from the two data sets before fitting sine curves as a function of trial period. The periodogram for the combined data is shown in the middle panel of Figure 3. The minimum value of occurs for days and , which are very close to the values derived from the MIKE data alone (top panel of Figure 3) but with much smaller uncertainties in P. In this paper, we use this more accurate ephemeris to determine the orbital phase of the UV observations of LMC X-3. The bottom panel in Fig. 3 is the zoom-in near the minimum of the middle panel. This panel clearly shows that all other possible alias periods are ruled out with high confidence. The fitted velocity amplitude is , comparable to the value derived by Cowley et al. (1983). A detailed description of the optical spectroscopy and a full discussion of the improved dynamical model used here to obtain the radial velocities will be presented in a separate paper.

3.2. O vi Doublet Emission
The FUSE observations cover about three quarters of the XRB orbit. In order to measure the O vi emission velocities and intensities as a function of orbital phase, we divide the FUSE exposures into 5 binary phase bins, which provides reasonably good resolution of trends vs. phase while still maintaining adequate S/N in the spectra from each bin. Fig. 4 shows the spectra of these 5 phase bins.
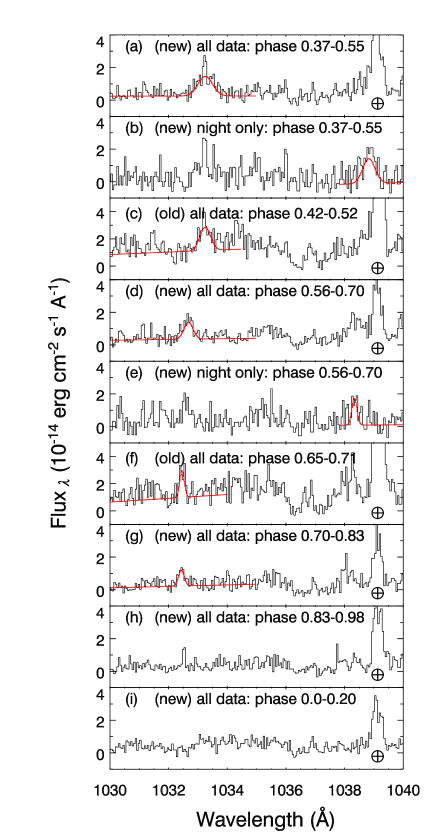
In this and several other figures, we refer to the 2001 FUSE observations from H03 as the “old” data and the later FUSE observations as the “new” data. The old data were binned in orbital phase in a similar way and are also represented in Figure 4. Due to the low-Earth orbit of the FUSE satellite, many airglow emission lines from the Earth’s outer atmosphere are present in the FUSE wavelength range (Feldman et al., 2001). Strong airglow emission lines are readily apparent and easily identified (marked with ), but weaker telluric emission could be a source of contamination. Most of the airglow emission lines are excited by sunlight and are only present in data recorded on the day side of the FUSE orbit. Since the photons are time tagged, it is straightforward to extract spectra using only photons detected during the night portion of the orbit. While this reduces the overall S/N, night-only spectra are useful for supressing the strong airglow emission lines (which sometimes blend with – or mask entirely – spectral features of interest) and for assessing whether an emission feature is a bogus identification due to confusion with terrestrial airglow emission. So, we also show in Figure 4 some spectra extracted using night-only data. Since the velocities of the emission lines are of particular interest, we also show in Figure 5 the phase-binned FUSE spectra plotted versus heliocentric velocity.
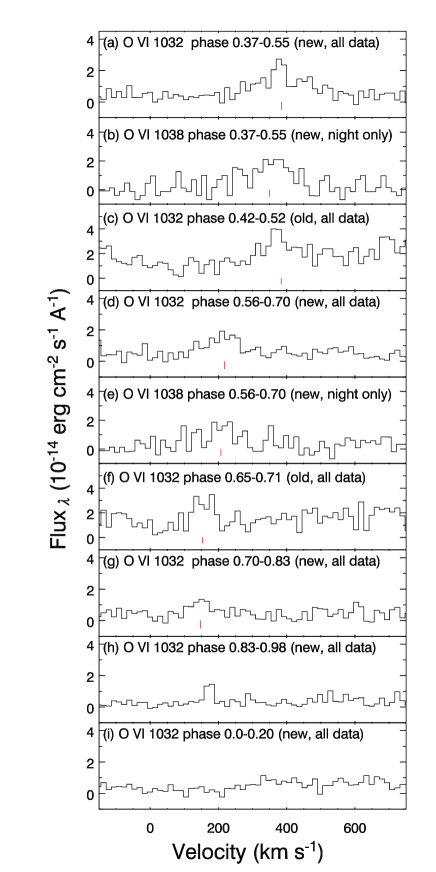
The spectra in Figures 4 and 5 are arranged from top to bottom according to phase (as indicated by the labels in each panel). From inspection of these figures, we can recognize emission from both lines of the O vi doublet that regularly shifts in velocity as a function of the XRB orbital phase. Interestingly, the intensity of the O vi emission also appears to change with phase: the O vi emission appears to be brightest near inferior conjunction of the X-ray source (orbital phase 0.5), and it fades and disappears into the noise at superior conjunction (phase 0). As we will show below, similar behavior is observed in the N v doublet. To quantify this observation, we have fitted Gaussians to the emission features, and the O vi velocity centroids and line widths indicated by the fitting exercise are summarized in Table 1.
| O vi | FUSE | Binary | FWHM | |
|---|---|---|---|---|
| Transition(Å) | Observation Date | Phase | (km s-1) | (km s-1) |
| 1031.93 | 2004-04 (day+night) | 0.37-0.55 | 385 11 | 171 26 |
| 1031.93 | 2001-11 (day+night) | 0.42-0.52 | 384 13 | 126 31 |
| 1037.62 | 2004-04 (night only) | 0.37-0.55 | 350 13 | 143 32 |
| 1031.93 | 2004-04 (day+night) | 0.56-0.70 | 218 9 | 106 22 |
| 1037.62 | 2004-04 (night only) | 0.56-0.70 | 207 8 | 59 16 |
| 1031.93 | 2001-11 (day+night) | 0.65-0.71 | 154 8 | 53 16 |
| 1031.93 | 2004-04 (day+night) | 0.70-0.83 | 147 8 | 68 18 |
As noted above, one concern about the identification of the O vi emission is that the features could be contaminated by terrestrial airglow lines – there are several molecular N2 emission features in the vicinity of the O vi 1031.9 feature, e.g., N2 b(1,2) and N2 b’(9,6) (Feldman et al., 2001), and strong telluric emission is present near O vi 1037.6. However, there are several indications that these emission features we identify as O vi emission lines do not arise in the Earth’s atmosphere. First, the velocity centroids of the features regularly shift with orbital phase; this would not occur if the lines were telluric. Second, there are stronger N2 features at other wavelengths in the FUSE band (see Feldman et al., 2001), and the absence of those stronger N2 features indicates that the N2 b(1,2) and N2 b’(9,6) emissions are negligible. Third, in the night-only spectra the airglow emissions in this range disappear but the candidate LMC X-3 emission lines remain apparent. Finally, the O vi trends are corroborated by the N v emission lines in the COS data, which are clearly detected at high significance and are not affected by telluric lines.
3.3. N v Doublet Emission
The region of the COS G130M spectrum of LMC X-3 shown in Figure 2 clearly shows significant emission from both lines of N v along with weaker N v absorption. Upon initial inspection, the N v features seem reminiscent of P-Cygni profiles (the C IV doublet shows similar P-Cygni-like characteristics), and it is tempting to attribute the features to a stellar wind from the B-star companion of the LMC X-3 black hole. While this is a possible origin for the emission features, one must bear in mind that the foreground highly ionized absorption from the ISM of the Milky Way (and from the corona of the LMC) is strong in the direction of the Magellanic Clouds (e.g., Wakker et al., 1998; Howk et al., 2002), so the N v and other highly ionized absorption is likely to arise (at least partially) in the foreground ISM and might have nothing to do with LMC X-3 itself. We also note that the LMC X-3 spectral features appear to be narrower than the P-Cygni profiles typically seen from normal B stars (cf. Grady et al., 1987; Prinja, 1989), and the variability of the emission suggests an alternative origin, as we discuss below.
The COS observation of the LMC X-3 covers the XRB orbit between phase 0.66 and 0.89 based on our new ephemeris. In a fashion analogous to our treatment of the FUSE data, we divide the G130M exposures into five phase bins and plot the velocity variation of both lines of the N v doublet with binary phase in Figure 6. We used Gaussian and Voigt functions to model, respectively, the N v emission associated with LMC X-3 and the N v absorption arising in the foreground Milky Way gas. In each phase bin, the centroids and widths of the Galactic N v absorption lines were determined by using all the observations (instead of only the subset data for that particular single phase bin) since any foreground Milky Way absorption should not change with the binary phase. As can be seen from Figure 6, this procedure produced reasonably good overall fits, which supports the notion that the absorption is mostly due to foreground material unrelated to LMC X-3. It is important to note that while the core of the COS line-spread function (LSF) provides the expected spectral resolution, the COS LSF has broad wings (Ghavamian et al., 2009). To account for these wings, the model profiles were convolved with the COS LSFs, at appropriate wavelengths, from Ghavamian et al. (2009). The velocity centroids and line widths of the N v lines measured in this way are summarized in Table 2.
| N v | COS Observation | Binary | FWHM | ||
|---|---|---|---|---|---|
| Transition(Å) | Start Time(UT) | Duration(s) | Phase | (km s-1) | (km s-1) |
| 1238.82 | 2009-12-15 04:07:56 | 1885 | 0.66-0.68 | ||
| 1242.80 | 2009-12-15 04:07:56 | 1885 | 0.66-0.68 | ||
| 1238.82 | 2009-12-15 04:47:49 | 3014 | 0.68-0.70 | ||
| 1242.80 | 2009-12-15 04:47:49 | 3014 | 0.68-0.70 | ||
| 1238.82 | 2009-12-15 07:57:18 | 5411 | 0.76-0.80 | ||
| 1242.80 | 2009-12-15 07:57:18 | 5411 | 0.76-0.80 | ||
| 1238.82 | 2009-12-15 10:40:19 | 3270 | 0.82-0.85 | ||
| 1242.80 | 2009-12-15 10:40:19 | 3270 | 0.82-0.85 | ||
| 1238.82 | 2009-12-15 12:22:19 | 3270 | 0.87-0.89 | ||
| 1242.80 | 2009-12-15 12:22:19 | 3270 | 0.87-0.89 | ||
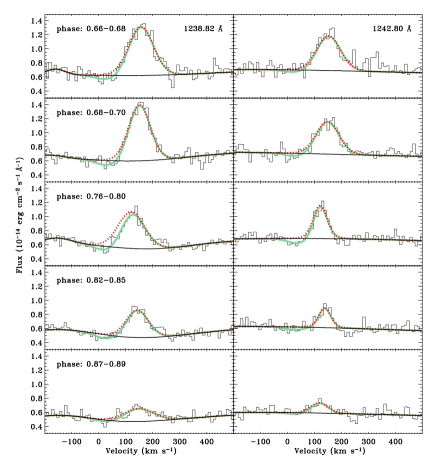
As we can see from Figure 6 and Table 2, the velocity centroids of the N v emission lines do not change much in the five phase bins extracted from the COS data set. However, the COS observations were randomly scheduled with respect to the XRB phase (i.e., no scheduling constraints were placed on the COS program in order to observe the system at some particular phase), and as we will show in §4, the COS observations happened to be obtained near an extremum of the XRB radial velocity curve when the velocities are not expected to change much. Moreover, the N v velocity centroids are consistent with the O vi velocities recorded in roughly the same phase (see below). Perhaps more interestingly, the N v intensities change with phase in the same way as the O vi: the N v emission intensity decreases steadily going from phase to phase 0.9 (see Figure 6). This is surely an important clue about the origin of the N v and O vi emission, and we will return to this in §4.
3.4. X-ray Observations
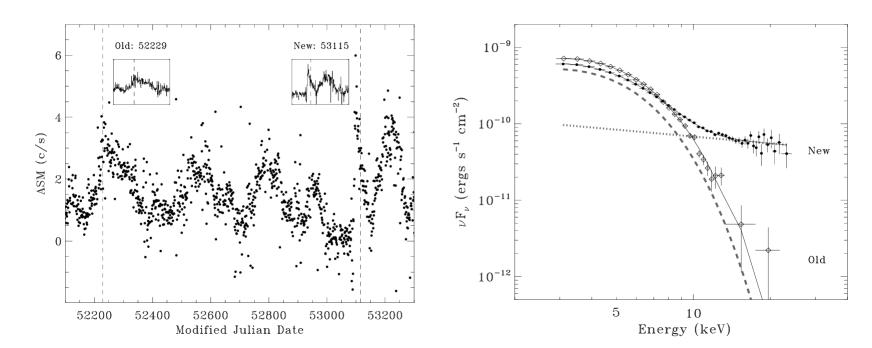
Figure 7 compares the X-ray characteristics of LMC X-3 during the FUSE observations in 2001 and 2004. Although LMC X-3 usually occupies a soft state in which the X-ray spectrum is dominated by emission from the accretion disk, it was in a faint and transitional state near the time of the 2004 FUSE observations (this is indicated by the presence of a strong power-law component in the observed spectrum; see Cui et al., 2002). As shown in Figure 7, LMC X-3 appeared to be nearly as bright in X-rays during the 2004 FUSE observations as it was during the 2001 observations of H03. This is not accidental; the 2004 FUSE observations were part of a coordinated Chandra/FUSE target-of-opportunity program that was triggered when the RXTE ASM showed that LMC X-3 was entering a bright state.222This was done to maximize the S/N of the Chandra grating spectroscopy, which was originally initiated for the detection of X-ray absorption lines. See Wang et al. (2005) for further details. However, as can be seen from the left panel of Figure 7, the 2004 increase in X-ray brightness was associated with a short-lived X-ray flare, whereas the 2001 data were recorded when LMC X-3 was undergoing one of its more gradual (and more typical) upward modulations in X-ray brightness. Thus, while the X-ray brightness was comparable in 2001 and 2004, it is likely that the object was in a different type of X-ray state. To further compare the X-ray characteristics of the XRB during the FUSE observations, the right panel of Figure 7 shows spectra from pointed RXTE observations obtained very close to the times of the FUSE studies. From this comparison we see that LMC X-3 was in the usual soft state around the time of the 2001 observations and the associated spectrum is well fitted with a multicolor disk model. However, LMC X-3 was in a significantly harder spectral state when the 2004 FUSE data were obtained. The spectrum for the latter observation requires a second power-law component aside the disk component. The best-fit parameters from the two models are summarized in Table 3.
| Disk Componentb | Power-law Componentc | ||||
|---|---|---|---|---|---|
| Observation | |||||
| Time | ( cm-2) | (keV) | |||
| 2001 | 4.74 | — | — | ||
| 2004 | 4.74 | ||||
4. Discussion: Nature of the UV Line Emission
Where do the ultraviolet emission lines originate? Emission from O vi arising in interstellar plasma has been frequently detected (e.g., Dixon et al., 2006), but strong N v emission lines like those shown in Figure 2 are never seen from interstellar clouds, so it is most likely these emission lines are intrinsic to the LMC X-3 system. Moreover, lines from interstellar gas should be stationary, but the LMC X-3 emission-line velocities seem to follow the velocity curve of the XRB.
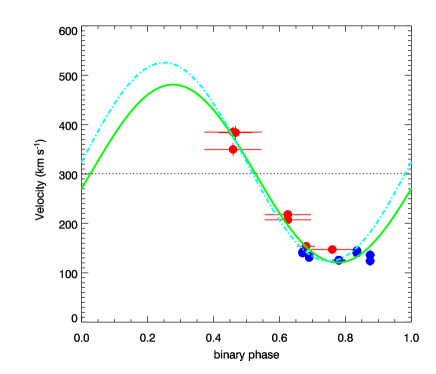
To show the UV emission-line velocity trends more quantitatively, we plot the velocity centroids of the O vi and N v emission lines as a function of the binary phase (derived from the new ephemeris) in Figure 8. In this figure, the O vi and N v emission velocities are plotted with red and blue filled circles, respectively; the horizontal bars on each point indicate the phase range associated with each measurement, and the vertical bars represent the formal velocity uncertainties. When we fit a sinusoidal curve to the UV data (green curve), we find an orbital semiamplitude of and a phase deviation (compared to the optical data) of . The systemic velocity of LMC X-3 inferred from the fit to the UV measurements is 301 km , comparable to the systemic velocity ( 7 km s-1) obtained in C83, assuming a circular orbit. The cyan dashed-dotted line shows a fit to the UV velocities in which the sinusoid is forced to be in phase with the optical curve but the semiamplitude is allowed to vary; we see that this fit is comparably good. Therefore, the UV emission velocities generally follow the trend of the optical velocities in the orbital phase, but the UV velocity semiamplitude is lower than the optical semiamplitude ().
.
If the O vi and N v emission lines arise in the atmosphere of the B star, they should follow the optical orbital velocities of the star. For a circular orbit, which is most likely for LMC X-3 since the 1.7 d orbit should quickly circularize, the radial velocity curve should be a standard sinusoid. This behavior is approximately seen in the UV emission velocities shown in Figure 8. It is possible that there are systematic uncertainties in the UV velocities (e.g., due to line shapes that are more complex than our assumed single Gaussian plus interstellar absorption) that are not adequately reflected by the formal error bars from the single-Gaussian fits, but the velocities are sufficiently well-constrained to show that they follow the general velocity trend of the optical B-star measurements and that the UV semiamplitude is clearly different from the optical semiamplitude.
.
The similar (but not identical) behavior of the UV vs. optical velocities could naturally occur if one side of the B star is illuminated and hence heated by the X-ray/UV continuum emission originating near the black hole. In this case, the UV and B-star orbital velocities would generally follow each other, but rotation of the B star could cause the UV emission to have a somewhat different semiamplitude. Cowley et al. (C83) report that the B-star has sin = km s-1. A hot spot on the B star that remains pointing in the direction of the black hole would only be rotating toward or away from the observer depending on where the star is in the course of its orbit, and since the velocity centroid would be some sort of weighted mean of the portion of the spot visible to the observer, the effective component of the rotation velocity along the line of sight could be less than the full sin value. To test this hypothesis, it would be helpful to obtain observations of LMC X-3 covering the phase = 0.2 0.5 portion of the orbit. It would also be helpful to carry out detailed modeling of this scenario, but such modeling is beyond the scope of this paper.
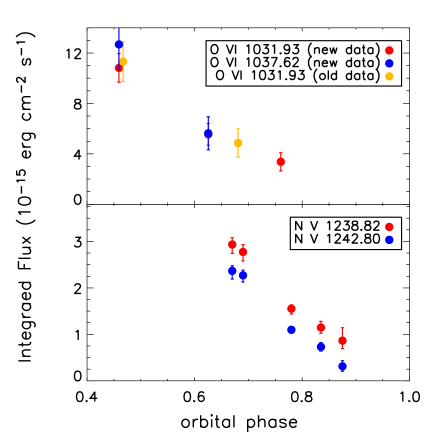
However, we note that the intensity variations of the O vi and N v emission lines are broadly consistent with this idea. Figure 9 shows the variations of the integrated flux in the O vi and N v emission vs. orbital phase. The gradual decrease of the integrated O vi and N v flux occurs over binary phases when the accreting black hole moves from inferior conjunction to quadrature to superior conjunction. At superior conjunction, the O vi emission is too weak to be reliably measured, and the N v emission is greatly suppressed (see Figures 5 and 6). During this time period, the hemisphere of the B star directly facing the black hole would move from fully illuminated to partially covered to completely occulted. The observed UV emission intensity variations appear to be consistent with this hypothesis.
A similar hypothesis has been proposed to explain the similar N v emission lines and other emission features detected in the UV spectra of a low-mass X-ray binary Cygnus X-2 (Vrtilek et al., 2003). By measuring the radial velocities of the emission lines and comparing the observed line profiles with the predictions from models of line emission from an X-ray-heated accretion disk corona, Vrtilek et al. (2003) suggest that most of the line emission detected in the UV spectra of Cygnus X-2 is from the illuminated surface of the companion star. For LMC X-3, if the idea is supported by future work, this could provide an important constraint on the inclination of this X-ray binary (and thus the mass of the black hole) as well as insight on how black holes affect their surroundings, and the properties of their companions in particular.
Our interpretation of the detected variable O vi and N v emission from the X-ray binary LMC X-3 seems promising, but it is far from being conclusive. There exists considerable uncertainties in decomposition of the N v emission feature (§3.3). There could be weak P-Cygni profiles in the N V and C IV regions. For the absorption part of the P-Cygni profile, the importance and shape of the wind contribution versus the contribution from the foreground ISM is difficult to distinguish and accurately measure. We also can not fully exclude contributions from other plausible components of the LMC X-3 system, such as stellar and/or accretion disk winds as detected or predicted in other systems (Boroson et al., 2007; Raymond, 1993). Our hypothesis requires further observational and theoretical testing.
References
- Bernstein et al. (2003) Bernstein, R., Shectman, S. A., Gunnels, S. M., Mochnacki, S., & Athey, A. E. 2003, Proc. SPIE, 4841, 1694
- Boroson et al. (2007) Boroson, B. S., Vrtilek, S. D., Raymond, J. C., & Still, M. 2007, ApJ, 667, 1087
- Cowley et al. (1983) Cowley, A. P., Crampton, D., Hutchings, J. B., Remillard, R., & Penfold, J. E. 1983, ApJ, 272, 118
- Cowley et al. (1994) Cowley, A. P., Schmidtke, P. C., Hutchings, J. B., & Crampton, D. 1994, ApJ, 429, 826
- Cui et al. (2002) Cui, W., Feng, Y.X., Zhang, S.N., Bautz, M.W., Garmire, G.P., & Schulz, N.S. 2002, ApJ, 576, 357
- Dixon et al. (2006) Dixon, W. V., Sankrit, R., & Otte, B. 2006, ApJ, 647, 328
- Dixon et al. (2007) Dixon, W. V., et al. 2007, PASP, 119, 527
- Feldman et al. (2001) Feldman, P.D., Sahnow, D.J., Kruk, J.W., Murphy, E.M., & Moos, H.W. 2001, J. Geophys. Res., 106, 8119
- Ghavamian et al. (2009) Ghavamian, P. et al. 2009, COS Instrument Science Report 2009-01(v1), (Baltimore: STScI)
- Grady et al. (1987) Grady, C. A., Bjorkman, K. S., & Snow, T. P. 1987, ApJ, 320, 376
- Green et al. (2003) Green, J. C., Wilkinson, E., & Morse, J. A. 2003, Proc. SPIE, 4854, 72
- Howk et al. (2002) Howk, J. C., Savage, B. D., Sembach, K. R., & Hoopes, C. G. 2002, ApJ, 572, 264
- Hutchings et al. (2003) Hutchings, J.B., Winter, K., Cowley, A.P., Schmidtke, P.C., & Crampton, D. 2003, AJ, 126, 2368
- Leong et al. (1971) Leong, C., Kellogg, E., Gursky, H., Tananbaum, H., & Giacconi, R. 1971, ApJ, 170, L67
- McCandliss et al. (2010) McCandliss, S. R., France, K., Osterman, S., Green, J. C., McPhate, J. B., & Wilkinson, E. 2010, ApJ, 709, 183
- Moos et al. (2000) Moos et al. 2000, ApJ, 538, L1
- Moos et al. (2002) Moos et al. 2002, ApJS, 140, 3
- Orosz et al. (2009) Orosz, J. A., et al. 2009, ApJ, 697, 573
- Prinja (1989) Prinja, R. K. 1989, MNRAS, 241, 721
- Raymond (1993) Raymond, J. C. 1993, ApJ, 412, 267
- Sahnow et al. (2010) Sahnow, D. J. et al. 2010, BAAS, 41, 503
- Soria et al. (2001) Soria R., Wu K., Page M. J., & Sakelliou I. 2001, A&A, 365, L273
- Vrtilek et al. (2003) Vrtilek S. D. et al. 2003, PASP, 115, 1124
- Wakker et al. (1998) Wakker, B., Howk, J. C., Chu, Y.-H., Bomans, D., & Points, S. D. 1998, ApJ, 499, L87
- Wang et al. (2005) Wang, Q. D., et al. 2005, ApJ, 635, 386
- Warren & Penfold (1975) Warren, P. R., & Penfold, J. E. 1975, MNRAS, 172, 41P