Optical Spectroscopy and Nebular Oxygen Abundances of the
Spitzer/SINGS Galaxies
Abstract
We present intermediate-resolution optical spectrophotometry of galaxies obtained in support of the Spitzer Infrared Nearby Galaxies Survey (SINGS). For each galaxy we obtain a nuclear, circumnuclear, and semi-integrated optical spectrum designed to coincide spatially with mid- and far-infrared spectroscopy from the Spitzer Space Telescope. We make the reduced, spectrophotometrically calibrated one-dimensional spectra, as well as measurements of the fluxes and equivalent widths of the strong nebular emission lines, publically available. We use optical emission-line ratios measured on all three spatial scales to classify the sample into star-forming, active galactic nuclei (AGN), and galaxies with a mixture of star formation and nuclear activity. We find that the relative fraction of the sample classified as star-forming versus AGN is a strong function of the integrated light enclosed by the spectroscopic aperture. We supplement our observations with a large database of nebular emission-line measurements of individual H ii regions in the SINGS galaxies culled from the literature. We use these ancillary data to conduct a detailed analysis of the radial abundance gradients and average H ii-region abundances of a large fraction of the sample. We combine these results with our new integrated spectra to estimate the central and characteristic (globally-averaged) gas-phase oxygen abundances of all SINGS galaxies. We conclude with an in-depth discussion of the absolute uncertainty in the nebular oxygen abundance scale.
Subject headings:
atlases — galaxies: abundances — galaxies: fundamental parameters — galaxies: ISM — galaxies: stellar content — techniques: spectroscopic1. Introduction
The Spitzer Infrared Nearby Galaxies Survey (SINGS) was designed to investigate the star formation and dust emission properties of nearby galaxies using the full complement of instruments available on the Spitzer Space Telescope (Kennicutt et al. 2003a). With the survey now complete, SINGS has delivered to the astrophysics community among the most detailed mid- and far-infrared wide-field images and spectral maps of nearby galaxies ever obtained.111Publically available at http://sings.stsci.edu and http://irsa.ipac.caltech.edu/data/SPITZER/SINGS.
Supplemented with ancillary multi-wavelength observations from the ultraviolet (UV) to the radio, these data have facilitated a wide range of studies of the global and small-scale interstellar medium (ISM) properties of galaxies and active galactic nuclei (AGN), including: analyses of the mid-infrared nebular, aromatic, and molecular hydrogen spectra of galactic nuclei and extranuclear H ii regions (Smith et al. 2004, 2007; Roussel et al. 2007; Prescott et al. 2007; Dale et al. 2006, 2009); the construction of broadband µm galaxy spectral energy distributions (SEDs; Dale et al. 2005, 2007), and their interpretation using physical dust models (Draine et al. 2007; Muñoz-Mateos et al. 2009a, b); detailed studies of the mid- and far-infrared morphologies of both low-mass dwarfs (Cannon et al. 2006a, b; Walter et al. 2007) and massive early- and late-type galaxies (Regan et al. 2004; Murphy et al. 2006; Bendo et al. 2007); and the development of robust global and spatially resolved optical and infrared (IR) star formation rate (SFR) diagnostics (Calzetti et al. 2005, 2007, 2010; Kennicutt et al. 2007, 2009; Boquien et al. 2009, 2010), among others.
In addition to imaging and spectroscopy with Spitzer, SINGS has also assembled a large, homogeneous database of multi-wavelength observations designed to maximize the scientific impact and legacy value of the survey (Kennicutt et al. 2003a; Meurer et al. 2006; Dale et al. 2005; Daigle et al. 2006; Dale et al. 2007; Calzetti et al. 2007; Braun et al. 2007; Dicaire et al. 2008; Walter et al. 2008). As part of this larger effort, this paper presents intermediate-resolution, ( Å FWHM), high signal-to-noise ratio ( pixel-1) optical ( Å) spectrophotometry of the SINGS galaxies on several spatial scales designed to match the coverage of the Spitzer spectroscopy, ranging from the inner nucleus, to spectra that enclose a significant fraction () of the integrated optical light. In addition to making the reduced one-dimensional spectra publically available, we also provide measurements of the strong nebular emission lines corrected for underlying stellar absorption using state-of-the-art stellar population synthesis models.
These optical spectra provide a valuable complement to the SINGS multi-wavelength dataset in several respects. First, the calibrated emission-line spectra provide measures of the instantaneous SFR and dust reddening that can be compared to independent measures of SFRs and extinctions derived from the UV and IR (e.g., Kennicutt et al. 2009; Calzetti et al. 2007, 2010; Rieke et al. 2009). The forbidden-line spectra provide gas-phase metal abundances and constrain the nature of the primary ionizing radiation sources (i.e., AGN vs. star formation), both of which are important for interpreting the infrared line spectra and SEDs, and for probing dependences of the dust properties and star formation on metallicity (e.g., Smith et al. 2007; Draine et al. 2007). Finally the optical stellar continuum provides valuable constraints on the stellar populations, and the properties of the stars that are responsible for heating the dust (e.g., Gordon et al. 2000; Cortese et al. 2008).
In this paper we combine our optical spectra with spectroscopy of individual H ii regions culled from the literature to derive the nebular (gas-phase) metallicities222Unless otherwise indicated, in this paper we use the term metallicity to mean the gas-phase oxygen-to-hydrogen abundance ratio, . For reference, the currently favored solar oxygen abundance in these units is (Asplund et al. 2009). of the SINGS galaxies. Dust grains, which absorb and reradiate a significant fraction of the bolometric luminosity of a galaxy into the IR, are composed of heavy elements such as C, O, Mg, Si, and Fe (Draine 2003). Therefore, the infrared SED of a galaxy is fundamentally related to its chemical composition. For example, numerous studies have reported a link between the observed deficit of polycyclic aromatic hydrocarbon (PAH) emission in the mid-IR of galaxies more metal-poor than a threshold gas-phase oxygen abundance of (e.g., Madden 2000; Engelbracht et al. 2005, 2008), which may be due, in part, to a paucity of metals from which to form these complex molecules (e.g., Draine et al. 2007). Integrated and monochromatic infrared SFR calibrations must also carefully consider metallicity effects, as galaxies at UV/optical wavelengths become increasingly transparent with decreasing metallicity and dust content (e.g., Draine et al. 2007; Calzetti et al. 2007, 2010; Zhu et al. 2008).
We organize the remainder of the paper as follows. In §2 we briefly describe the SINGS sample, present our optical spectrophotometry and measurements of the fluxes and equivalent widths of the strong optical emission lines, and describe our spectroscopic database of H ii regions in the SINGS galaxies. We classify the sample into star-forming galaxies and AGN in §3, and present a detailed analysis of the nebular oxygen abundances of the sample based on an analysis of our optical spectra and the H ii-region observations in §4. In §5 we provide a detailed discussion of the discrepancy among abundances derived using different strong-line methods. Finally, we summarize our results in §6.
2. Observations
2.1. SINGS Sample and Properties
The SINGS galaxies were selected using three principal criteria — morphology, optical luminosity, and infrared-to-optical luminosity ratio — such that the sample would span the broadest possible range of star formation and dust properties exhibited by nearby, normal galaxies (Kennicutt et al. 2003a). An approximate distance limit, Mpc, was also imposed so that the interstellar medium could be studied with adequate spatial resolution with Spitzer. Galaxies hosting powerful AGN were intentionally excluded from the sample as a more complete sample of AGNs have been observed as part of complementary Spitzer Guaranteed Time Observer (GTO) programs (e.g., Weedman et al. 2005; Wu et al. 2009).
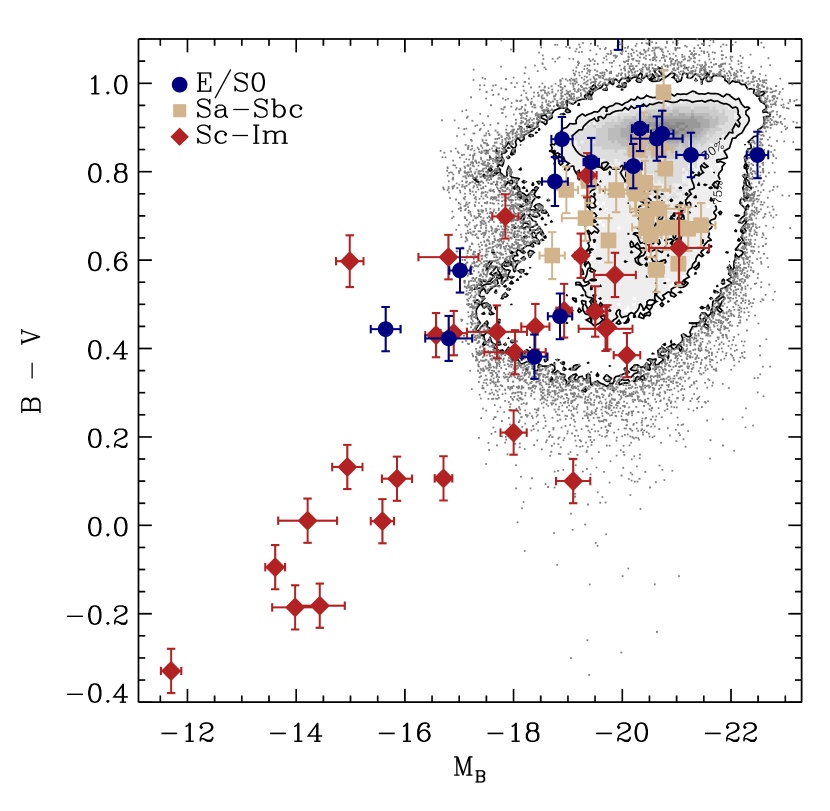
Table Optical Spectroscopy and Nebular Oxygen Abundances of the Spitzer/SINGS Galaxies presents some basic properties of the sample used in the current analysis. The table includes an updated set of distances based on a careful search of the literature. For galaxies without a direct distance estimate (e.g., from observations of Cepheid variables), we use their Hubble distance corrected for peculiar motions (Masters 2005) assuming Mpc-1. Optical - and -band photometry for the SINGS sample has been taken either from Muñoz-Mateos et al. (2009a) or Dale et al. (2007), listed in order of preference. The photometry in Muñoz-Mateos et al. (2009a) for galaxies is based on a careful curve-of-growth analysis and recalibration of imaging available in the literature (Prugniel & Heraudeau 1998; Dale et al. 2007). They provide asymptotic (integrated) - and -band magnitudes for of these objects, and integrated magnitudes from the SDSS (York et al. 2000) for the other galaxies. The SDSS magnitudes were transformed to - and -band magnitudes using the statistical linear transformations derived by Blanton & Roweis (2007) based on a large sample of SDSS galaxies. The absolute -band magnitudes, , and colors in Table Optical Spectroscopy and Nebular Oxygen Abundances of the Spitzer/SINGS Galaxies have been corrected for foreground Galactic reddening (Schlegel et al. 1998) and converted to the Vega system using the AB-to-Vega conversions in Blanton & Roweis (2007). We adopt a minimum photometric error of and in and , respectively.
One of the strengths of the SINGS sample is that it was designed to span a broad range of galaxy properties. We illustrate this point in Figure 1 where we plot versus of the full sample, divided into three bins of morphological type. For comparison, we show the corresponding color-magnitude diagram for a flux-limited () sample of SDSS galaxies at selected from the NYU Value-Added Galaxy Catalog333http://sdss.physics.nyu.edu/vagc (NYU-VAGC; Blanton et al. 2005) and the SDSS Data Release 7 (DR7; Abazajian et al. 2009). The rest-frame luminosities of the SDSS galaxies were estimated using k-correct (v. 4.1.4; Blanton & Roweis 2007).444http://howdy.physics.nyu.edu/index.php/Kcorrect Among bright () galaxies, the two samples span a comparable range of luminosity and color, whereas the SINGS sample includes a significant number of faint blue galaxies.
2.2. Nuclear, Circumnuclear, and Radial-Strip Spectroscopy
2.2.1 Observations & Reductions
The overall strategy guiding our optical observing program was to complement the mid- and far-infrared spectra of the SINGS sample obtained as part of the principal Spitzer observations (Kennicutt et al. 2003a; Smith et al. 2007; Dale et al. 2009). Briefly, the infrared observations produce low-resolution () µm spectral cubes of the central of each galaxy, and µm spectral cubes of the inner at higher resolution, , using the IRS spectrograph (Houck et al. 2004).555The center of NGC 3034=M 82 was a reserved target; therefore, it was not mapped by SINGS with the IRS instrument, although we did obtain optical spectra of its center (see Appendix A). In addition, there are µm radial strip IRS spectra at enclosing a wide rectangular aperture that extend over of the optical diameter of each galaxy, and complementary low-resolution () µm radial strip spectra of approximately the same region using the MIPS instrument in SED mode (Rieke et al. 2004).
The optical spectra were obtained between November and May at the Bok 2.3-meter telescope on Kitt Peak for galaxies in the northern hemisphere, and at the CTIO 1.5-meter telescope for galaxies in the southern hemisphere. At the Bok telescope we used the B&C spectrograph and a mm-1 grating, blazed at Å, to obtain spectral coverage from Å at Å FWHM () resolution through a slit. The CTIO observations were obtained using the R-C spectrograph and a mm-1 grating (#9), blazed at Å, which provided spectral coverage from Å at Å FWHM () resolution through a slit.
We used the long-slit drift-scanning technique pioneered by Kennicutt (1992a) to obtain integrated optical spectra over the same physical area targeted by the IRS and MIPS observations. Drift-scanning consists of driving a long-slit back-and-forth perpendicular to the slit during a single exposure in order to build a luminosity-weighted integrated spectrum of a large spatially extended area at the spectral resolution of a narrow slit (Kennicutt 1992a; Jansen et al. 2000; Gavazzi et al. 2004; Moustakas & Kennicutt 2006a). For each object we obtained a circumnuclear spectrum targeting the central regions of each galaxy, and a large rectangular radial-strip spectrum spatially coincident with the IRS and MIPS observations (see below). We also obtained a pointed (spatially fixed) spectrum centered on the nucleus of each object. The total exposure time for the radial strip, circumnuclear, and nuclear spectra ranged from , , and minutes, respectively, usually split into two or more exposures to allow cosmic rays to be identified.
The data reduction steps consisted of overscan- and bias-subtraction, flat-fielding, a correction for the varying illumination pattern, and sky subtraction (see Moustakas & Kennicutt 2006a for details). We combined multiple exposures using inverse variance weighting while iteratively rejecting cosmic rays. The galaxies in SINGS with the largest projected angular diameters usually required multiple pointings to achieve full spatial coverage of the corresponding infrared spectra, or to ensure that the sky was adequately sampled. For these objects we obtained overlapping spectra, which we subsequently stitched together by examining the spatial profiles in the overlap region. Flux-calibration was facilitated by observations of standard stars selected from the HST/CALSPEC666http://www.stsci.edu/hst/observatory/cdbs/calspec.html (Bohlin et al. 2001) and Massey et al. (1988) star lists. We estimate that our relative spectrophotometric accuracy is across the full spectral range (see also Moustakas & Kennicutt 2006a).
We extracted one-dimensional spectra using a (or for the CTIO spectra) and aperture for each nuclear and circumnuclear spectrum, respectively. The radial strip spectra were extracted over a arcsec2 rectangular region, where is the major-axis diameter of each galaxy (see Table Optical Spectroscopy and Nebular Oxygen Abundances of the Spitzer/SINGS Galaxies) and (in some cases ) is the drift-scan length perpendicular to the slit. The position angle and drift-scan length of each radial-strip spectrum was chosen to maximize the spatial overlap with the corresponding IRS spectra having at least double coverage in both spectral orders (see Appendix A and Smith et al. 2004 for more details). Finally, all the spectra were corrected for foreground Galactic reddening (O’Donnell 1994; Schlegel et al. 1998) assuming (see Table Optical Spectroscopy and Nebular Oxygen Abundances of the Spitzer/SINGS Galaxies).
Table 2 summarizes our observations; we present the data themselves in Appendix A. We obtained at least one optical spectrum for galaxies, or of the SINGS sample. Three of the ten objects without any spectra— NGC 5408, IC 4710, and NGC 7552— are in the southern hemisphere and were not accessible during the 2001 December CTIO observing run. The remaining seven galaxies lacking an optical spectrum— Ho II, M 81 Dw A, Ho I, Ho IX, DDO 154, DDO 165, and NGC 6822— are faint, low surface-brightness dwarfs for which we were unable to obtain usable data. In total, we obtained nuclear, circumnuclear, and radial-strip spectra for , , and of the SINGS galaxies, respectively.
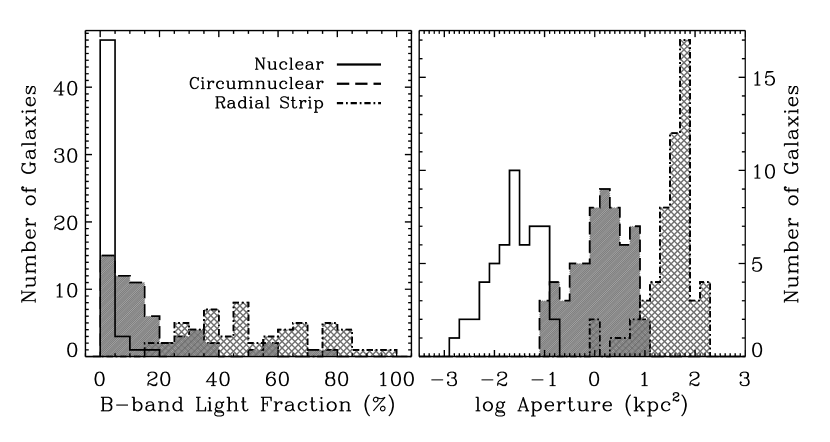
In Figure 2 we characterize the range of spatial scales spanned by our observations by plotting the distribution of -band light fraction and the physical area (in kpc2) subtended by our nuclear, circumnuclear, and radial-strip spectra. The light fractions were measured from the -band images of the SINGS galaxies by projecting the rectangular apertures listed in Table 2 and computing the fraction of light within each aperture relative to the integrated flux (Dale et al. 2007). Our circumnuclear spectra enclose of the integrated optical light, with a typical (median) value of , while our radial-strip spectra enclose of the integrated light, with a median value of . Therefore, our circumnuclear and radial-strip spectra should be representative of the central and integrated (globally averaged) optical properties, respectively, of most of the galaxies in the sample (Kewley et al. 2005).
2.2.2 Optical Emission-Line Measurements
With the latest generation of high-resolution stellar population synthesis models it has become possible to separate accurately the stellar continuum spectrum of a galaxy from its integrated emission-line spectrum, so that the emission-line strengths can be studied free from the systematic effects of Balmer and metal-line absorption (e.g., Brinchmann et al. 2004; Cid Fernandes et al. 2005; Moustakas & Kennicutt 2006a; Asari et al. 2007).
We fit each spectrum using the Bruzual & Charlot (2003, hereafter BC03) stellar population synthesis models assuming the Chabrier (2003) initial mass function between and . We model the data as a non-negative linear combination of ten BC03 models with ages ranging between Myr and Gyr and three different metallicities: , , . We derive the best-fitting model, separately for each stellar metallicity, using a modified version of the pPXF777http://www-astro.physics.ox.ac.uk/mxc/idl continuum-fitting code (Cappellari & Emsellem 2004). First, we isolate the Å spectral range to derive the absorption-line redshift of the galaxy, , and an estimate of the velocity dispersion, , deconvolved for the instrumental resolution of our spectra and the BC03 models. Next, we model the full spectral range, fixing and at the derived values and aggressively mask pixels that may be affected by emission lines, sky-subtraction residuals, or telluric absorption. We treat reddening as a free parameter assuming the Calzetti et al. (2000) dust attenuation law. Finally, we choose the stellar metallicity that results in the best fit (i.e., lowest reduced ).
We emphasize that our principal objective in modeling the underlying stellar continuum is to obtain a pure emission-line spectrum that has been corrected self-consistently for stellar absorption, not to constrain star-formation history and stellar metallicity within each spectroscopic aperture. Star-formation history, age, metallicity, and dust reddening are notoriously degenerate, which means that the multidimensional parameter space is a very complex manifold that likely contains numerous local minima. Our simple minimization algorithm is ill-suited for solving this kind of problem, although more general methods for inferring these quantities from integrated optical spectra have been developed (e.g., Panter et al. 2003; Gallazzi et al. 2005; Ocvirk et al. 2006; Cid Fernandes et al. 2007; Tojeiro et al. 2007; Blanton & Roweis 2007). For our purposes, we have verified that varying our model assumptions does not significantly impact the measured emission-line strengths. Specifically, we checked that fixing the stellar metallicity of the models to solar, adopting a different extinction law (e.g., O’Donnell 1994; Charlot & Fall 2000; Gordon et al. 2003), assuming a different initial mass function (Salpeter 1955), or changing the number of model ages yields emission-line strengths that are within the statistical uncertainties for most objects.
Given the best-fitting stellar continuum, we subtract it from the data to obtain a pure emission-line spectrum corrected for stellar absorption. Next, we remove any remaining residuals (typically of order a few percent) due to imperfect sky-subtraction or template mismatch using a -pixel sliding median. Finally, we model the strong optical emission lines — [O ii] , H, H, [O iii] , [N ii] , H, and [S ii] — as individual Gaussian line-profiles using a modified version of the gandalf888http://www.strw.leidenuniv.nl/sauron emission-line fitting code (Sarzi et al. 2006; Schawinski et al. 2007), constraining the and doublet ratios to be 3:1 (Osterbrock & Ferland 2006). We perform the emission-line fitting in two iterations. First, we tie the redshifts and intrinsic velocity widths (deconvolved for the instrumental resolution) of the forbidden and Balmer lines together to aid in the detection and deblending of weak lines (Tremonti et al. 2004). On the second iteration we relax most of the constraints on the line-profiles and use the best-fitting parameters from the first iteration as initial guesses. This second step is necessary for two reasons: first, our knowledge of the wavelength-dependent instrumental resolution is imperfect, which the code can compensate for by allowing the velocity widths of the emission lines to vary with wavelength; and second [O ii] is, in fact, a doublet which is better represented at the spectral resolution of our data as a single, slightly broader Gaussian line than two closely-spaced Gaussian line-profiles. Note that even on the second iteration, however, we (separately) constrain the redshifts and velocity widths of the [O iii], [N ii], and [S ii] doublets to have the same values.
For a handful of AGN in our sample we had to include a second, broad component for the H, H, and H Balmer lines in order to obtain a satisfactory fit to the observed line-profiles. Specifically, our nuclear spectra of the following objects required both broad and narrow Balmer lines: NGC 1566, NGC 3031, NGC 4579, NGC 4594, and NGC 5033. The emission-line contribution from the broad-line region obviously depends on the enclosed light-fraction of the spectrum. Therefore, for our circumnuclear spectrum of NGC 4594 we did not need to include broad Balmer lines. Finally, among our radial-strip spectra the only galaxy that required broad Balmer emission lines was NGC 1566.
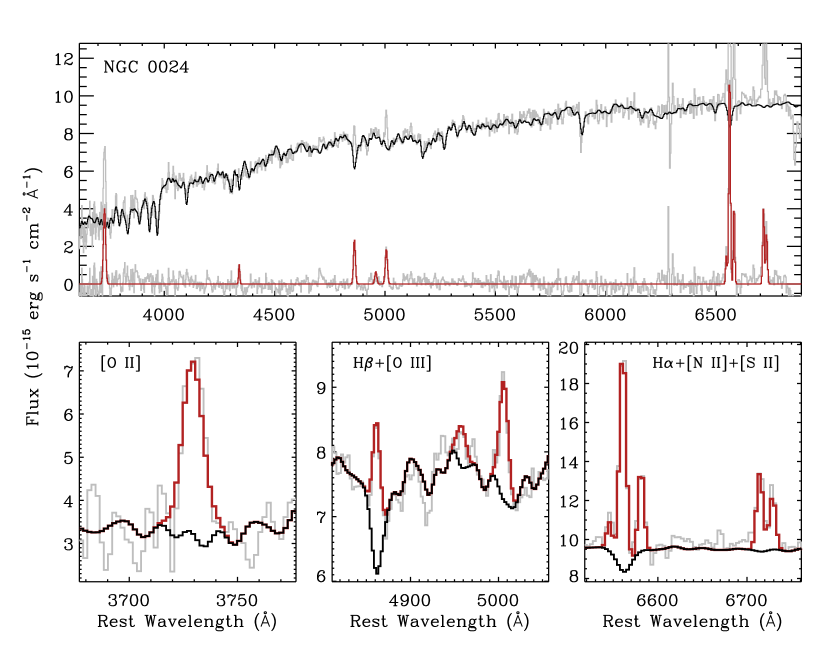
Figure 3 shows an example of our stellar continuum and emission-line fitting technique applied to the circumnuclear spectrum of NGC 0024, which is typical in terms of S/N. Our best-fitting absorption- and emission-model for the central region of NGC 0024 is clearly a good representation of the data, and this result is typical (see Appendix A). In the lower-middle panel of Figure 3 we focus on the wavelengths around H and the [O iii] doublet to highlight the amount of stellar absorption affecting the H emission line. In this example the amount of H absorption is Å, a considerable fraction of the absorption-corrected emission-line equivalent width, Å, which emphasizes the importance of subtracting the underlying stellar continuum when studying the integrated emission lines of galaxies. For reference, the mean H stellar absorption for the full sample is Å, slightly larger than the amount of absorption found by previous studies (McCall et al. 1985; Kobulnicky & Phillips 2003), presumably because of the lower instrumental resolution of our spectra.
Tables 3 and 4 list the fluxes and rest-frame equivalent widths (EWs) of the emission lines with significant detections measured from our nuclear, circumnuclear, and radial-strip spectra. We construct the EW of each line by dividing the integrated flux in each line by the mean surrounding continuum (Moustakas & Kennicutt 2006a). For the broad-line AGN identified above these tables only give the flux and EW of the narrow-line component of the Balmer lines. For the detection of a line to be considered significant we require the amplitude of the best-fitting Gaussian model to be above the residual (continuum-subtracted) spectrum, where is the standard deviation of the residual spectrum near the line. We further recommend that for most applications a minimum signal-to-noise (S/N) ratio cut be applied to the fluxes and EWs given in Tables 3 and 4.
2.3. Ancillary H II-Region Spectroscopy
We supplement our integrated and nuclear optical spectra with previously published optical line-ratios of H ii regions in of the SINGS galaxies (see Appendix B). These data are complementary in several respects. First, as discussed in §2.2.1, we were unable to obtain an integrated optical spectrum of most of the faint, low-surface brightness dwarfs in SINGS, which are among the most metal-poor galaxies in the sample (Kennicutt et al. 2003a; Walter et al. 2007). Fortunately, previously published optical spectroscopy of least one H ii region in most of these objects exists, enabling us to estimate their gas-phase oxygen abundances self-consistently with respect to the rest of the sample (see §4.3). Second, unlike an integrated optical spectrum of a galaxy, the spectrum of an individual H ii region typically exhibits a much simpler underlying stellar continuum, mitigating continuum-subtraction errors and enabling faint lines to be detected and measured. In addition, each integrated spectrum is a surface-brightness weighted average of all the H ii-regions contained within the spectroscopic aperture, and likely includes contributions from diffuse- and shock-ionized gas emission (Kennicutt 1992b; Lehnert & Heckman 1994; Dopita et al. 2006b), although we do not expect these effects to be a significant source of bias in our abundance estimates (Kobulnicky et al. 1999; Pilyugin et al. 2004a; Moustakas & Kennicutt 2006b). Finally, the emission-line spectrum of an H ii-region is impervious to AGN contamination, which can be a significant source of systematic error when deriving oxygen abundances from the strong nebular lines (see §3). On the other hand, our database of H ii-region line-ratios constitutes an heterogeneous compilation of data from the literature. Although we have made every effort to select only high-fidelity observations, the data are not of uniform quality for all galaxies, a point that should be kept in mind in the subsequent analysis. Appendix B contains details regarding how the emission-line database was built and tabulates the properties of each H ii region used in the subsequent analysis.
3. Optical Spectral Classifications
Neglecting the AGN contribution to the optical emission-line spectrum of a galaxy can lead to catastrophic errors in the derived oxygen abundances, particularly those that rely on the [O iii]/H ratio (Kewley & Ellison 2008). Therefore, we classify the SINGS galaxies into three broad categories: AGN, star-forming (SF) galaxies, and composite systems, or SF/AGN, as defined below; further separating the AGN into Seyferts (Seyfert 1943) and LINERs (Heckman 1980; Kewley et al. 2006; Ho 2008) is beyond the scope of this paper. A detailed investigation of the nuclear properties of the SINGS galaxies using both optical and infrared diagnostic diagrams has also been performed by Dale et al. (2006).
Clearly, the degree to which the observed emission-line spectrum is ‘contaminated’ by an AGN depends both on the level of AGN activity, and on the area (e.g., in kpc2) subtended by the spectroscopic aperture. For example, a galaxy with an AGN-like nuclear spectrum may have a circumnuclear or radial strip spectrum that is dominated by the integrated emission from star-forming regions in the disk. In these objects, we can use the circumnuclear and radial-strip spectra to obtain a reliable estimate of the oxygen abundance, but not the nuclear spectrum. Consequently, we classify each object in SINGS using all three of our nuclear, circumnuclear, and radial strip spectra, where available.
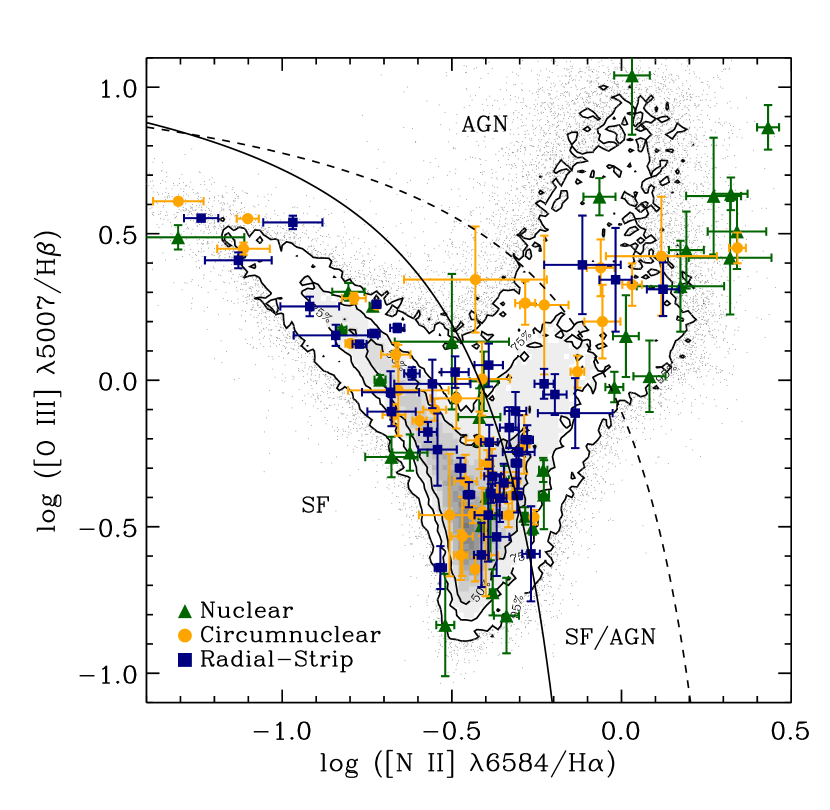
In Figure 4 we plot the [N ii] /H versus [O iii] /H emission-line diagnostic diagram (Baldwin et al. 1981; Veilleux & Osterbrock 1987), which has been shown to be a sensitive diagnostic of AGN activity (Kewley et al. 2000, 2001b; Kauffmann et al. 2003; Stasińska et al. 2006). We plot line-ratios measured from our nuclear, circumnuclear, and radial strip spectra as green triangles, orange points, and blue squares, respectively. In order to be included in this diagram all four emission lines must have (see §2.2.2). The contoured greyscale shows for comparison the distribution of SDSS emission-line galaxies in this diagram.999The emission-line measurements for the SDSS sample described in §2.1 were taken from the publically available MPA/JHU database (http://www.mpa-garching.mpg.de/SDSS/DR7). We use the Kewley et al. (2001a) and Kauffmann et al. (2003) classification curves to separate the SINGS galaxies into SF, AGN, and SF/AGN: we classify galaxies above and to the right of the Kewley et al. curve as AGN; galaxies below and to the left of the Kauffmann et al. curve as SF; and objects between the two curves as SF/AGN.
For some objects either H or [O iii] were not detected; however, we can still use the [N ii]/H ratio to discriminate between star-forming galaxies and AGN because the star-forming galaxy sequence asymptotes to a roughly constant [N ii]/H ratio as the [O iii]/H ratio diminishes (see Fig. 4; Kauffmann et al. 2003). Examining Figure 4, for these objects we adopt as the boundary between AGN and star-forming galaxies.
Table 5 summarizes the results of classifying the SINGS galaxies using our optical spectra. A question mark in any of these columns indicates that we failed to detect one or more of the requisite emission lines. As a consistency check we also classified our sample using the nuclear emission-line fluxes published by Ho et al. (1997), which are available for nearly half () the SINGS sample. We find that our nuclear classifications generally agree very well with the classifications derived using the Ho et al. (1997) line-ratios.
For many applications it is useful to have a single spectral class for each galaxy, which we provide in the last column of Table 5. This final classification was generally adopted from our nuclear spectrum; therefore, the final classification tends to favor AGN. However, we emphasize that for many objects the AGN contributes negligibly to the central or integrated spectrum of the galaxy, as traced by our circumnuclear and radial-strip spectra, respectively.
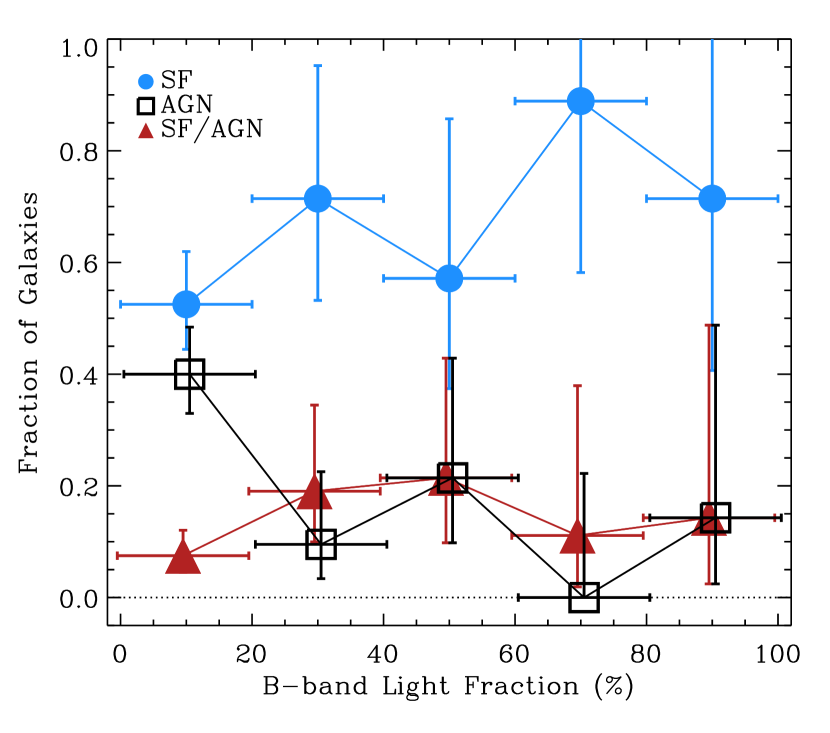
We illustrate this last point explicitly in Figure 5, where we plot the proportion of galaxies classified as SF, AGN, and SF/AGN as a function of the -band light fraction (see §2.2.1). We find the anticipated trend that the fraction of galaxies classified as SF increases with enclosed light fraction at the expense of the proportion of objects classified as AGN, while the fraction of galaxies classified as SF/AGN remains roughly constant at . However, we note that these results are sensitive to incompleteness in our spectral classifications (e.g., due to undetected emission lines), and to sample selection effects (e.g., SINGS intentionally excluded powerful AGN; Kennicutt et al. 2003a). These various effects should be considered carefully depending on the specific application of the derived optical classifications.
4. Oxygen Abundance Analysis
Our objective in this section is to derive the gas-phase metallicities of all SINGS galaxies. There are two broad issues to consider. First, given an optical spectrum, the observed emission-line ratios must be converted into an estimate of the gas-phase metallicity, a procedure that is subject to both random and systematic uncertainties. Second, for each galaxy we often have multiple oxygen abundance estimates sampling a wide range of spatial scales; these various measurements must be combined in a sensible way to ensure a consistent set of metallicities for the full sample.
We address the first question in §4.1, where we discuss the general methodology of deriving the gas-phase metallicity of a star-forming galaxy or H ii region from its observed emission-line spectrum. As numerous studies have pointed out (Kewley & Ellison 2008, and references therein), there exist large ( dex) systematic discrepancies among existing empirical and theoretical methods of estimating oxygen abundances. Consequently, the absolute uncertainty in the nebular abundance scale is a factor of . To explore this issue, we therefore compute oxygen abundances using two different methods. In §4.2 and §4.3 we apply these two methods to derive oxygen abundances from our nuclear, circumnuclear, and radial-strip spectra, and from our ancillary H ii- region spectroscopy, respectively. We combine all the available abundance measurements for each galaxy in §4.4 based on the estimated fraction of the integrated optical light enclosed by each spectroscopic aperture, resulting in an estimate of the central and characteristic, or globally-averaged metallicity of each galaxy.
4.1. Strong-Line Abundance Calibration
The most direct, physically motivated method of deriving the oxygen abundance of an H ii region or star-forming galaxy is to measure the electron temperature () of the ionized gas using the intensity (relative to a hydrogen recombination line) of one or more temperature-sensitive auroral line such as [O iii] , [N ii] , [S iii] , and [O ii] (Dinerstein 1990; Skillman 1998; Garnett 2002a; Stasińska 2007). This technique is frequently referred to as the direct, or , method of deriving abundances. Unfortunately, the requisite lines are intrinsically faint, particularly in metal-rich galaxies and star-forming regions, and in general are not detected in our spectra. Therefore, we must rely on a so-called strong-line abundance calibration to estimate the metallicity of the ionized gas. Strong-line abundance calibrations essentially relate the oxygen abundance to one or more line-ratios involving the strongest recombination and collisionally excited (forbidden) lines (e.g., [O ii] , H, H, [O iii] , [N ii] , and [S ii] ). Although strong-line methods are indirect and often model-dependent, they are important because they can be used to infer the physical conditions in star-forming galaxies across a significant fraction of cosmic time (Kennicutt 1998; Pettini 2006; De Lucia 2009); moreover, the direct method is not without its own limitations, as we discuss in §5.
Over the last three decades numerous strong-line calibrations have been developed, but in general they fall into one of three categories: semi-empirical, empirical, and theoretical. The older, semi-empirical calibrations were generally tied to electron temperature abundance measurements at low metallicity and photoionization models at high metallicity (e.g., Alloin et al. 1979; Pagel et al. 1979; Edmunds & Pagel 1984; McCall et al. 1985; Dopita & Evans 1986; Skillman 1989). These hybrid calibrations were born from the observational difficulty of measuring the electron temperature of metal-rich H ii regions, which remains challenging even with -meter class telescopes (e.g., Castellanos et al. 2002; Kennicutt et al. 2003b; Garnett et al. 2004b; Bresolin et al. 2004, 2005, but see Kinkel & Rosa 1994 for a heroic early effort). By contrast, the more recent empirical methods are calibrated against high-quality observations of individual H ii regions with measured direct (i.e., -based) oxygen abundances (Pilyugin 2000, 2001; Denicoló et al. 2002; Pettini & Pagel 2004; Pilyugin & Thuan 2005; Pérez-Montero & Díaz 2005; Nagao et al. 2006; Stasińska 2006; Yin et al. 2007; Peimbert et al. 2007).101010Strictly speaking, the ‘empirical’ calibrations presented by Pettini & Pagel (2004) and Denicoló et al. (2002) do include a handful of metal-rich H ii regions whose abundances were derived using photoionization models. One of the limitations of the empirical calibrations, especially in the metal-rich regime, is that they are based on observations of relatively small samples of high-excitation H ii regions, whereas most integrated spectra of galaxies exhibit softer ionizing radiation fields (see §5). Finally, the class of theoretical abundance calibrations are based on ab initio photoionization model calculations, in which various nebular emission-line ratios are tracked as a function of the input metallicity and ionization parameter (McGaugh 1991; Dopita et al. 2000, 2006a; Charlot & Longhetti 2001; Kewley & Dopita 2002).111111Confusingly, some of these theoretical calibrations are occasionally refered to as ‘semi-empirical’ calibrations (e.g., Kennicutt & Garnett 1996; Croxall et al. 2009).
Among published strong-line calibrations there exist large, poorly understood systematic discrepancies, in the sense that empirical calibrations generally yield oxygen abundances that are factors of lower than abundances derived using theoretical calibrations (Kennicutt et al. 2003b; Garnett et al. 2004b; Bresolin et al. 2004, 2005; Shi et al. 2006; Nagao et al. 2006; Liang et al. 2006; Yin et al. 2007; Kewley & Ellison 2008). Unfortunately, the physical origin of this systematic discrepancy remains unresolved. Therefore, we have chosen to compute the oxygen abundances of the SINGS galaxies using two different strong-line calibrations: the theoretical calibration published by Kobulnicky & Kewley (2004, hereafter KK04), and the empirical Pilyugin & Thuan (2005, hereafter PT05) calibration. Our goal is not to conduct a detailed intercomparison of all the available calibrations (see, e.g., Kewley & Ellison 2008), but instead to bracket the range of oxygen abundances one would derive using existing strong-line calibrations. We discuss the various strengths and limitations of the abundances derived using these two calibrations in §5.
The KK04 and PT05 calibrations we have chosen both rely on the metallicity-sensitive parameter (Pagel et al. 1979):
| (1) |
The principal advantage of as an oxygen abundance diagnostic is that it is directly proportional to both principal ionization states of oxygen, unlike other diagnostics that have a second-order dependence on the abundance of other elements like nitrogen and sulfur. Moreover, because depends on blue rest-wavelength lines, it can be used to study the chemical history of star-forming galaxies over a significant fraction of cosmic time (Pettini et al. 2001; Kobulnicky et al. 2003; Kobulnicky & Kewley 2004; Savaglio et al. 2005; Maiolino et al. 2008; J. Moustakas et al., in prep.). The disadvantages of are that it is sensitive to AGN contamination, and it must be corrected for stellar absorption and dust attenuation (but see Kobulnicky & Phillips 2003; J. Moustakas et al., in prep.). An additional complication is that the relation between and metallicity is famously double-valued (see, e.g., Fig. 6). Metal-rich objects lie on the upper branch, while metal-poor galaxies and H ii regions lie on the lower branch; the transition between the upper and lower branches is called the turn-around region. The non-monotonic relation between and O/H arises because in metal-rich star-forming regions decreases with increasing O/H as the far-IR fine-structure lines (predominantly [O iii] µm and [O iii] µm) increasingly dominate the nebular cooling. At low metallicity, on the other hand, the optical transitions dominate the nebular cooling, and so decreases in tandem with decreasing metallicity because its strength is directly proportional to the abundance of oxygen atoms.
For the KK04 calibration, we have
| (2) | |||||
and
| (3) | |||||
for galaxies on the lower and upper branch, respectively, where . The ionization parameter in is given by
| (4) | |||||
where , , and
| (5) |
characterizes the hardness of the ionizing radiation field (Kewley & Dopita 2002). Hereafter we will use the dimensionless ionization parameter where is the speed-of-light (Kewley & Dopita 2002).121212The ionization parameter also can be written as , where is the electron density, is the volume filling factor, and is the rate of photoionizing photons injected into the gas by massive stars (Shields 1990). Note that equations (2)-(4) must be solved iteratively for both the ionization parameter and the oxygen abundance; convergence is typically achieved in a handful of iterations.
For the PT05 calibration, we have
| (6) | |||||
and
| (7) | |||||
for the lower and upper branch, respectively, where
| (8) |
is an excitation parameter (Pilyugin 2001) that is analogous to equation (4) for the KK04 calibration.
The KK04 calibration is an updated parameterization of the Kewley & Dopita (2002) calibration, which is based on the state-of-the-art photoionization model calculations carried out by Dopita et al. (2000) and Kewley et al. (2001a).131313Note that we do not use the calibration explicitly recommended by Kobulnicky & Kewley (2004), which they obtain by averaging equations (2) and (3) with the corresponding equations from McGaugh (1991). Although the differences between these two particular calibrations are not large ( dex), we generally advocate using one calibration derived from the same set of observations or theoretical models. The PT05 calibration, by comparison, is based on an extensive compilation of H ii-regions from the literature with well-determined electron temperatures, and is a significant improvement over the original calibrations presented in Pilyugin (2000, 2001). Note, however, that due to a paucity of electron temperature measurements for low-excitation regions, the PT05 calibration is only strictly applicable to star-forming regions with (see §5).
We selected these two particular calibrations for several reasons. First, as indicated above, they bracket the range of oxygen abundances one would derive using other strong-line calibrations, thereby serving as useful limiting cases. Second, they are relatively recent, and therefore they utilize the best available observations, atomic data, and theoretical stellar atmospheres. Third, they are both two-parameter calibrations which account for variations in excitation at fixed metallicity (McGaugh 1991; Pilyugin 2000, 2001). Finally, they provide separate calibrations for objects on the lower and upper branches, and therefore can be applied to a sample such as SINGS which spans a wide range of luminosity and gas-phase metallicity. We refer the interested reader to Pérez-Montero & Díaz (2005), Liang et al. (2006), and Kewley & Ellison (2008) for a detailed intercomparison of these and other popular strong-line calibrations.
4.2. Nuclear, Circumnuclear, and Radial-Strip Abundances
In this section we derive oxygen abundances for the SINGS galaxies from our nuclear, circumnuclear, and radial-strip spectra. In order for a spectrum to be included for chemical abundance analysis we require H, H, [O ii] , and [O iii] to be measured with a minimum (see §2.2.2). We also remove spectra dominated by the central AGN, but retain those classified as SF/AGN (see §3 and Table 5). A total of galaxies () satisfy these criteria, of which () have at least two optical spectra.
Following standard practice we correct the emission-line fluxes for dust reddening using the observed Balmer decrement, assuming an intrinsic case B recombination value of , where the uncertainty reflects the variation in with electron temperature (Storey & Hummer 1995; Osterbrock & Ferland 2006). Assuming a foreground dust screen and the O’Donnell (1994) Milky Way extinction curve, the reddening is given by (Calzetti 2001; Moustakas et al. 2006). Table 6 lists the observed H/H ratios and corresponding values inferred from our nuclear, circumnuclear, and radial-strip spectra. In some cases the measured H/H ratio was less than, but statistically consistent with, the adopted intrinsic ratio (within ). For these spectra we set equal to zero and propagate the statistical uncertainty in H/H into the reddening error.
Next, we use the reddening-corrected line-fluxes and equations (1), (5), and (8) to derive , , and , respectively. Before computing oxygen abundances, however, every galaxy must be assigned to either the lower or upper branch of the KK04 and PT05 calibration (see §4.1). Following Contini et al. (2002), we assign galaxies to the lower branch if and , while we identify upper-branch objects as having and (see also Kewley & Ellison 2008). In some cases these criteria are either inconclusive or cannot be applied because of a poorly measured [N ii] line, in which case we use the optical luminosity to choose the most likely branch (see §4.4).
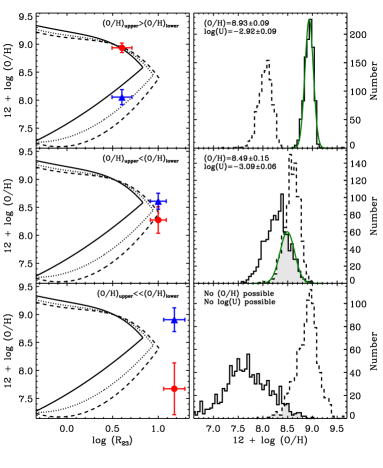
Because the -O/H relation is double-valued, special care is required when computing the oxygen abundances of objects near the turn-around region, where the upper and lower branches intercept. In particular, objects that are statistically consistent with being on either the upper branch or the lower branch must have correspondingly large abundance errors. In addition, measurement uncertainties or residual AGN contamination occasionally result in an parameter that is larger than , the approximate theoretical limit for photoionization by massive stars (Kewley & Dopita 2002). Although these objects formally lie “off” the calibration, rather than rejecting them outright, which is typically what has been done in the literature, it is better to assess whether they are statistically consistent with being on the calibration under consideration. In Figure 6 we illustrate the quantitative procedure we have developed to compute -based oxygen abundances that addresses all these issues. Here, we focus on the KK04 calibration, but the same procedure applies to the PT05 calibration and, indeed, to any -based abundance calibration.
In the left panels of Figure 6 we plot versus for three hypothetical galaxies. The curves show the KK04 calibration for three representative values of the ionization parameter, (solid), dex (dotted), and dex (dashed). In each panel the filled red point corresponds to the oxygen abundance on the upper branch, while the filled blue triangle corresponds to the lower-branch solution (for the same object). In the top-left panel the upper- and lower-branch solutions are distinct and well-separated: once the appropriate branch has been chosen (e.g., using the criteria described above), the corresponding metallicity follows. The top-right panel shows the resulting Monte Carlo distribution of values corresponding to the solution on the upper (solid histogram) and lower branch (dashed histogram), assuming Gaussian errors on the [O ii], [O iii], and H line-fluxes after trials. Assuming that this object belongs on the upper branch, the uncertainty on is given by the width of the solid histogram; a Gaussian profile (green curve) of the appropriate width has been overplotted to guide the eye. The identical procedure leads to the uncertainty on the ionization parameter, .
The middle panels in Figure 6 illustrate a more ambiguous, albeit frequently encountered situation. In this case the formal solution on the lower branch is larger than the solution on the upper branch (note that the blue triangle is now above the red circle). In the middle-right panel the overlapping, shaded region corresponds to values of and that lie on the KK04 calibration, that is, where . If the central values of the two distributions are within of one another, as measured by the width of the shaded histogram (green Gaussian profile), we adopt the average of the two solutions as the oxygen abundance, and the width of the shaded histogram as the uncertainty. We further characterize the branch as ambiguous. In practice, these types of objects all have KK04 abundances equal to the abundance around the turn-around region, dex; however, they also have large abundance errors, which reflects the branch ambiguity.
Finally, the bottom panels in Figure 6 illustrate a situation in which no oxygen abundance measurement is possible using the KK04 calibration. Here, the upper- and lower-branch solutions are statistically inconsistent with one another, given the measurement uncertainties; therefore no solution exists, and these objects must be rejected.
Applying the above procedure to the star-forming galaxies in our sample we derive branches, ionization and excitation parameters, and gas-phase oxygen abundances, as well as robust uncertainties, using both the KK04 and PT05 calibrations. For reference, we are able to estimate oxygen abundances using the KK04 calibration for all the star-forming SINGS galaxies, and for all but one object (the circumnuclear spectrum of NGC 5474) using the PT05 calibration. We list the results in Table 7 and discuss them in §4.4.
4.3. H II-Region Abundances
In the previous section we derived oxygen abundances using our new nuclear and integrated optical spectra. Here, we analyze the abundances of the SINGS galaxies using our H ii-region database (see §2.3). In §4.3.1 we use these data to constrain the form of the radial abundance gradient in of the SINGS galaxies, and in §4.3.2 we compute the average oxygen abundances of all galaxies with observations of at least one H ii region.
4.3.1 Radial Gradients
Building on L. H. Aller’s pioneering study of H ii regions in M 33 (Aller 1942), Searle (1971) was the first to suggest that disk galaxies might possess radial abundance gradients. Subsequent work confirmed his interpretation that the gas-phase metallicity of disk galaxies, including the Milky Way, decreases from the center outward (e.g., Webster & Smith 1983; Shaver et al. 1983; Garnett & Shields 1987; Vila-Costas & Edmunds 1992; Zaritsky et al. 1994; Kennicutt & Garnett 1996; Garnett et al. 1997; van Zee et al. 1998; Dutil & Roy 1999; Pilyugin et al. 2004b; Rosolowsky & Simon 2008; Rosales-Ortega 2009). Abundance gradient measurements are important because they provide crucial constraints on the (time-dependent) inside-out gas accretion and star-formation histories of galactic disks (e.g., Molla et al. 1996; Boissier & Prantzos 1999; Prantzos & Boissier 2000; Carigi et al. 2005; Colavitti et al. 2009; Marcon-Uchida et al. 2010).
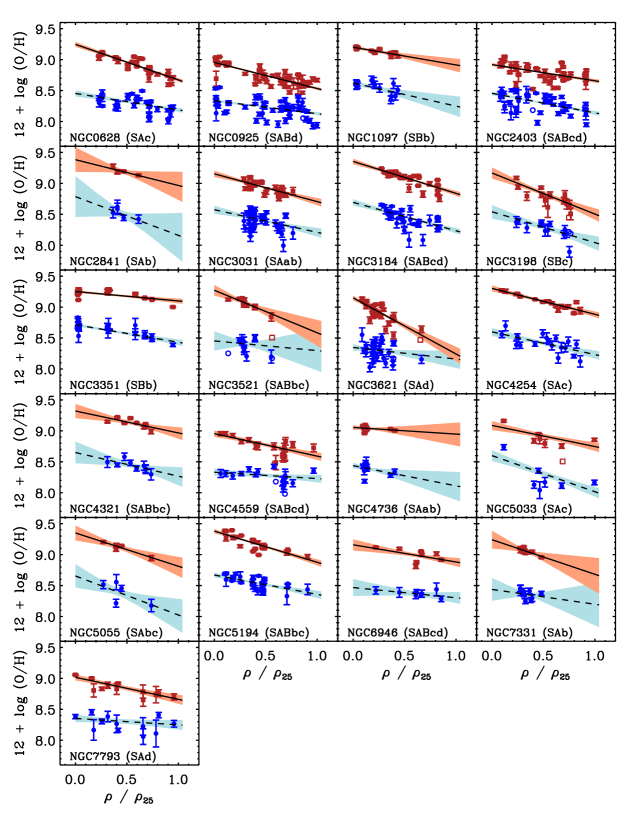
An accurate measurement of the abundance gradient of a galaxy requires observations of a minimum number of H ii regions spanning a large enough fraction of the disk to constrain the slope (Zaritsky et al. 1994; Dutil & Roy 2001; Bresolin et al. 2009). Among the SINGS galaxies, there are disk galaxies with published spectroscopy for five or more H ii regions spanning at least of the disk radius, (see Table Optical Spectroscopy and Nebular Oxygen Abundances of the Spitzer/SINGS Galaxies). In Figure 7 we plot oxygen abundance versus normalized deprojected galactocentric radius, , for all the star-forming regions in these objects. We derive oxygen abundances using both the KK04 (filled dark red squares) and PT05 (filled dark blue points) abundance calibrations assuming the branches listed in Table Optical Spectroscopy and Nebular Oxygen Abundances of the Spitzer/SINGS Galaxies. We plot H ii regions with an ambiguous branch, according to the criteria defined in §4.2, using open symbols without error bars; these regions are not used when fitting the abundance gradient. Finally, we add dex in quadrature to the statistical abundance uncertainty of each H ii region to ensure that the fit is not dominated by a small number of objects with the smallest statistical errors. We model the radial gradient in each galaxy, separately for the KK04 and PT05 abundance calibration, using a weighted linear least-squares fit, and plot the results using solid and dashed lines in Figure 7, respectively. The light-red and light-blue shaded regions reflect the range of linear gradients that are consistent with the observations, accounting for the covariance matrix of the best-fitting parameters. We tabulate the derived abundance gradients and uncertainties in Table Optical Spectroscopy and Nebular Oxygen Abundances of the Spitzer/SINGS Galaxies, and discuss the results below and in §4.4.
Figure 7 illustrates the well-known observation that disk galaxies exhibit a wide range of abundance gradient slopes. Using the KK04 calibration, the radial gradients in these objects range from dex in the late-type disk galaxy NGC 3621, to dex in the SAab galaxy NGC 4736, with a mean slope of dex . Using the PT05 calibration the abundance gradients are generally shallower, as we discuss below; the average slope is dex , ranging from dex in NGC 5055, to dex in the barred galaxy NGC 4559. These gradients imply a factor of decrease in the oxygen abundances of galaxies from the center to the optical edge of the disk using the KK04 calibration, or a factor of using the PT05 calibration. Using the KK04-based abundances we find a weak correlation between abundance gradient slope and Hubble type in the sense that early-type disk galaxies tend to exhibit shallower abundance gradients, confirming previous studies that also relied on theoretical strong-line calibrations (e.g., Oey & Kennicutt 1993; Zaritsky et al. 1994; Garnett et al. 1997). By contrast, the PT05-based abundance gradients are independent of Hubble type (see also Pilyugin et al. 2004b). There is also no statistically significant correlation between -luminosity and slope using either calibration, although a noisy, but significant correlation appears if the slope is expressed in physical units, i.e., dex kpc-1, owing to the tendency for luminous disk galaxies to be larger (Garnett et al. 1997; Blanton & Moustakas 2009). Finally, previous studies have suggested that barred galaxies exhibit shallower abundance gradients (e.g., Vila-Costas & Edmunds 1992; Dutil & Roy 1999), presumably due to enhanced mixing via bar-driven radial inflows of gas (Kormendy & Kennicutt 2004, and references therein); unfortunately, there are too few galaxies in our sample to test this hypothesis.
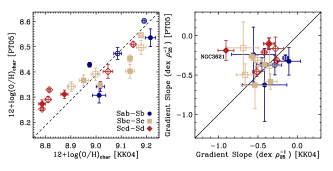
Perhaps the most striking result in Figure 7 is the considerable systematic offset between the two abundance scales: the oxygen abundances derived using the theoretical KK04 calibration are, on average, a factor of higher than those based on the empirical PT05 calibration. We quantify this result in Figure 8 (left), where we compare the characteristic abundances of these galaxies derived using each calibration. The characteristic abundance is defined as the oxygen abundance at (Zaritsky et al. 1994; Garnett 2002b), which has been shown by Moustakas & Kennicutt (2006b) to be statistically consistent with the luminosity-weighted mean metallicity of the whole galaxy based on integrated spectroscopy (see also Kobulnicky et al. 1999; Pilyugin et al. 2004a; Rosales-Ortega 2009). Open and filled symbols in this figure differentiate between barred and unbarred galaxies, respectively, and the symbols types correspond to different morphological classes: Sab-Sb (blue points); Sbc-Sc (pink squares); and Scd-Sd (tan diamonds). The characteristic abundances of these galaxies based on the KK04 calibration are dex higher than the corresponding metallicities derived using the PT05 calibration (dashed line). The residuals are also a weak function of metallicity: below , the PT05 characteristic abundances are offset by dex from the KK04 abundances, while at higher metallicity the offset is slightly larger, dex.
Returning to Figure 7, we find that despite the significant zeropoint offset in the two abundance scales, to first order the slope of the abundance gradients in these galaxies are correlated (see also Moustakas & Kennicutt 2006b and Rosales-Ortega 2009). We quantify this result in Figure 8 (right), where we find a well-defined, albeit noisy correlation between the abundance gradient slopes derived using the PT05 and KK04 calibrations. The most significant outlier from the one-to-one relation (solid line) is NGC 3621: according to the KK04 calibration the abundance gradient slope is dex , considerably steeper than the slope derived using the PT05 calibration, dex . We emphasize that the steep slope derived for NGC 3621 using the KK04 calibration is not being driven by either of the H ii regions at (S3A1 and S3A2; see Appendix B); we obtain a slope that is within the statistical error whether or not these regions are included in the fit.
To second order, however, the abundance gradients derived using the KK04 calibration are systematically steeper. Excluding the three galaxies with the least well-determined abundance gradients (NGC 2841, NGC 3521, and NGC 7331; see Table Optical Spectroscopy and Nebular Oxygen Abundances of the Spitzer/SINGS Galaxies and Fig. 7), the weighted mean difference in slope is dex . Bresolin et al. (2009) report a similar result for NGC 0300; they find that various theoretical strong-line abundance diagnostics yield steeper abundance gradients than the gradient inferred from electron-temperature abundance estimates. Indeed, for NGC 5194 the abundance gradient slope we derive using the empirical PT05 calibration, dex , is statistically consistent with the slope derived by Bresolin et al. (2004), dex , using a sample of H ii regions with high-quality electron temperature measurements; by comparison, the theoretical KK04 calibration yields a slope that is steeper, dex . In the context of galactic chemical evolution models (e.g., Prantzos & Boissier 2000; Marcon-Uchida et al. 2010), the slope of the abundance gradient in a disk galaxy places tight constraints on its radially and time-dependent gas-accretion and star-formation history, making it important to determine whether the steeper or shallower gradients predicted by the KK04 or PT05 calibration, respectively, are more correct. On the other hand, the abundance differences at due to the slightly different gradients are typically dex, negligible compared to the zeroth-order systematic difference in the two abundance scales, dex. Nevertheless, these results emphasize the need for a resolution to the nebular abundance scale discrepancy (see §5).
The final point we raise regarding Figure 7 is the amount and possible physical origin of the dispersion in metallicity at fixed galactocentric radius. Relative to the KK04-based abundance gradients, the dispersion ranges from dex, with a mean value of dex. The scatter around the best-fitting PT05-based abundance gradients is dex, or dex, on average. It is interesting to determine why the dispersion in metallicity when using the PT05 calibration is larger than when adopting the KK04 calibration. Correlating the abundance residuals against various properties of the H ii regions, we find that the larger dispersion is being driven primarly by low-excitation () H ii regions. As emphasized in §4.1, the paucity of low-excitation H ii regions with electron temperature abundance measurements means that the PT05 calibration is not well-constrained in this regime (see also the discussion in §5); therefore, PT05-based abundances of low-excitation H ii regions may be susceptible to additional systematic errors (i.e., due to extrapolation). Consequently, in the subsequent discussion we focus exclusively on the dispersion around the KK04-based abundance gradients.
The dispersion we measure is comparable to or smaller than the scatter reported by previous studies, dex (e.g., McCall et al. 1985; Zaritsky et al. 1994; van Zee et al. 1998). One reason we measure a smaller dispersion in metallicity at fixed galactocentric radius compared to these older studies, even though we are using data compiled from the very same surveys, is because the KK04 calibration accounts for variations in metallicity and ionization for a given emission-line spectrum. Neglecting the tendency for metal-poor (i.e., outer) H ii regions to have harder ionizing radiation fields would introduce additional scatter due to the variation in physical conditions among different H ii regions. Kennicutt & Garnett (1996) speculate that in M101 the dispersion is metallicity may be due to large-scale deviations from azimuthal symmetry in the gas disk, perhaps due to tidal interactions with its nearby companions. One way to test this hypothesis is to build two-dimensional abundance maps of statistically significant samples of nearby galaxies, which has become possible recently with the latest generation of integral-field-unit spectrographs (e.g., Rosales-Ortega et al. 2010; Blanc et al. 2010).
4.3.2 Average H II-Region Oxygen Abundances
In this section we consider all SINGS galaxies with observations of one or more H ii regions (see Appendix B), including the objects studied in §4.3.1, and compute the average H ii-region metallicity of each galaxy assuming the branches listed in Table Optical Spectroscopy and Nebular Oxygen Abundances of the Spitzer/SINGS Galaxies. Specifically, we compute the average metallicity as the unweighted mean of all the individual H ii-region abundances in each object. To ensure a reliable estimate we exclude H ii regions with an ambiguous branch assignment (see §4.2), as well as regions beyond the optical diameter of the galaxy (i.e., those with ). Estimating the uncertainty in the average metallicity is not straightforward because galaxies exhibit genuine abundance inhomogeneities, although the amplitude of these variations are expected to be relatively small in dwarf galaxies (e.g., van Zee et al. 2006). Consequently, we compute the error in the average metallicity as the unweighted standard deviation of the distribution of oxygen abundances, but require the resulting uncertainty to be greater than or equal to the mean statistical uncertainty of the individual measurements. This method ensures that we do not underestimate the metallicity error in galaxies with only a handful of H ii regions. We list the final average abundances and uncertainties for all galaxies in Table Optical Spectroscopy and Nebular Oxygen Abundances of the Spitzer/SINGS Galaxies.
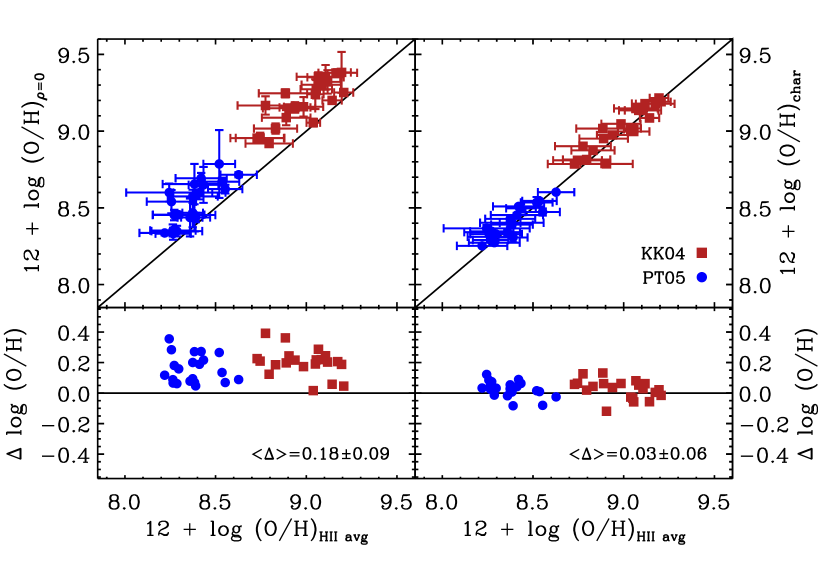
In Figure 9 we compare the average abundances we derive against the (left) central () and (right) characteristic () oxygen abundances for the SINGS galaxies with measured radial gradients (§4.3.1). The dark red squares and blue points correspond to the KK04 and PT05 abundance calibration, respectively, and the solid line is the line-of-equality. The upper panels compare the abundances directly and include error bars, while the lower panels plot the residuals without error bars, for clarity. The mean and standard deviation of the residuals are given in the lower panels. We find that the central oxygen abundances in these galaxies are dex, or a factor of higher than the average metallicity, while the characteristic and average oxygen abundances agree to within ) with no statistically significant systematic offset, independent of the adopted abundance calibration. This result indicates that, to first order, the average H ii-region metallicity is a reliable surrogate for the characteristic abundance in galaxies where we are unable to constrain the form of the radial abundance gradient.
4.4. Synthesis: Central and Characteristic Oxygen Abundances of the SINGS Galaxies
In the previous two sections we derived several different estimates of the gas-phase oxygen abundances for each SINGS galaxy spanning a wide range of spatial scales (see Tables 7 and Optical Spectroscopy and Nebular Oxygen Abundances of the Spitzer/SINGS Galaxies). For most applications, however, a single, characteristic oxygen abundance that is representative of the whole galaxy may be desired; in other applications, a nuclear or central metallicity may be needed. The goal of this section, therefore, is to combine all the various abundance measurements to derive a uniform set of characteristic (i.e., globally averaged) and central oxygen abundances for the full sample.
We begin our analysis with Figure 10 by plotting all the oxygen abundances listed in Tables 7 and Optical Spectroscopy and Nebular Oxygen Abundances of the Spitzer/SINGS Galaxies versus . We plot abundances determined from our nuclear, circumnuclear, and radial-strip spectra using dark blue crosses, magenta triangles, and orange diamonds, respectively. We derive an approximate value for each spectrum by computing the mean radius of the spectroscopic aperture, , where and is the diameter of the extraction aperture along and perpendicular to the slit, respectively (see Table 2). Our results are not sensitive to the details of this calculation, as our goal is simply to distinguish between, for example, a nuclear spectrum that encloses a small fraction of the light of the galaxy (e.g., for NGC 1482) and a radial-strip spectrum that extends over a much larger area relative to the size of the galaxy (e.g., for NGC 1705). We plot the characteristic () and central () abundances determined from our radial metallicity gradients (see §4.3.1) as green squares and light blue stars, respectively. Finally, we plot the average H ii-region abundances derived in §4.3.2 as dark red points at . Note that we only plot the average H ii-region abundances of objects without measured radial gradients so that the same H ii regions are not counted twice.
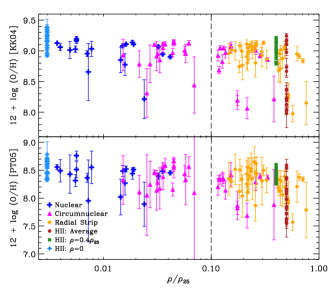
Next, we divide Figure 10 into central and characteristic metallicity regimes at (vertical dashed line). For each galaxy, we define the central abundance as the weighted average of all the available abundances at ; similarly, we define the characteristic metallicity of each galaxy as the weighted average of all the abundances at . Although this division is somewhat arbitrary, once again our goal is to ensure that we are not averaging metallicities originating from widely disparate parts of the galaxy. Note that by using the weighted average we tend to favor metallicities derived from the H ii regions, which typically have smaller uncertainties than the metallicities derived from our nuclear and integrated spectra. Occasionally the average central metallicity is formally lower than the characteristic metallicity, although the difference is never statistically significant (i.e., never ). In other cases, either the central or characteristic metallicity carries a considerably larger uncertainty because it is based on a single abundance estimate. For these objects we adopt the weighted average of all the available metallicities at as indicative of both the central and characteristic abundance. We list the final set of oxygen abundances, using both the KK04 and PT05 abundance calibrations, in Table 9.
Summarizing, Table 9 contains central and characteristic abundances for galaxies, or of the SINGS sample. The characteristic abundances range from based on the KK04 calibration, or using the PT05 calibration. Among the objects with no metallicity estimate, () are early-type, bulge-dominated galaxies lacking prominent emission lines in their integrated spectrum (e.g., NGC 0584, NGC 5866), or their optical emission-line spectrum is dominated by the central AGN (e.g., NGC 1266, NGC 4579). Unfortunately, H ii regions either are not present in these galaxies, or have not been observed. The remaining four objects are late-type galaxies (e.g., NGC 3938), including three dwarfs (M 81 Dw A, NGC 4236, and IC 4710), for which we were unable to obtain a useful optical spectrum (see §2.2.1), and for which no H ii regions have been observed in these objects based on our search of the literature (see Appendix B).
In an effort to make our compilation of oxygen abundances for the SINGS galaxies as comprehensive as possible, we derive an approximate metallicity for the remaining galaxies using the -band luminosity-metallicity () relation. The statistical correlation between optical luminosity (or stellar mass) and gas-phase metallicity has been known for several decades (e.g., Lee et al. 2006a, and references therein), and provides a useful tool for deriving a rough estimate of the metallicities of the SINGS galaxies without spectroscopic abundances. We emphasize that the metallicities we derive using the relation may be susceptible to additional systematic biases. In particular, the bulk of the objects without spectroscopic abundances are early-type galaxies which may not obey the same underlying relation defined by late-type galaxies. In fact, early-type disk galaxies exhibit shallower radial abundance gradients and higher overall metallicities than late-type galaxies (§4.3.1; Garnett & Shields 1987; Oey & Kennicutt 1993; Zaritsky et al. 1994; Dutil & Roy 1999), although the latter correlation is likely driven by the fact that early-type galaxies tend to be more luminous, and therefore more metal rich. On the other hand, we derive the -band relation using all the galaxies in SINGS with spectroscopic abundances, including a number of early-type disk galaxies, which should mitigate some of these systematic effects.
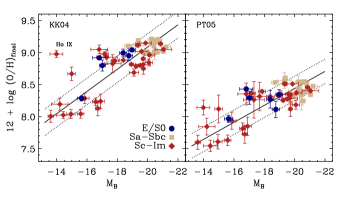
With these caveats in mind, in Figure 11 we plot the -band relation for the SINGS galaxies using the (left) KK04 and (right) PT05 abundance calibrations and the characteristic oxygen abundances listed in Table 9. The symbols correspond to three broad bins of morphological type: E-Sa (dark blue points), Sab-Sbc (tan squares), and Sc-Im (dark red diamonds). Ho IX, a metal-rich tidal-dwarf galaxy (Makarova et al. 2002; Croxall et al. 2009), deviates significantly from the KK04-based luminosity-metallicity relation, and has been labeled in this figure. The solid lines show the linear ordinary least-squares bisector fits to each set of abundances (Isobe et al. 1990), while the dotted lines in each panel indicate the residual scatter in either relation, dex. Using these relations we estimate the oxygen abundances of all the SINGS galaxies and list the results in Table 9.
The relations we obtain are:
| (9) |
and
| (10) |
using the KK04 and PT05 abundance calibration, respectively. Comparing these results with previously determined -band relations is difficult because the slope and intercept are sensitive to sample selection effects (e.g., the distribution of absolute magnitudes) and, obviously, the adopted abundance calibration. For example, Tremonti et al. (2004) obtained a steeper relation, based on a large sample of SDSS galaxies with and a theoretical abundance calibration. By comparison, Lee et al. (2006a) studied a sample of nearby galaxies with and oxygen abundances derived using the direct method and obtained . Other studies have obtained relation slopes ranging from dex mag-1 to dex mag-1 (Skillman et al. 1989; Hidalgo-Gamez & Olofsson 1998; Lee et al. 2004; Lamareille et al. 2004; Salzer et al. 2005; van Zee & Haynes 2006; J. Moustakas et al., in prep.). Given the impact of the assumed abundance calibration and sample selection effects we conclude that equations (9) and (10) are both reasonable descriptions of the -band relation for the SINGS galaxies.
5. Discussion of the Nebular Abundance Scale
The factor of absolute uncertainty in the nebular abundance scale poses one of the most important outstanding problems in observational astrophysics. In this paper we have sidestepped this issue by computing the gas-phase metallicities of the SINGS galaxies using two independent strong-line calibrations: PT05, which was empirically calibrated against electron-temperature abundance measurements of individual H ii regions; and KK04, a purely theoretical calibration based on a large grid of state-of-the-art photoionization model calculations (see §4.1). We have seen that the KK04 calibration yields abundances that are dex higher than metallicities derived using the PT05 calibration, based on the same input emission-line ratios. The question we explore in this section is: “Which set of oxygen abundances should one use?”
As discussed in §4.1, the absolute uncertainty in the nebular abundance scale is largely due to the systematic difference between abundances computed using empirical versus theoretical calibrations (see, e.g., Fig. 2 in Kewley & Ellison 2008). Therefore, we begin our discussion by exploring the various strengths and limitations of the empirical and theoretical strong-line methods (see Stasińska 2010 for a complementary discussion). Our principal conclusion is that the empirical calibrations likely underestimate the ‘true’ metallicity by dex, while the theoretical calibrations yield abundances that may be too high by the same amount; a compromise procedure, therefore, would be to average the two abundance estimates presented in §4.4 and Table 9. We conclude with a brief discussion of other strong-line abundance calibrations.
One indirect argument in favor of empirical abundance calibrations is that they generally yield abundances for (i.e., typical) galaxies that are more consistent with the oxygen abundance of the Sun, (Asplund et al. 2009). For example, luminous, metal-rich galaxies on the empirical abundance scale have , or , while the metallicities of the same galaxies using the theoretical strong-line calibrations are dex, or (Fig. 11; Tremonti et al. 2004; Salzer et al. 2005; Pilyugin et al. 2007; Kewley & Ellison 2008). Consequently, on the empirical abundance scale galaxies like the Milky Way have roughly solar metallicity, whereas theoretical abundance methods suggest that the overwhelming majority of star-forming galaxies in the local universe are more metal-rich than the Sun (see, e.g., Fig. 4 in Tremonti et al. 2004).141414Note, however, that the metallicities derived from the SDSS diameter fiber spectra may be too high by dex due to aperture bias (Tremonti et al. 2004; Kewley et al. 2005). Application of the Copernican principal suggests that the theoretical abundance scale is likely too high given the currently accepted solar oxygen abundance (but see Serenelli et al. 2009).
Another powerful way to test the absolute zeropoint in the nebular abundance scale is to compare the gas-phase oxygen abundances of H ii regions in the Milky way and other nearby galaxies against the stellar abundances of young O-, B-, and A-type stars in the same galaxies. Bresolin et al. (2009) performed this experiment by obtaining high-quality electron temperature measurements of H ii regions in the nearby late-type galaxy NGC 0300. They compared the inferred gas-phase abundance gradient with the stellar gradient derived from observations of blue supergiants in the same galaxy (Urbaneja et al. 2005; Kudritzki et al. 2008) and found excellent statistical agreement. Pilyugin et al. (2006) reported a similar result for the Milky Way; they applied an empirical strong-line method (Pilyugin 2005) to observations of Galactic H ii regions and found excellent agreement with the stellar oxygen abundance gradient from Daflon & Cunha (2004) over a similar range of Galactocentric radii. By comparison, three widely-used theoretical strong-line calibrations (McGaugh 1991; Kewley & Dopita 2002; Tremonti et al. 2004) applied to the H ii regions in NGC 0300 yielded abundance gradients that were offset from the stellar gradient toward higher metallicity by dex (Bresolin et al. 2009).
Despite these successes, direct and empirical abundance methods may systematically underestimate the oxygen abundances of star-forming regions, especially in the metal-rich regime. For example, using the direct method Esteban et al. (2004) measured the oxygen abundance of the Orion nebula to be . However, this metallicity is dex lower than the oxygen abundances of B-type stars in the solar neighborhood and in the Orion nebula (i.e., young stars within kpc; Cunha et al. 2006; Przybilla et al. 2008; Simón-Díaz 2010). One way to (partially) resolve this discrepancy would be if oxygen atoms are depleted by dex onto dust grains (Jenkins 2004; Cartledge et al. 2006), although presumably this correction would affect the abundances derived from the theoretical methods in the same way. Alternatively, if H ii regions exhibit significant spatial temperature fluctuations then the abundances derived from collisionally excited lines such [O iii] could be biased low.
Peimbert (1967) was the first to point out that temperature inhomogeneities in H ii regions could cause the electron temperature inferred from the collisionally excited forbidden lines to be overestimated, and therefore the abundance to be underestimated (Stasińska 2005; Bresolin 2006). He defined a quantity, , equal to the root-mean-square deviation of the temperature from the mean value. Temperature inhomogenieties are expected to be more severe in metal-rich H ii regions because the higher efficiency of metal-line cooling leads to strong temperature gradients as a function of distance from the ionizing star or star cluster (Garnett 1992; Stasińska 2002, 2005). Typically, direct abundances, and the empirical methods that are calibrated against them, assume . Unfortunately, deriving is very challenging observationally; it has been measured in a relatively small number of metal-rich [] Galactic and extragalactic H ii regions (García-Rojas & Esteban 2007; Esteban et al. 2009, and references therein). Using the intensity of the faint, temperature-insensitive metal recombination lines, the He I recombination line spectrum, and the electron temperature implied by the Balmer discontinuity, these studies suggest for metal-rich H ii regions, corresponding to an upward revision of the abundances derived from empirical methods of dex (the so-called abundance discrepancy factor; García-Rojas & Esteban 2007; Esteban et al. 2009). Indeed, applying a correction for to the oxygen abundance of Orion implied by the direct method, Esteban et al. (2004) obtain , in much better agreement with the mean abundance of B-type stars in the same star-forming region, (Simón-Díaz 2010), assuming that dex of oxygen atoms are locked in dust grains.
These observations suggest that it might be possible to develop an empirical strong-line calibration using abundances measured from metal recombination lines, which are not susceptible to temperature fluctuations (Peimbert & Peimbert 2005; Peimbert et al. 2007; Bresolin 2007). Peimbert et al. (2007) derive such a calibration for using a small number () of metal-rich, high-excitation emission-line galaxies and H ii regions. For a given value of , this calibration yields oxygen abundances that are dex, or a factor of higher than the abundances implied by the direct and empirical methods assuming . However, this calibration should be used with caution because it has been tested on a relatively small, biased (metal-rich, high-excitation) sample of Galactic and extragalactic H ii regions. In addition, recent theoretical work suggests that abundances derived from recombination lines may not be as unbiased as once believed (Stasińska et al. 2007; Ercolano et al. 2007; Ercolano 2009). Additional observations of the Balmer discontinuities and O II recombination-line intensities of H ii regions spanning a wider range of metallicity and physical conditions would be of considerable value.
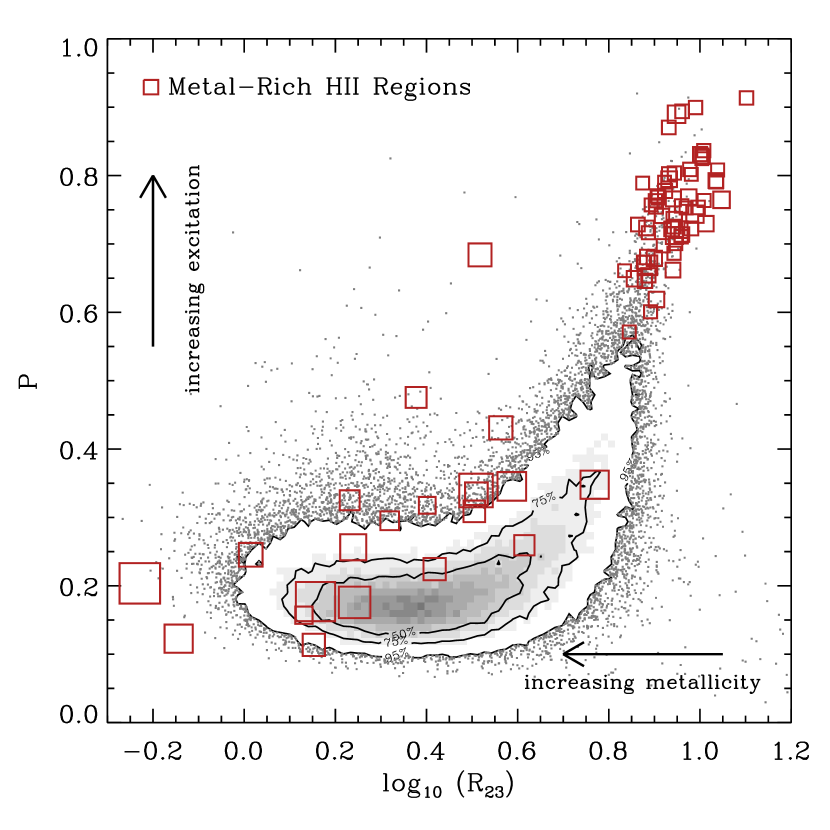
As alluded to above, one of the principal limitations of the empirical strong-line abundance methods is that they are only strictly applicable to H ii regions and star-forming galaxies spanning the same range of excitation and metallicity as the H ii regions that were used to build the calibration. To illustrate this point, in Figure 12 we plot the (reddening-corrected) parameter versus excitation, , for star-forming galaxies in the SDSS and a representative sample of metal-rich H ii regions with well-measured electron temperatures (red squares; Garnett et al. 1997; van Zee et al. 1998; Kennicutt et al. 2003b; Kniazev et al. 2004; Bresolin et al. 2004, 2005; Izotov & Thuan 2004; Izotov et al. 2006; Rosolowsky & Simon 2008). The symbol size for each H ii region is proportional to its oxygen abundance in the range assuming . Because all these objects are on the upper branch, increases in tandem with nebular excitation, while a decrease in corresponds to an increase in metallicity, as indicated by the arrows in Figure 12. This figure demonstrates that star-forming galaxies in the SDSS are lower-excitation and more metal-rich than the bulk of the H ii regions with direct abundance estimates.151515As indicated in the previous footnote, at least some of the tendency for the SDSS galaxies to appear metal-rich and low-excitation may be due to aperture bias. Note that a similar conclusion would be reached if EW(H) had been used as a measure of excitation (see, e.g., Fig. 5 in Bresolin 2007): the median EW(H) value of the SDSS galaxies is Å, nearly a factor of smaller than the median EW(H) of the H ii regions, Å. The practical implication of this result is that empirical abundance calibrations such as PT05 should not in general be applied to large emission-line galaxy surveys such as the SDSS because the calibrations would be extrapolated to a part of physical parameter space that is not well-constrained by current observations.
Meanwhile, theoretical strong-line abundance calibrations have the advantage that they are based on models that, by construction, span a wide range of ionization parameter (), metallicity (), and stellar effective temperature (McGaugh 1991; Dopita et al. 2000; Charlot & Longhetti 2001; Kewley et al. 2001a; Moy et al. 2001; Dopita et al. 2006a; Martín-Manjón et al. 2010; Levesque et al. 2010). In these methods the UV (i.e., photoionizing) spectral energy distribution of a young star cluster is coupled to a photoionization code such as cloudy (Ferland et al. 1998) or mappings (Sutherland & Dopita 1993) and the output emission-line spectrum is studied as a function of input parameters. In recent years there have been significant improvements in the evolutionary tracks for young stars, including the effects of mass loss and rotation (Vázquez & Leitherer 2005), the calculation of non-LTE, line-blanketed stellar atmospheres (Simón-Díaz & Stasińska 2008), and the inclusion of dust grains in the photoionization models (Shields & Kennicutt 1995; Groves et al. 2004). Despite these improvements, however, some problems persist. For example Levesque et al. (2010) find that the latest generation of photoionizing spectra are too soft to reproduce the observed [S ii]/H ratios of nearby star-forming galaxies. Photoionization codes also have difficulty reproducing the observed line-strengths of the auroral lines (Stasińska & Schaerer 1999; Jamet et al. 2005), and predict insignificant temperature fluctuations within H ii regions (Baldwin et al. 1991), in contradiction with the (albeit limited) observations. The theoretical methods also rely on a number of simplifying assumptions regarding the electron density, volume filling factor, and nebular geometry (e.g., spherically symmetric, plane-parallel); the metal-abundance pattern, including the proportion of each metal depleted onto dust grains; the initial mass function, star-formation history (e.g., instantaneous, continuous, stochastic), and age of the central cluster; and chemical evolution effects (e.g., the relationship between primary and secondary nitrogen), among others. In addition to the discrepancies alluded to above, a breakdown in one or more of these assumptions may be responsible for the seemingly “high” oxygen abundances predicted by theoretical strong-line calibrations.
So what are the ways forward? From the observational standpoint, high-quality optical spectrophotometry of larger samples of H ii regions in nearby galaxies is clearly warranted. These observations should span a wide wavelength range in order to include a large number of independent electron temperature and density diagnostics, and should target H ii regions spanning a wide range of metallicity and excitation (e.g., Kennicutt et al. 2003b; Bresolin et al. 2005; Bresolin 2007; Rosolowsky & Simon 2008; Esteban et al. 2009). In particular, a concerted effort to measure the Balmer discontinuities and metal recombination lines in metal-rich H ii regions will elucidate the prevalence and relative importance of temperature-fluctuations, and will help constrain empirical strong-line calibrations in the metal-rich regime. Although these observations are extraordinarily challenging, they are possible with the latest generation of multi-object spectrographs on and meter class telescopes (e.g., Keck/deimos, LBT/mods, VLT/xshooter, etc.). These observations also will help establish the radial and azimuthal dependence of abundances in nearby galaxies; many existing observations are more than twenty-five years old, and for many systems data are available for only a handful of H ii regions (Fig. 7; Pilyugin et al. 2004b). Finally, observations of the mid- and far-infrared metal cooling lines (e.g., [S iii] µm, [O iii] µm, [N iii] µm, [O iii] µm, [N ii] µm), which are insensitive to variations in electron temperature, will be crucial in establishing the abundances of metal-rich H ii regions (Martín-Hernández et al. 2002; Garnett et al. 2004a; Rudolph et al. 2006; Rubin et al. 2008). Spectroscopy from µm with the PACS instrument on-board the Herschel Space Telescope (e.g., from the kingfish project; Poglitsch et al. 2008) will expand significantly the number of star-forming regions observed in the critical far-infrared wavelength regime.
Improvements in the grid-based theoretical strong-line abundance calibrations are also warranted. In particular, a systematic exploration of the input parameters and simplifying assumptions in the models (e.g., Moy et al. 2001; Mathis & Wood 2005; Ercolano et al. 2007, 2010; Levesque et al. 2010) may elucidate the origin of the discrepancy between theoretical and empirical abundances. For example, Yin et al. (2007) show that the difference in the oxygen abundances derived using the direct method and the Charlot & Longhetti (2001) photoionization models (Brinchmann et al. 2004; Tremonti et al. 2004) correlates strongly with the N/O abundance ratio. Because nitrogen is both a primary and secondary nucleosynthetic product, the N/O ratio varies systematically with oxygen abundance, as well as the time since the most recent episode of star formation (Edmunds & Pagel 1978; Contini et al. 2002; Mouhcine & Contini 2002; Pilyugin et al. 2003; Izotov et al. 2006), a complexity that is not reflected in the grid-based theoretical calibrations. Finally, we note that tailored photoionization models of individual H ii regions frequently can be tuned to reproduce most or all the observed emission-line ratios (e.g., Castellanos et al. 2002; Garnett et al. 2004a, but see Jamet et al. 2005). This result again suggests the possibility of an as-yet unidentified shortcoming in the grid-based theoretical calibrations.
Summarizing the preceding discussion, we find that empirical abundance calibrations may underestimate the oxygen abundances of H ii regions and star-forming galaxies because of systematic biases (e.g., temperature fluctuations) in the -based abundances that are used to calibrate the empirical methods. Empirical methods also suffer from a shortage of metal-rich H ii regions with measured electron temperatures, which means that the calibrations are being extrapolated to an unconstrained region of parameter space when applied to large galaxy samples such as the SDSS. On the other hand, indirect evidence suggests that theoretical calibrations yield abundances that are too high, possibly due to one or more simplifying assumptions in the photoionization model grids. Therefore, until these issues are resolved, we recommend that any study utilizing the oxygen abundances provided in Table 9 be carried out either using the relative (KK04 or PT05) abundances of the sample, or using both the KK04 and PT05 abundances separately, to ensure that the conclusions are not affected by the error in the absolute zeropoint of the nebular abundance scale. Alternatively, if a single set of oxygen abundances for the SINGS galaxies is required, a compromise procedure would be to average the KK04 and PT05 metallicities and conservatively adopt the difference in the two metallicity estimates as the metallicity error for each galaxy.
Although we have focused exclusively on the parameter to compute oxygen abundances, over the past three decades many other strong-line calibrations have been developed for estimating the abundances of H ii regions and star-forming galaxies. Among the most popular diagnostics are those based on the [N ii] emission line (e.g., [N ii]/H, [N ii]/[O ii], and [O iii]/[N ii]; Alloin et al. 1979; Storchi-Bergmann et al. 1994; van Zee et al. 1998; Kewley & Dopita 2002; Pettini & Pagel 2004; Liang et al. 2006), although calibrations based on an assortment of other forbidden lines have been proposed (Dopita & Evans 1986; Vilchez & Esteban 1996; Díaz & Pérez-Montero 2000; Pérez-Montero & Díaz 2005; Nagao et al. 2006; Stasińska 2006; Wu et al. 2008; Okada et al. 2008), as well as techniques designed to model all the emission lines simultaneously (Charlot & Longhetti 2001; Brinchmann et al. 2004; Maier et al. 2006). Most [N ii]-based calibrations have the advantage that, unlike , they vary monotonically with metallicity. On the other hand, for most galaxies [N ii] is usually weaker than [O ii], [O iii], and H, and it is more sensitive to contributions from shock-ionized gas and a non-thermal (i.e., AGN) photoionizing continuum.161616A notable exception is the abundance-sensitive [N ii]/[O ii] ratio, which is insensitive to variations in excitation because [N ii] and [O ii] have similar ionization potentials (Bresolin 2007; Kewley & Ellison 2008); on the other hand, [N ii]/[O ii] is sensitive to dust reddening. As discussed above, oxygen abundances inferred from [N ii] also depend implicitly on the recent star formation history of the galaxy, which may introduce non-negligible systematic errors (e.g., Yin et al. 2007). Nevertheless, because [N ii] is observable from the ground to , strong-line calibrations that rely on this line provide an important window into the gas-phase abundances of high-redshift galaxies (Shapley et al. 2004, 2005; Maier et al. 2005; Erb et al. 2006, 2010; Hainline et al. 2009).
One final cautionary note is that both empirical and theoretical strong-line methods have been calibrated against observations of H ii regions and star-forming galaxies in the nearby universe, and may not be applicable at higher redshift where the physical conditions in galaxies may differ dramatically from physical conditions in local galaxies (Shapley et al. 2005; Liu et al. 2008; Brinchmann et al. 2008; Hainline et al. 2009; Lehnert et al. 2009). Testing the validity of locally calibrated abundance diagnostics in higher-redshift galaxies, therefore, will be an important objective of the first generation of highly multiplexed near-infrared spectrographs and, eventually, with the NIRSpec instrument onboard the James Webb Space Telescope, through observations of the full complement of rest-frame optical emission-line diagnostics at high redshift.
6. Summary
We have obtained intermediate-resolution ( Å FWHM), high signal-to-noise ratio ( pixel-1) optical ( Å) spectrophotometry of the SINGS galaxies on three spatial scales to complement and enhance the legacy value of existing mid- and far-infrared observations obtained as part of the Spitzer/SINGS legacy program. Our integrated circumnuclear and radial-strip spectra characterize the central and globally-averaged optical properties of each galaxy, respectively, and are spatially coincident with mid- ( µm) and far-infrared ( µm) spectral cubes from the IRS spectrograph and the MIPS instrument in SED-mode, respectively. A third optical spectrum targeting the nucleus of each galaxy provides a reliable means of identifying galaxies hosting an AGN, among other applications. We make the fully reduced, spectrophotometrically calibrated one-dimensional spectra available to the community. In addition, we use state-of-the art stellar population synthesis models to separate the underlying stellar continuum from the optical emission-line spectrum, and generate tables of the fluxes and equivalent widths of the strongest optical emission lines. Together with existing ancillary multi-wavelength observations of the sample, these data should facilitate a broad range of studies on the physical properties of nearby galaxies.
As a first effort demonstrating the utility of these data, we classify the sample into star-forming (SF), AGN, and SF/AGN on three spatial scales, and carry out a detailed analysis of the gas-phase oxygen abundances of the SINGS sample using our optical spectra and observations of more than H ii regions. Our principal results are:
-
1.
We find that the proportion of galaxies classified as SF and AGN is a strong function of the fraction of the integrated -band light enclosed by the spectroscopic aperture. The fraction of the sample classified as AGN decreases from to as the -band light fraction increases from to , with a corresponding increase in the fraction of galaxies classified as SF. The incidence rate of objects classified as SF/AGN, on the other hand, is roughly independent of enclosed light fraction.
-
2.
Because of significant systematic differences among oxygen abundances computed using different methods, we compute oxygen abundances using both a theoretical (KK04) and an empirical (PT05) strong-line abundance calibration, both based on the popular parameter. We measure a systematic offset of dex between the two nebular abundances, in the sense that the theoretical KK04 calibration yields significantly higher metallicities. These two calibrations were chosen because they bracket the full range of metallicities one would obtain using other popular strong-line abundance calibrations, and because they could be applied to such a diverse sample such as SINGS.
-
3.
We carry out a detailed analysis of the radial abundance gradients in of the SINGS galaxies using both calibrations. We find that the slope of the abundance gradients inferred from these two calibrations are generally correlated; however, to second order the theoretical KK04 calibration results in systematically steeper abundance gradients, which has significant implications for constraining disk-galaxy formation models. In addition, the dispersion in metallicity at fixed galactocentric radius is larger when using the empirical PT05 calibration, presumably because the PT05 calibration is not well-constrained for low-excitation H ii regions.
-
4.
We combine all the available abundance measurements, including abundances inferred from our nuclear, circumnuclear, and radial-strip spectra, H ii regions, and the -band luminosity-metallicity relation, to compute the mean characteristic and central oxygen abundances of whole SINGS sample using both the KK04 and PT05 strong-line calibrations. These abundances should facilitate a wide range of studies between the metal content and infrared emission properties of nearby galaxies.
-
5.
Finally, we discuss some of the possible origins of the systematic differences in nebular abundance computed using direct or empirical versus theoretical strong-line abundance calibrations. We conclude that additional observations of H ii regions spanning a wide range of physical conditions, as well as improvements in the theoretical models, are imperative for resolving this important outstanding problem.
Preliminary values of the oxygen abundances presented in this paper already have been used in several publications by the SINGS team. Smith et al. (2007) and Draine et al. (2007) found a remarkable decrease in the PAH emission-line strengths and the proportion of dust mass locked up in PAH grains below a characteristic oxygen abundance . Calzetti et al. (2007, 2010) investigated the metallicity dependence of the , , , and µm monochromatic luminosities as quantitative SFR diagnostics; they found a strong metallicity dependence for , hampering its suitability for high-redshift studies. Bendo et al. (2008) compared the radial variations in the and ratios against the radial abundance gradients in a subset of the face-on disk galaxies in SINGS and concluded that metallicity was not the dominant parameter driving the observed trends. And finally Muñoz-Mateos et al. (2009a) found that both the total-infrared to far-UV luminosity ratio (i.e., ) and the UV spectral slope (i.e., ) depend significantly on gas-phase oxygen abundance, owing to the tendency for metal-rich, star-forming galaxies to be dustier.
These applications illustrate the broad utility of the measured optical emission-line strengths, spectral classifications, and derived oxygen abundances of the SINGS galaxies, and should facilitate a diversity of future studies into the dust emission and star formation properties of nearby galaxies.
Appendix A Presentation of the Spectra
The SINGS galaxies were selected to span a broad range of morphological types, optical luminosities, and infrared properties, and this diversity is clearly reflected in their optical spectra. Figures A1-A2 present the reduced one-dimensional spectra171717Available electronically at http://sings.stsci.edu and http://ssc.spitzer.caltech.edu/legacy. in erg s-1 cm-2 Å-1 versus rest-frame wavelength in Å. We plot the data in grey and overplot the best-fitting stellar continuum model (see §2.2.2) in black. For each galaxy, we also show an optical Digitized Sky Survey image to illustrate how our spectroscopic apertures compare to the optical extent of the galaxy (dashed purple ellipse; see Table Optical Spectroscopy and Nebular Oxygen Abundances of the Spitzer/SINGS Galaxies). The size of the spectroscopic apertures corresponding to our radial-strip and circumnuclear spectra are shown as a red rectangle and blue square, respectively. The dotted yellow rectangle shows the spatial coverage of the corresponding Spitzer/IRS long-low spectrum obtained as part of SINGS where there was at least double coverage in both spectral orders (Smith et al. 2004, 2007). In some cases there is a mismatch between the orientation angle of the IRS and optical radial-strip spectra. This difference occurs because many of the optical spectra were obtained before the IRS spectra had been observed, or even scheduled. For these objects when we were planning the optical observations we made the best effort to select a position angle for the optical spectrum based on the predicted/constrained position angle of the IRS observations.
Appendix B H II-Region Database
We performed a search of the literature to find published observations of H ii regions in the SINGS sample, resulting in data on star-forming regions in of the sample ( galaxies) drawn from distinct papers published between 1984 and 2009. In order to be included in our catalog, the [O ii] , H, and [O iii] line-strengths must have been measured to enable an estimate of the gas-phase abundance (see §4.3). While this catalog is not exhaustive, it does include all the major spectroscopic surveys of H ii regions in nearby galaxies conducted to date (e.g., McCall et al. 1985; Zaritsky et al. 1994; van Zee et al. 1998). In general, we gave preference to the most recent observations over older data obtained using non-linear detectors, which may be biased (Torres-Peimbert et al. 1989). We also only tabulated data based on traditional spectrophotometry, not narrowband imaging (e.g., Belley & Roy 1992; Dutil & Roy 1999), which may suffer from a variety of systematic errors (Dutil & Roy 2001). Finally, observations of the same H ii region by different authors were retained as independent observations.
For each H ii region we tabulated the fluxes and uncertainties of the strong nebular emission lines, as well as the coordinates of each star-forming region relative to the galactic nucleus. In most cases the published emission-line strengths had been corrected for both underlying stellar absorption and dust reddening. Where necessary, however, we applied a statistical Å correction (McCall et al. 1985) to the Balmer lines and dereddened the line-strengths using the observed H/H Balmer decrement as described in §4.2. In all cases we assumed that was times the intensity of (Osterbrock & Ferland 2006). Finally, the coordinates were used to derive the deprojected galactocentric radius of each H ii-region using the position and inclination angles listed in Table Optical Spectroscopy and Nebular Oxygen Abundances of the Spitzer/SINGS Galaxies.
Table Optical Spectroscopy and Nebular Oxygen Abundances of the Spitzer/SINGS Galaxies provides the derived properties of the H ii regions used, including the H ii region name and reference to the literature, the deprojected galactocentric radius, the , , and parameters (see §4.1), and the oxygen abundances derived using the KK04 and PT05 strong-line calibrations, assuming the branches listed in Table 7. H ii regions whose oxygen abundance could not be derived based on the quantitative criteria described in §4.2, or which had ambiguous branches using either abundance calibration, are identified in the table using footnotes. More detailed information on each H ii region (e.g., relative coordinates, emission-line ratios, etc.) are available from the first author as a binary fits table upon request.
References
- Abazajian et al. (2009) Abazajian, K. N., Adelman-McCarthy, J. K., Agüeros, M. A., Allam, S. S., Allende Prieto, C., An, D., Anderson, K. S. J., Anderson, S. F., et al. 2009, ApJS, 182, 543
- Aller (1942) Aller, L. H. 1942, ApJ, 95, 52
- Alloin et al. (1979) Alloin, D., Collin-Souffrin, S., Joly, M., & Vigroux, L. 1979, A&A, 78, 200
- Asari et al. (2007) Asari, N. V., Cid Fernandes, R., Stasińska, G., Torres-Papaqui, J. P., Mateus, A., Sodré, L., Schoenell, W., & Gomes, J. M. 2007, MNRAS, 381, 263
- Asplund et al. (2009) Asplund, M., Grevesse, N., Sauval, A. J., & Scott, P. 2009, ARA&A, 47, 481
- Baldwin et al. (1991) Baldwin, J. A., Ferland, G. J., Martin, P. G., Corbin, M. R., Cota, S. A., Peterson, B. M., & Slettebak, A. 1991, ApJ, 374, 580
- Baldwin et al. (1981) Baldwin, J. A., Phillips, M. M., & Terlevich, R. 1981, PASP, 93, 5
- Belley & Roy (1992) Belley, J., & Roy, J.-R. 1992, ApJS, 78, 61
- Bendo et al. (2007) Bendo, G. J., Calzetti, D., Engelbracht, C. W., Kennicutt, R. C., Meyer, M. J., Thornley, M. D., Walter, F., Dale, D. A., Li, A., & Murphy, E. J. 2007, MNRAS, 380, 1313
- Bendo et al. (2008) Bendo, G. J., Draine, B. T., Engelbracht, C. W., Helou, G., Thornley, M. D., Bot, C., Buckalew, B. A., Calzetti, D., Dale, D. A., Hollenbach, D. J., Li, A., & Moustakas, J. 2008, MNRAS, 389, 629
- Blanc et al. (2010) Blanc, G. A., Gebhardt, K., Heiderman, A., Evans, II, N. J., Jogee, S., van den Bosch, R., Marinova, I., Weinzirl, T., et al. 2010, astro-ph/1001.5035
- Blanton & Moustakas (2009) Blanton, M. R., & Moustakas, J. 2009, ARA&A, 47, 159
- Blanton & Roweis (2007) Blanton, M. R., & Roweis, S. 2007, AJ, 133, 734
- Blanton et al. (2005) Blanton, M. R., Schlegel, D. J., Strauss, M. A., Brinkmann, J., Finkbeiner, D., Fukugita, M., Gunn, J. E., Hogg, D. W., et al. 2005, AJ, 129, 2562
- Bohlin et al. (2001) Bohlin, R. C., Dickinson, M. E., & Calzetti, D. 2001, AJ, 122, 2118
- Boissier & Prantzos (1999) Boissier, S., & Prantzos, N. 1999, MNRAS, 307, 857
- Boquien et al. (2010) Boquien, M., Bendo, G., Calzetti, D., Dale, D., Engelbracht, C., Kennicutt, R., Lee, J. C., van Zee, L., & Moustakas, J. 2010, ApJ, 713, 626
- Boquien et al. (2009) Boquien, M., Calzetti, D., Kennicutt, R., Dale, D., Engelbracht, C., Gordon, K. D., Hong, S., Lee, J. C., & Portouw, J. 2009, ApJ, 706, 553
- Brandenburg & Skillman (1998) Brandenburg, H. J., & Skillman, E. D. 1998, in Bulletin of the American Astronomical Society, Vol. 30, Bulletin of the American Astronomical Society, 1354–+
- Braun et al. (2007) Braun, R., Oosterloo, T. A., Morganti, R., Klein, U., & Beck, R. 2007, A&A, 461, 455
- Bresolin (2006) Bresolin, F. 2006, astro-ph/0608410
- Bresolin (2007) —. 2007, ApJ, 656, 186
- Bresolin et al. (2004) Bresolin, F., Garnett, D. R., & Kennicutt, R. C. 2004, ApJ, 615, 228
- Bresolin et al. (2009) Bresolin, F., Gieren, W., Kudritzki, R., Pietrzyński, G., Urbaneja, M. A., & Carraro, G. 2009, ApJ, 700, 309
- Bresolin et al. (1999) Bresolin, F., Kennicutt, R. C., & Garnett, D. R. 1999, ApJ, 510, 104
- Bresolin & Kennicutt (2002) Bresolin, F., & Kennicutt, Jr., R. C. 2002, ApJ, 572, 838
- Bresolin et al. (2005) Bresolin, F., Schaerer, D., González Delgado, R. M., & Stasińska, G. 2005, A&A, 441, 981
- Brinchmann et al. (2004) Brinchmann, J., Charlot, S., White, S. D. M., Tremonti, C., Kauffmann, G., Heckman, T., & Brinkmann, J. 2004, MNRAS, 351, 1151
- Brinchmann et al. (2008) Brinchmann, J., Pettini, M., & Charlot, S. 2008, MNRAS, 385, 769
- Bruzual & Charlot (2003) Bruzual, G., & Charlot, S. 2003, MNRAS, 344, 1000
- Calzetti (2001) Calzetti, D. 2001, PASP, 113, 1449
- Calzetti et al. (2000) Calzetti, D., Armus, L., Bohlin, R. C., Kinney, A. L., Koornneef, J., & Storchi-Bergmann, T. 2000, ApJ, 533, 682
- Calzetti et al. (2007) Calzetti, D., Kennicutt, R. C., Engelbracht, C. W., Leitherer, C., Draine, B. T., Kewley, L., Moustakas, J., Sosey, M., et al. 2007, ApJ, 666, 870
- Calzetti et al. (2005) Calzetti, D., Kennicutt, Jr., R. C., Bianchi, L., Thilker, D. A., Dale, D. A., Engelbracht, C. W., Leitherer, C., Meyer, M. J., et al. 2005, ApJ, 633, 871
- Calzetti et al. (2010) Calzetti, D., Wu, S., Hong, S., Kennicutt, R. C., Lee, J. C., Dale, D. A., Engelbracht, C. W., van Zee, L., et al. 2010, ApJ, 714, 1256
- Cannon et al. (2006a) Cannon, J. M., Smith, J.-D. T., Walter, F., Bendo, G. J., Calzetti, D., Dale, D. A., Draine, B. T., Engelbracht, C. W., et al. 2006a, ApJ, 647, 293
- Cannon et al. (2006b) Cannon, J. M., Walter, F., Armus, L., Bendo, G. J., Calzetti, D., Draine, B. T., Engelbracht, C. W., Helou, G., et al. 2006b, ApJ, 652, 1170
- Cappellari & Emsellem (2004) Cappellari, M., & Emsellem, E. 2004, PASP, 116, 138
- Carigi et al. (2005) Carigi, L., Peimbert, M., Esteban, C., & García-Rojas, J. 2005, ApJ, 623, 213
- Cartledge et al. (2006) Cartledge, S. I. B., Lauroesch, J. T., Meyer, D. M., & Sofia, U. J. 2006, ApJ, 641, 327
- Castellanos et al. (2002) Castellanos, M., Díaz, A. I., & Terlevich, E. 2002, MNRAS, 329, 315
- Chabrier (2003) Chabrier, G. 2003, PASP, 115, 763
- Charlot & Fall (2000) Charlot, S. ., & Fall, S. M. 2000, ApJ, 539, 718
- Charlot & Longhetti (2001) Charlot, S. ., & Longhetti, M. 2001, MNRAS, 323, 887
- Ciardullo et al. (2002) Ciardullo, R., Feldmeier, J. J., Jacoby, G. H., Kuzio de Naray, R., Laychak, M. B., & Durrell, P. R. 2002, ApJ, 577, 31
- Cid Fernandes et al. (2007) Cid Fernandes, R., Asari, N. V., Sodré, L., Stasińska, G., Mateus, A., Torres-Papaqui, J. P., & Schoenell, W. 2007, MNRAS, 375, L16
- Cid Fernandes et al. (2005) Cid Fernandes, R., Mateus, A., Laerte, S. J., Stasinska, G., & Gomes, J. M. 2005, MNRAS, 358, 363
- Colavitti et al. (2009) Colavitti, E., Cescutti, G., Matteucci, F., & Murante, G. 2009, A&A, 496, 429
- Contini et al. (2002) Contini, T., Treyer, M. A., Sullivan, M., & Ellis, R. S. 2002, MNRAS, 330, 75
- Cortese et al. (2008) Cortese, L., Boselli, A., Franzetti, P., Decarli, R., Gavazzi, G., Boissier, S., & Buat, V. 2008, MNRAS, 386, 1157
- Croxall et al. (2009) Croxall, K. V., van Zee, L., Lee, H., Skillman, E. D., Lee, J. C., Côté, S., Kennicutt, R. C., & Miller, B. W. 2009, ApJ, 705, 723
- Cunha et al. (2006) Cunha, K., Hubeny, I., & Lanz, T. 2006, ApJ, 647, L143
- Daflon & Cunha (2004) Daflon, S., & Cunha, K. 2004, ApJ, 617, 1115
- Daigle et al. (2006) Daigle, O., Carignan, C., Amram, P., Hernandez, O., Chemin, L., Balkowski, C., & Kennicutt, R. 2006, MNRAS, 367, 469
- Dale et al. (2005) Dale, D. A., Bendo, G. J., Engelbracht, C. W., Gordon, K. D., Regan, M. W., Armus, L., Cannon, J. M., Calzetti, D., et al. 2005, ApJ, 633, 857
- Dale et al. (2007) Dale, D. A., Gil de Paz, A., Gordon, K. D., Hanson, H. M., Armus, L., Bendo, G. J., Bianchi, L., Block, M., et al. 2007, ApJ, 655, 863
- Dale et al. (2006) Dale, D. A., Smith, J. D. T., Armus, L., Buckalew, B. A., Helou, G., Kennicutt, Jr., R. C., Moustakas, J., et al. 2006, ApJ, 646, 161
- Dale et al. (2009) Dale, D. A., Smith, J. D. T., Schlawin, E. A., Armus, L., Buckalew, B. A., Cohen, S. A., Helou, G., Jarrett, T. H., et al. 2009, ApJ, 693, 1821
- De Lucia (2009) De Lucia, G. 2009, astro-ph/0912.1862
- de Vaucouleurs et al. (1991) de Vaucouleurs, G., de Vaucouleurs, A., Corwin, H. G., Buta, R. J., Paturel, G., & Fouque, P. 1991, Third Reference Catalogue of Bright Galaxies (Volume 1-3, XII, 2069 pp. 7 figs.. Springer-Verlag Berlin Heidelberg New York)
- Denicoló et al. (2002) Denicoló, G., Terlevich, R., & Terlevich, E. 2002, MNRAS, 330, 69
- Díaz & Pérez-Montero (2000) Díaz, A. I., & Pérez-Montero, E. 2000, MNRAS, 312, 130
- Díaz et al. (2007) Díaz, Á. I., Terlevich, E., Castellanos, M., & Hägele, G. F. 2007, MNRAS, 382, 251
- Diaz et al. (1991) Diaz, A. I., Terlevich, E., Vilchez, J. M., Pagel, B. E. J., & Edmunds, M. G. 1991, MNRAS, 253, 245
- Dicaire et al. (2008) Dicaire, I., Carignan, C., Amram, P., Hernandez, O., Chemin, L., Daigle, O., de Denus-Baillargeon, M.-M., Balkowski, C., Boselli, A., Fathi, K., & Kennicutt, R. C. 2008, MNRAS, 385, 553
- Dinerstein (1990) Dinerstein, H. L. 1990, in Astrophysics and Space Science Library, Vol. 161, The Interstellar Medium in Galaxies, ed. H. A. Thronson Jr. & J. M. Shull, 257–285
- Dopita & Evans (1986) Dopita, M. A., & Evans, I. N. 1986, ApJ, 307, 431
- Dopita et al. (2006a) Dopita, M. A., Fischera, J., Sutherland, R. S., Kewley, L. J., Leitherer, C., Tuffs, R. J., Popescu, C. C., van Breugel, W., & Groves, B. A. 2006a, ApJS, 167, 177
- Dopita et al. (2006b) Dopita, M. A., Fischera, J., Sutherland, R. S., Kewley, L. J., Tuffs, R. J., Popescu, C. C., van Breugel, W., Groves, B. A., & Leitherer, C. 2006b, ApJ, 647, 244
- Dopita et al. (2000) Dopita, M. A., Kewley, L. J., Heisler, C. A., & Sutherland, R. S. 2000, ApJ, 542, 224
- Draine (2003) Draine, B. T. 2003, ARA&A, 41, 241
- Draine et al. (2007) Draine, B. T., Dale, D. A., Bendo, G., Gordon, K. D., Smith, J. D. T., Armus, L., Engelbracht, C. W., et al. 2007, ApJ, 663, 866
- Drozdovsky & Karachentsev (2000) Drozdovsky, I. O., & Karachentsev, I. D. 2000, A&AS, 142, 425
- Durret & Bergeron (1988) Durret, F., & Bergeron, J. 1988, A&AS, 75, 273
- Dutil & Roy (1999) Dutil, Y., & Roy, J. 1999, ApJ, 516, 62
- Dutil & Roy (2001) Dutil, Y., & Roy, J.-R. 2001, AJ, 122, 1644
- Edmunds & Pagel (1978) Edmunds, M. G., & Pagel, B. E. J. 1978, MNRAS, 185, 77P
- Edmunds & Pagel (1984) —. 1984, MNRAS, 211, 507
- Engelbracht et al. (2005) Engelbracht, C. W., Gordon, K. D., Rieke, G. H., Werner, M. W., Dale, D. A., & Latter, W. B. 2005, ApJ, 628, L29
- Engelbracht et al. (2008) Engelbracht, C. W., Rieke, G. H., Gordon, K. D., Smith, J.-D. T., Werner, M. W., Moustakas, J., Willmer, C. N. A., & Vanzi, L. 2008, ApJ, 678, 804
- Erb et al. (2010) Erb, D. K., Pettini, M., Shapley, A. E., Steidel, C. C., Law, D. R., & Reddy, N. A. 2010, astro-ph/1006.5456
- Erb et al. (2006) Erb, D. K., Shapley, A. E., Pettini, M., Steidel, C. C., Reddy, N. A., & Adelberger, K. L. 2006, ApJ, 644, 813
- Ercolano (2009) Ercolano, B. 2009, MNRAS, 397, L69
- Ercolano et al. (2007) Ercolano, B., Bastian, N., & Stasińska, G. 2007, MNRAS, 379, 945
- Ercolano et al. (2010) Ercolano, B., Wesson, R., & Bastian, N. 2010, MNRAS, 401, 1375
- Esteban et al. (2009) Esteban, C., Bresolin, F., Peimbert, M., García-Rojas, J., Peimbert, A., & Mesa-Delgado, A. 2009, ApJ, 700, 654
- Esteban et al. (2004) Esteban, C., Peimbert, M., García-Rojas, J., Ruiz, M. T., Peimbert, A., & Rodríguez, M. 2004, MNRAS, 355, 229
- Ferguson et al. (1998) Ferguson, A. M. N., Gallagher, J. S., & Wyse, R. F. G. 1998, AJ, 116, 673
- Ferland et al. (1998) Ferland, G. J., Korista, K. T., Verner, D. A., Ferguson, J. W., Kingdon, J. B., & Verner, E. M. 1998, PASP, 110, 761
- Ferrarese et al. (2000a) Ferrarese, L., Ford, H. C., Huchra, J., Kennicutt, Jr., R. C., Mould, J. R., Sakai, S., Freedman, W. L., Stetson, P. B., et al. 2000a, ApJS, 128, 431
- Ferrarese et al. (2000b) Ferrarese, L., Mould, J. R., Kennicutt, Jr., R. C., Huchra, J., Ford, H. C., Freedman, W. L., Stetson, P. B., Madore, B. F., et al. 2000b, ApJ, 529, 745
- Freedman et al. (2001) Freedman, W. L., Madore, B. F., Gibson, B. K., Ferrarese, L., Kelson, D. D., Sakai, S., Mould, J. R., Kennicutt, R. C., et al. 2001, ApJ, 553, 47
- Gallazzi et al. (2005) Gallazzi, A., Charlot, S., Brinchmann, J., White, S. D. M., & Tremonti, C. A. 2005, MNRAS, 362, 41
- García-Rojas & Esteban (2007) García-Rojas, J., & Esteban, C. 2007, ApJ, 670, 457
- Garnett (1992) Garnett, D. R. 1992, AJ, 103, 1330
- Garnett (2002a) —. 2002a, astro-ph/0211148
- Garnett (2002b) —. 2002b, ApJ, 581, 1019
- Garnett et al. (2004a) Garnett, D. R., Edmunds, M. G., Henry, R. B. C., Pagel, B. E. J., & Skillman, E. D. 2004a, AJ, 128, 2772
- Garnett et al. (2004b) Garnett, D. R., Kennicutt, R. C., & Bresolin, F. 2004b, ApJ, 607, L21
- Garnett & Shields (1987) Garnett, D. R., & Shields, G. A. 1987, ApJ, 317, 82
- Garnett et al. (1999) Garnett, D. R., Shields, G. A., Peimbert, M., Torres-Peimbert, S., Skillman, E. D., Dufour, R. J., Terlevich, E., & Terlevich, R. J. 1999, ApJ, 513, 168
- Garnett et al. (1997) Garnett, D. R., Shields, G. A., Skillman, E. D., Sagan, S. P., & Dufour, R. J. 1997, ApJ, 489, 63
- Gavazzi et al. (2004) Gavazzi, G., Zaccardo, A., Sanvito, G., Boselli, A., & Bonfanti, C. 2004, A&A, 417, 499
- Gehrels (1986) Gehrels, N. 1986, ApJ, 303, 336
- Gordon et al. (2003) Gordon, K. D., Clayton, G. C., Misselt, K. A., Landolt, A. U., & Wolff, M. J. 2003, ApJ, 594, 279
- Gordon et al. (2000) Gordon, K. D., Clayton, G. C., Witt, A. N., & Misselt, K. A. 2000, ApJ, 533, 236
- Groves et al. (2004) Groves, B. A., Dopita, M. A., & Sutherland, R. S. 2004, ApJS, 153, 9
- Guseva et al. (2000) Guseva, N. G., Izotov, Y. I., & Thuan, T. X. 2000, ApJ, 531, 776
- Hainline et al. (2009) Hainline, K. N., Shapley, A. E., Kornei, K. A., Pettini, M., Buckley-Geer, E., Allam, S. S., & Tucker, D. L. 2009, ApJ, 701, 52
- Heckman (1980) Heckman, T. M. 1980, A&A, 87, 152
- Henry et al. (1994) Henry, R. B. C., Pagel, B. E. J., & Chincarini, G. L. 1994, MNRAS, 266, 421
- Hidalgo-Gamez & Olofsson (1998) Hidalgo-Gamez, A. M., & Olofsson, K. 1998, A&A, 334, 45
- Ho (2008) Ho, L. C. 2008, ARA&A, 46, 475
- Ho et al. (1997) Ho, L. C., Filippenko, A. V., & Sargent, W. L. W. 1997, ApJS, 112, 315
- Houck et al. (2004) Houck, J. R., Roellig, T. L., van Cleve, J., Forrest, W. J., Herter, T., Lawrence, C. R., Matthews, K., Reitsema, H. J., et al. 2004, ApJS, 154, 18
- Isobe et al. (1990) Isobe, T., Feigelson, E. D., Akritas, M. G., & Babu, G. J. 1990, ApJ, 364, 104
- Izotov et al. (2006) Izotov, Y. I., Stasińska, G., Meynet, G., Guseva, N. G., & Thuan, T. X. 2006, A&A, 448, 955
- Izotov & Thuan (2004) Izotov, Y. I., & Thuan, T. X. 2004, ApJ, 602, 200
- Jamet et al. (2005) Jamet, L., Stasińska, G., Pérez, E., González Delgado, R. M., & Vílchez, J. M. 2005, A&A, 444, 723
- Jansen et al. (2000) Jansen, R. A., Fabricant, D., Franx, M., & Caldwell, N. 2000, ApJS, 126, 331
- Jarrett et al. (2003) Jarrett, T. H., Chester, T., Cutri, R., Schneider, S. E., & Huchra, J. P. 2003, AJ, 125, 525
- Jenkins (2004) Jenkins, E. B. 2004, in Origin and Evolution of the Elements, ed. A. McWilliam & M. Rauch, 336–+
- Jha et al. (2007) Jha, S., Riess, A. G., & Kirshner, R. P. 2007, ApJ, 659, 122
- Karachentsev et al. (2004) Karachentsev, I. D., Karachentseva, V. E., Huchtmeier, W. K., & Makarov, D. I. 2004, AJ, 127, 2031
- Karachentsev et al. (2003) Karachentsev, I. D., Makarov, D. I., Sharina, M. E., Dolphin, A. E., Grebel, E. K., Geisler, D., Guhathakurta, P., Hodge, P. W., et al. 2003, A&A, 398, 479
- Karachentsev et al. (2000) Karachentsev, I. D., Sharina, M. E., & Huchtmeier, W. K. 2000, A&A, 362, 544
- Kauffmann et al. (2003) Kauffmann, G., Heckman, T. M., Tremonti, C., Brinchmann, J., Charlot, S., White, S. D. M., Ridgway, S. E., Brinkmann, J., et al. 2003, MNRAS, 346, 1055
- Kennicutt (1998) Kennicutt, R. 1998, in Liege International Astrophysical Colloquia, ed. B. Kaldeich, 81–+
- Kennicutt (1992a) Kennicutt, R. C. 1992a, ApJS, 79, 255
- Kennicutt (1992b) —. 1992b, ApJ, 388, 310
- Kennicutt et al. (2003a) Kennicutt, R. C., Armus, L., Bendo, G., Calzetti, D., Dale, D. A., Draine, B. T., Engelbracht, C. W., Gordon, K. D., et al. 2003a, PASP, 115, 928
- Kennicutt et al. (2003b) Kennicutt, R. C., Bresolin, F., & Garnett, D. R. 2003b, ApJ, 591, 801
- Kennicutt & Garnett (1996) Kennicutt, R. C., & Garnett, D. R. 1996, ApJ, 456, 504
- Kennicutt et al. (2009) Kennicutt, R. C., Hao, C., Calzetti, D., Moustakas, J., Dale, D. A., Bendo, G., Engelbracht, C. W., Johnson, B. D., & Lee, J. C. 2009, ApJ, 703, 1672
- Kennicutt & Skillman (2001) Kennicutt, R. C., & Skillman, E. D. 2001, AJ, 121, 1461
- Kennicutt et al. (2007) Kennicutt, Jr., R. C., Calzetti, D., Walter, F., Helou, G., Hollenbach, D. J., Armus, L., Bendo, G., Dale, D. A., et al. 2007, ApJ, 671, 333
- Kewley & Dopita (2002) Kewley, L. J., & Dopita, M. A. 2002, ApJS, 142, 35
- Kewley et al. (2001a) Kewley, L. J., Dopita, M. A., Sutherland, R. S., Heisler, C. A., & Trevena, J. 2001a, ApJ, 556, 121
- Kewley & Ellison (2008) Kewley, L. J., & Ellison, S. L. 2008, ApJ, 681, 1183
- Kewley et al. (2006) Kewley, L. J., Groves, B., Kauffmann, G., & Heckman, T. 2006, MNRAS, 372, 961
- Kewley et al. (2001b) Kewley, L. J., Heisler, C. A., Dopita, M. A., & Lumsden, S. 2001b, ApJS, 132, 37
- Kewley et al. (2000) Kewley, L. J., Heisler, C. A., Dopita, M. A., Sutherland, R., Norris, R. P., Reynolds, J., & Lumsden, S. 2000, ApJ, 530, 704
- Kewley et al. (2005) Kewley, L. J., Jansen, R. A., & Geller, M. J. 2005, PASP, 117, 227
- Kinkel & Rosa (1994) Kinkel, U., & Rosa, M. R. 1994, A&A, 282, L37
- Kniazev et al. (2004) Kniazev, A. Y., Pustilnik, S. A., Grebel, E. K., Lee, H., & Pramskij, A. G. 2004, ApJS, 153, 429
- Kobulnicky et al. (1999) Kobulnicky, H. A., Kennicutt, R. C., & Pizagno, J. L. 1999, ApJ, 514, 544
- Kobulnicky & Kewley (2004) Kobulnicky, H. A., & Kewley, L. J. 2004, ApJ, 617, 240
- Kobulnicky & Phillips (2003) Kobulnicky, H. A., & Phillips, A. C. 2003, ApJ, 599, 1031
- Kobulnicky et al. (2003) Kobulnicky, H. A., Willmer, C. N. A., Phillips, A. C., Koo, D. C., Faber, S. M., Weiner, B. J., Sarajedini, V. L., Simard, L., et al. 2003, ApJ, 599, 1006
- Kong & Cheng (2002) Kong, X., & Cheng, F. Z. 2002, A&A, 389, 845
- Kormendy & Kennicutt (2004) Kormendy, J., & Kennicutt, Jr., R. C. 2004, ARA&A, 42, 603
- Kudritzki et al. (2008) Kudritzki, R., Urbaneja, M. A., Bresolin, F., Przybilla, N., Gieren, W., & Pietrzyński, G. 2008, ApJ, 681, 269
- Lamareille et al. (2004) Lamareille, F., Mouhcine, M., Contini, T., Lewis, I., & Maddox, S. 2004, MNRAS, 350, 396
- Lee et al. (2003a) Lee, H., Grebel, E. K., & Hodge, P. W. 2003a, A&A, 401, 141
- Lee et al. (2003b) Lee, H., McCall, M. L., Kingsburgh, R. L., Ross, R., & Stevenson, C. C. 2003b, AJ, 125, 146
- Lee & Skillman (2004) Lee, H., & Skillman, E. D. 2004, ApJ, 614, 698
- Lee et al. (2006a) Lee, H., Skillman, E. D., Cannon, J. M., Jackson, D. C., Gehrz, R. D., Polomski, E. F., & Woodward, C. E. 2006a, ApJ, 647, 970
- Lee et al. (2006b) Lee, H., Skillman, E. D., & Venn, K. A. 2006b, ApJ, 642, 813
- Lee et al. (2004) Lee, J. C., Salzer, J. J., & Melbourne, J. 2004, ApJ, 616, 752
- Lehnert & Heckman (1994) Lehnert, M. D., & Heckman, T. M. 1994, ApJ, 426, L27
- Lehnert et al. (2009) Lehnert, M. D., Nesvadba, N. P. H., Tiran, L. L., Matteo, P. D., van Driel, W., Douglas, L. S., Chemin, L., & Bournaud, F. 2009, ApJ, 699, 1660
- Leonard et al. (2002) Leonard, D. C., Filippenko, A. V., Li, W., Matheson, T., Kirshner, R. P., Chornock, R., Van Dyk, S. D., Berlind, P., Calkins, M. L., Challis, P. M., Garnavich, P. M., Jha, S., & Mahdavi, A. 2002, AJ, 124, 2490
- Levesque et al. (2010) Levesque, E. M., Kewley, L. J., & Larson, K. L. 2010, AJ, 139, 712
- Liang et al. (2006) Liang, Y. C., Yin, S. Y., Hammer, F., Deng, L. C., Flores, H., & Zhang, B. 2006, ApJ, 652, 257
- Liu et al. (2008) Liu, X., Shapley, A. E., Coil, A. L., Brinchmann, J., & Ma, C.-P. 2008, ApJ, 678, 758
- Macri et al. (2001) Macri, L. M., Stetson, P. B., Bothun, G. D., Freedman, W. L., Garnavich, P. M., Jha, S., Madore, B. F., & Richmond, M. W. 2001, ApJ, 559, 243
- Madden (2000) Madden, S. C. 2000, New Astronomy Review, 44, 249
- Maier et al. (2006) Maier, C., Lilly, S. J., Carollo, C. M., Meisenheimer, K., Hippelein, H., & Stockton, A. 2006, ApJ, 639, 858
- Maier et al. (2005) Maier, C., Lilly, S. J., Carollo, C. M., Stockton, A., & Brodwin, M. 2005, ApJ, 634, 849
- Maiolino et al. (2008) Maiolino, R., Nagao, T., Grazian, A., Cocchia, F., Marconi, A., Mannucci, F., Cimatti, A., Pipino, A., et al. 2008, A&A, 488, 463
- Makarova et al. (1998) Makarova, L., Karachentsev, I., Takalo, L. O., Heinaemaeki, P., & Valtonen, M. 1998, A&AS, 128, 459
- Makarova et al. (2002) Makarova, L. N., Grebel, E. K., Karachentsev, I. D., Dolphin, A. E., Karachentseva, V. E., Sharina, M. E., Geisler, D., Guhathakurta, P., et al. 2002, A&A, 396, 473
- Marcon-Uchida et al. (2010) Marcon-Uchida, M. M., Matteucci, F., & Costa, R. D. D. 2010, astro-ph/1004.4139
- Martín-Hernández et al. (2002) Martín-Hernández, N. L., Peeters, E., Morisset, C., Tielens, A. G. G. M., Cox, P., Roelfsema, P. R., Baluteau, J., Schaerer, D., et al. 2002, A&A, 381, 606
- Martín-Manjón et al. (2010) Martín-Manjón, M. L., García-Vargas, M. L., Mollá, M., & Díaz, A. I. 2010, MNRAS, 200
- Masegosa et al. (1991) Masegosa, J., Moles, M., & del Olmo, A. 1991, A&A, 249, 505
- Massey et al. (1988) Massey, P., Strobel, K., Barnes, J. V., & Anderson, E. 1988, ApJ, 328, 315
- Masters (2005) Masters, K. L. 2005, PhD thesis, Cornell University, United States – New York
- Mathis & Wood (2005) Mathis, J. S., & Wood, K. 2005, MNRAS, 360, 227
- Matsumoto et al. (2001) Matsumoto, H., Tsuru, T. G., Koyama, K., Awaki, H., Canizares, C. R., Kawai, N., Matsushita, S., & Kawabe, R. 2001, ApJ, 547, L25
- McCall et al. (1985) McCall, M. L., Rybski, P. M., & Shields, G. A. 1985, ApJS, 57, 1
- McGaugh (1991) McGaugh, S. S. 1991, ApJ, 380, 140
- Mei et al. (2007) Mei, S., Blakeslee, J. P., Côté, P., Tonry, J. L., West, M. J., Ferrarese, L., Jordán, A., Peng, E. W., Anthony, A., & Merritt, D. 2007, ApJ, 655, 144
- Meurer et al. (2006) Meurer, G. R., Hanish, D. J., Ferguson, H. C., Knezek, P. M., Kilborn, V. A., Putman, M. E., Smith, R. C., Koribalski, B., et al. 2006, ApJS, 165, 307
- Miller & Hodge (1996) Miller, B. W., & Hodge, P. 1996, ApJ, 458, 467
- Molla et al. (1996) Molla, M., Ferrini, F., & Diaz, A. I. 1996, ApJ, 466, 668
- Mouhcine & Contini (2002) Mouhcine, M., & Contini, T. 2002, A&A, 389, 106
- Moustakas & Kennicutt (2006a) Moustakas, J., & Kennicutt, R. C. 2006a, ApJS, 164, 81
- Moustakas et al. (2006) Moustakas, J., Kennicutt, R. C., & Tremonti, C. A. 2006, ApJ, 642, 775
- Moustakas & Kennicutt (2006b) Moustakas, J., & Kennicutt, Jr., R. C. 2006b, ApJ, 651, 155
- Moy et al. (2001) Moy, E., Rocca-Volmerange, B., & Fioc, M. 2001, A&A, 365, 347
- Muñoz-Mateos et al. (2009a) Muñoz-Mateos, J. C., Gil de Paz, A., Boissier, S., Zamorano, J., Dale, D. A., Pérez-González, P. G., Gallego, J., Madore, B. F., et al. 2009a, ApJ, 701, 1965
- Muñoz-Mateos et al. (2009b) Muñoz-Mateos, J. C., Gil de Paz, A., Zamorano, J., Boissier, S., Dale, D. A., Pérez-González, P. G., Gallego, J., Madore, B. F., et al. 2009b, ApJ, 703, 1569
- Murphy et al. (2006) Murphy, E. J., Braun, R., Helou, G., Armus, L., Kenney, J. D. P., Gordon, K. D., Bendo, G. J., Dale, D. A., et al. 2006, ApJ, 638, 157
- Nagao et al. (2006) Nagao, T., Maiolino, R., & Marconi, A. 2006, A&A, 459, 85
- Ocvirk et al. (2006) Ocvirk, P., Pichon, C., Lançon, A., & Thiébaut, E. 2006, MNRAS, 365, 46
- O’Donnell (1994) O’Donnell, J. E. 1994, ApJ, 422, 158
- Oey & Kennicutt (1993) Oey, M. S., & Kennicutt, R. C. 1993, ApJ, 411, 137
- Okada et al. (2008) Okada, Y., Onaka, T., Miyata, T., Okamoto, Y. K., Sakon, I., Shibai, H., & Takahashi, H. 2008, ApJ, 682, 416
- Osterbrock & Ferland (2006) Osterbrock, D. E., & Ferland, G. J. 2006, Astrophysics of gaseous nebulae and active galactic nuclei (Astrophysics of gaseous nebulae and active galactic nuclei, 2nd. ed. by D.E. Osterbrock and G.J. Ferland. Sausalito, CA: University Science Books, 2006)
- Pagel et al. (1979) Pagel, B. E. J., Edmunds, M. G., Blackwell, D. E., Chun, M. S., & Smith, G. 1979, MNRAS, 189, 95
- Panter et al. (2003) Panter, B., Heavens, A. F., & Jimenez, R. 2003, MNRAS, 343, 1145
- Peimbert & Peimbert (2005) Peimbert, A., & Peimbert, M. 2005, in Revista Mexicana de Astronomia y Astrofisica Conference Series, Vol. 23, Revista Mexicana de Astronomia y Astrofisica Conference Series, ed. S. Torres-Peimbert & G. MacAlpine, 9–14
- Peimbert et al. (2005) Peimbert, A., Peimbert, M., & Ruiz, M. T. 2005, ApJ, 634, 1056
- Peimbert (1967) Peimbert, M. 1967, ApJ, 150, 825
- Peimbert et al. (2007) Peimbert, M., Peimbert, A., Esteban, C., García-Rojas, J., Bresolin, F., Carigi, L., Ruiz, M. T., & López-Sánchez, A. R. 2007, in Revista Mexicana de Astronomia y Astrofisica, vol. 27, Vol. 29, Revista Mexicana de Astronomia y Astrofisica Conference Series, 72–79
- Pérez-Montero & Díaz (2005) Pérez-Montero, E., & Díaz, A. I. 2005, MNRAS, 361, 1063
- Pettini (2006) Pettini, M. 2006, astro-ph/0603066
- Pettini & Pagel (2004) Pettini, M., & Pagel, B. E. J. 2004, MNRAS, 348, L59
- Pettini et al. (2001) Pettini, M., Shapley, A. E., Steidel, C. C., Cuby, J., Dickinson, M., Moorwood, A. F. M., Adelberger, K. L., & Giavalisco, M. 2001, ApJ, 554, 981
- Pietrzyński et al. (2004) Pietrzyński, G., Gieren, W., Udalski, A., Bresolin, F., Kudritzki, R.-P., Soszyński, I., Szymański, M., & Kubiak, M. 2004, AJ, 128, 2815
- Pilyugin (2000) Pilyugin, L. S. 2000, A&A, 362, 325
- Pilyugin (2001) —. 2001, A&A, 369, 594
- Pilyugin (2005) —. 2005, A&A, 436, L1
- Pilyugin et al. (2004a) Pilyugin, L. S., Contini, T., & Vílchez, J. M. 2004a, A&A, 423, 427
- Pilyugin & Thuan (2005) Pilyugin, L. S., & Thuan, T. X. 2005, ApJ, 631, 231
- Pilyugin et al. (2003) Pilyugin, L. S., Thuan, T. X., & Vílchez, J. M. 2003, A&A, 397, 487
- Pilyugin et al. (2006) —. 2006, MNRAS, 210
- Pilyugin et al. (2007) —. 2007, MNRAS, 376, 353
- Pilyugin et al. (2004b) Pilyugin, L. S., Vílchez, J. M., & Contini, T. 2004b, A&A, 425, 849
- Poglitsch et al. (2008) Poglitsch, A., Waelkens, C., Bauer, O. H., Cepa, J., Feuchtgruber, H., Henning, T., van Hoof, C., Kerschbaum, F., Krause, O., Renotte, E., Rodriguez, L., Saraceno, P., & Vandenbussche, B. 2008, in Society of Photo-Optical Instrumentation Engineers (SPIE) Conference Series, Vol. 7010, Society of Photo-Optical Instrumentation Engineers (SPIE) Conference Series
- Prantzos & Boissier (2000) Prantzos, N., & Boissier, S. 2000, MNRAS, 313, 338
- Prescott et al. (2007) Prescott, M. K. M., Kennicutt, Jr., R. C., Bendo, G. J., Buckalew, B. A., Calzetti, D., Engelbracht, C. W., Gordon, K. D., Hollenbach, D. J., et al. 2007, ApJ, 668, 182
- Prugniel & Heraudeau (1998) Prugniel, P., & Heraudeau, P. 1998, A&AS, 128, 299
- Przybilla et al. (2008) Przybilla, N., Nieva, M., & Butler, K. 2008, ApJ, 688, L103
- Regan et al. (2004) Regan, M. W., Thornley, M. D., Bendo, G. J., Draine, B. T., Li, A., Dale, D. A., Engelbracht, C. W., Kennicutt, Jr., R. C., et al. 2004, ApJS, 154, 204
- Rieke et al. (2009) Rieke, G. H., Alonso-Herrero, A., Weiner, B. J., Pérez-González, P. G., Blaylock, M., Donley, J. L., & Marcillac, D. 2009, ApJ, 692, 556
- Rieke et al. (2004) Rieke, G. H., Young, E. T., Engelbracht, C. W., Kelly, D. M., Low, F. J., Haller, E. E., Beeman, J. W., Gordon, K. D., et al. 2004, ApJS, 154, 25
- Rosales-Ortega (2009) Rosales-Ortega, F. F. 2009, PhD thesis, PhD Thesis, University of Cambridge, 2010.
- Rosales-Ortega et al. (2010) Rosales-Ortega, F. F., Kennicutt, R. C., Sánchez, S. F., Díaz, A. I., Pasquali, A., Johnson, B. D., & Hao, C. N. 2010, MNRAS, 405, 735
- Rosolowsky & Simon (2008) Rosolowsky, E., & Simon, J. D. 2008, ApJ, 675, 1213
- Roussel et al. (2007) Roussel, H., Helou, G., Hollenbach, D. J., Draine, B. T., Smith, J. D., Armus, L., Schinnerer, E., Walter, F., et al. 2007, ApJ, 669, 959
- Roussel et al. (2006) Roussel, H., Helou, G., Smith, J. D., Draine, B. T., Hollenbach, D. J., Moustakas, J., Spoon, H. W., Kennicutt, R. C., et al. 2006, ApJ, 646, 841
- Rubin et al. (2008) Rubin, R. H., Simpson, J. P., Colgan, S. W. J., Dufour, R. J., Brunner, G., McNabb, I. A., Pauldrach, A. W. A., Erickson, E. F., Haas, M. R., & Citron, R. I. 2008, MNRAS, 387, 45
- Rudolph et al. (2006) Rudolph, A. L., Fich, M., Bell, G. R., Norsen, T., Simpson, J. P., Haas, M. R., & Erickson, E. F. 2006, ApJS, 162, 346
- Ryder (1995) Ryder, S. D. 1995, ApJ, 444, 610
- Salpeter (1955) Salpeter, E. E. 1955, ApJ, 121, 161
- Salzer et al. (2005) Salzer, J. J., Lee, J. C., Melbourne, J., Hinz, J. L., Alonso-Herrero, A., & Jangren, A. 2005, ApJ, 624, 661
- Sarzi et al. (2006) Sarzi, M., Falcón-Barroso, J., Davies, R. L., Bacon, R., Bureau, M., Cappellari, M., de Zeeuw, P. T., Emsellem, E., et al. 2006, MNRAS, 366, 1151
- Savaglio et al. (2005) Savaglio, S., Glazebrook, K., Le Borgne, D., Juneau, S., Abraham, R. G., Chen, H., Crampton, D., McCarthy, P. J., et al. 2005, ApJ, 635, 260
- Schawinski et al. (2007) Schawinski, K., Thomas, D., Sarzi, M., Maraston, C., Kaviraj, S., Joo, S., Yi, S. K., & Silk, J. 2007, MNRAS, 382, 1415
- Schlegel et al. (1998) Schlegel, D. J., Finkbeiner, D. P., & Davis, M. 1998, ApJ, 500, 525
- Searle (1971) Searle, L. 1971, ApJ, 168, 327
- Serenelli et al. (2009) Serenelli, A. M., Basu, S., Ferguson, J. W., & Asplund, M. 2009, ApJ, 705, L123
- Seth et al. (2005) Seth, A. C., Dalcanton, J. J., & de Jong, R. S. 2005, AJ, 129, 1331
- Seyfert (1943) Seyfert, C. K. 1943, ApJ, 97, 28
- Shapley et al. (2005) Shapley, A. E., Coil, A. L., Ma, C., & Bundy, K. 2005, ApJ, 635, 1006
- Shapley et al. (2004) Shapley, A. E., Erb, D. K., Pettini, M., Steidel, C. C., & Adelberger, K. L. 2004, ApJ, 612, 108
- Sharina et al. (1996) Sharina, M. E., Karachentsev, I. D., & Tikhonov, N. A. 1996, A&AS, 119, 499
- Shaver et al. (1983) Shaver, P. A., McGee, R. X., Newton, L. M., Danks, A. C., & Pottasch, S. R. 1983, MNRAS, 204, 53
- Shi et al. (2006) Shi, F., Kong, X., & Cheng, F. Z. 2006, A&A, 453, 487
- Shields (1990) Shields, G. A. 1990, ARA&A, 28, 525
- Shields (1991) —. 1991, PASP, 103, 916
- Shields & Kennicutt (1995) Shields, J. C., & Kennicutt, Jr., R. C. 1995, ApJ, 454, 807
- Simón-Díaz (2010) Simón-Díaz, S. 2010, A&A, 510, A260000+
- Simón-Díaz & Stasińska (2008) Simón-Díaz, S., & Stasińska, G. 2008, MNRAS, 389, 1009
- Skillman (1989) Skillman, E. D. 1989, ApJ, 347, 883
- Skillman (1998) Skillman, E. D. 1998, in Stellar astrophysics for the local group: VIII Canary Islands Winter School of Astrophysics, ed. A. Aparicio, A. Herrero, & F. Sánchez, 457–+
- Skillman et al. (1989) Skillman, E. D., Kennicutt, R. C., & Hodge, P. W. 1989, ApJ, 347, 875
- Smith et al. (2004) Smith, J. D. T., Dale, D. A., Armus, L., Draine, B. T., Hollenbach, D. J., Roussel, H., Helou, G., Kennicutt, Jr., R. C., et al. 2004, ApJS, 154, 199
- Smith et al. (2007) Smith, J. D. T., Draine, B. T., Dale, D. A., Moustakas, J., Kennicutt, Jr., R. C., Helou, G., Armus, L., Roussel, H., et al. 2007, ApJ, 656, 770
- Stasińska (2002) Stasińska, G. 2002, in Revista Mexicana de Astronomia y Astrofisica Conference Series, Vol. 12, Revista Mexicana de Astronomia y Astrofisica Conference Series, ed. W. J. Henney, J. Franco, & M. Martos, 62–69
- Stasińska (2005) Stasińska, G. 2005, A&A, 434, 507
- Stasińska (2006) —. 2006, A&A, 454, L127
- Stasińska (2007) —. 2007, astro-ph/0704.0348
- Stasińska (2010) Stasińska, G. 2010, in IAU Symposium, Vol. 262, IAU Symposium, ed. G. Bruzual & S. Charlot, 93–96
- Stasińska et al. (2006) Stasińska, G., Cid Fernandes, R., Mateus, A., Sodré, L., & Asari, N. V. 2006, MNRAS, 371, 972
- Stasińska et al. (1986) Stasińska, G., Comte, G., & Vigroux, L. 1986, A&A, 154, 352
- Stasińska & Schaerer (1999) Stasińska, G., & Schaerer, D. 1999, A&A, 351, 72
- Stasińska et al. (2007) Stasińska, G., Tenorio-Tagle, G., Rodríguez, M., & Henney, W. J. 2007, A&A, 471, 193
- Stauffer & Bothun (1984) Stauffer, J. R., & Bothun, G. D. 1984, AJ, 89, 1702
- Storchi-Bergmann et al. (1994) Storchi-Bergmann, T., Calzetti, D., & Kinney, A. L. 1994, ApJ, 429, 572
- Storchi-Bergmann et al. (1995) Storchi-Bergmann, T., Kinney, A. L., & Challis, P. 1995, ApJS, 98, 103
- Storchi-Bergmann et al. (1996) Storchi-Bergmann, T., Wilson, A. S., & Baldwin, J. A. 1996, ApJ, 460, 252
- Storey & Hummer (1995) Storey, P. J., & Hummer, D. G. 1995, MNRAS, 272, 41
- Sutherland & Dopita (1993) Sutherland, R. S., & Dopita, M. A. 1993, ApJS, 88, 253
- Tajer et al. (2005) Tajer, M., Trinchieri, G., Wolter, A., Campana, S., Moretti, A., & Tagliaferri, G. 2005, A&A, 435, 799
- Tojeiro et al. (2007) Tojeiro, R., Heavens, A. F., Jimenez, R., & Panter, B. 2007, MNRAS, 381, 1252
- Tonry et al. (2001) Tonry, J. L., Dressler, A., Blakeslee, J. P., Ajhar, E. A., Fletcher, A. B., Luppino, G. A., Metzger, M. R., & Moore, C. B. 2001, ApJ, 546, 681
- Torres-Peimbert et al. (1989) Torres-Peimbert, S., Peimbert, M., & Fierro, J. 1989, ApJ, 345, 186
- Tosi et al. (2001) Tosi, M., Sabbi, E., Bellazzini, M., Aloisi, A., Greggio, L., Leitherer, C., & Montegriffo, P. 2001, AJ, 122, 1271
- Tremonti et al. (2004) Tremonti, C. A., Heckman, T. M., Kauffmann, G., Brinchmann, J., Charlot, S., White, S. D. M., Seibert, M., Peng, E. W., et al. 2004, ApJ, 613, 898
- Tully (1974) Tully, R. B. 1974, ApJS, 27, 437
- Tully et al. (1998) Tully, R. B., Pierce, M. J., Huang, J., Saunders, W., Verheijen, M. A. W., & Witchalls, P. L. 1998, AJ, 115, 2264
- Urbaneja et al. (2005) Urbaneja, M. A., Herrero, A., Bresolin, F., Kudritzki, R., Gieren, W., Puls, J., Przybilla, N., Najarro, F., & Pietrzyński, G. 2005, ApJ, 622, 862
- van Zee & Haynes (2006) van Zee, L., & Haynes, M. P. 2006, ApJ, 636, 214
- van Zee et al. (1997) van Zee, L., Haynes, M. P., & Salzer, J. J. 1997, AJ, 114, 2479
- van Zee et al. (1998) van Zee, L., Salzer, J. J., Haynes, M. P., O’Donoghue, A. A., & Balonek, T. J. 1998, AJ, 116, 2805
- van Zee et al. (2006) van Zee, L., Skillman, E. D., & Haynes, M. P. 2006, ApJ, 637, 269
- Vázquez & Leitherer (2005) Vázquez, G. A., & Leitherer, C. 2005, ApJ, 621, 695
- Veilleux & Osterbrock (1987) Veilleux, S., & Osterbrock, D. E. 1987, ApJS, 63, 295
- Vila-Costas & Edmunds (1992) Vila-Costas, M. B., & Edmunds, M. G. 1992, MNRAS, 259, 121
- Vilchez & Esteban (1996) Vilchez, J. M., & Esteban, C. 1996, MNRAS, 280, 720
- Walter et al. (2008) Walter, F., Brinks, E., de Blok, W. J. G., Bigiel, F., Kennicutt, R. C., Thornley, M. D., & Leroy, A. 2008, AJ, 136, 2563
- Walter et al. (2007) Walter, F., Cannon, J. M., Roussel, H., Bendo, G. J., Calzetti, D., Dale, D. A., Draine, B. T., Helou, G., et al. 2007, ApJ, 661, 102
- Webster & Smith (1983) Webster, B. L., & Smith, M. G. 1983, MNRAS, 204, 743
- Weedman et al. (2005) Weedman, D. W., Hao, L., Higdon, S. J. U., Devost, D., Wu, Y., Charmandaris, V., Brandl, B., Bass, E., & Houck, J. R. 2005, ApJ, 633, 706
- Witt & Gordon (2000) Witt, A. N., & Gordon, K. D. 2000, ApJ, 528, 799
- Wu et al. (2008) Wu, Y., Bernard-Salas, J., Charmandaris, V., Lebouteiller, V., Hao, L., Brandl, B. R., & Houck, J. R. 2008, ApJ, 673, 193
- Wu et al. (2009) Wu, Y., Charmandaris, V., Huang, J., Spinoglio, L., & Tommasin, S. 2009, ApJ, 701, 658
- Yin et al. (2007) Yin, S. Y., Liang, Y. C., Hammer, F., Brinchmann, J., Zhang, B., Deng, L. C., & Flores, H. 2007, A&A, 462, 535
- York et al. (2000) York, D. G., et al. 2000, AJ, 120, 1579
- Zaritsky et al. (1994) Zaritsky, D., Kennicutt, R. C., & Huchra, J. P. 1994, ApJ, 420, 87
- Zhu et al. (2008) Zhu, Y., Wu, H., Cao, C., & Li, H. 2008, ApJ, 686, 155
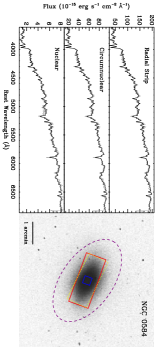
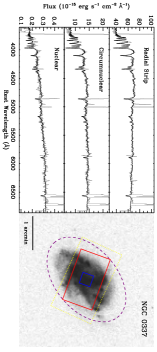
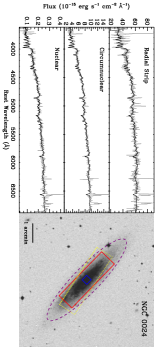
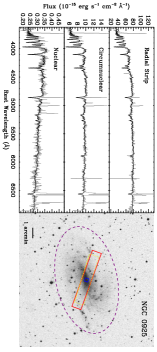
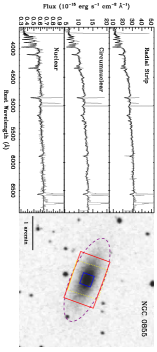
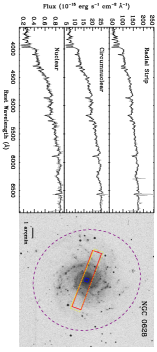
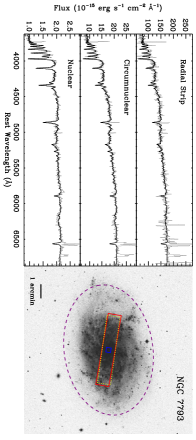
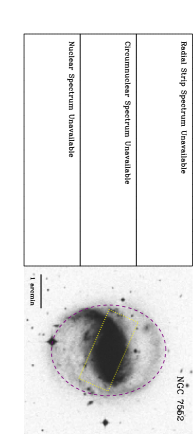
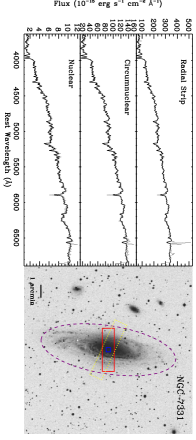
| Distance | Distance | |||||||||
|---|---|---|---|---|---|---|---|---|---|---|
| Galaxy | Type | (mag) | (arcmin) | (deg) | (deg) | (mag) | (mag) | (Mpc) | Method | Ref. |
| (1) | (2) | (3) | (4) | (5) | (6) | (7) | (8) | (9) | (10) | (11) |
| NGC 0024 | SAc | 0.020 | 2.88 | 82 | 46 | Flow | 1 | |||
| NGC 0337 | SBd | 0.112 | 1.44 | 52 | 130 | Flow | 1 | |||
| NGC 0584 | E4 | 0.042 | 2.08 | 58 | 55 | SBF | 2 | |||
| NGC 0628 | SAc | 0.070 | 5.24 | 24 | 25 | BS | 3 | |||
| NGC 0855 | E | 0.071 | 1.32 | 71 | 67 | SBF | 2 | |||
| NGC 0925 | SABd | 0.076 | 5.24 | 57 | 102 | aaFor these objects we adopt the HST Key Project Cepheid distance uncorrected for metallicity variations (see Freedman et al. 2001). | Ceph | 4 | ||
| NGC 1097 | SBb | 0.027 | 4.67 | 48 | 130 | Flow | 1 | |||
| NGC 1266 | SB0 pec | 0.098 | 0.77 | 53 | 108 | Flow | 1 | |||
| NGC 1291 | SB0/a | 0.013 | 4.89 | 34 | 156 | Flow | 1 | |||
| NGC 1316 | SAB0 | 0.021 | 6.01 | 46 | 50 | SBF | 2 | |||
| NGC 1377 | S0 | 0.028 | 0.89 | 62 | 92 | Flow | 1 | |||
| NGC 1404 | E1 | 0.011 | 1.66 | 27 | 163 | Mult | 5 | |||
| NGC 1482 | SA0 pec | 0.040 | 1.23 | 57 | 103 | Flow | 1 | |||
| NGC 1512 | SBab | 0.011 | 4.46 | 52 | 90 | Flow | 1 | |||
| NGC 1566 | SABbc | 0.009 | 4.16 | 38 | 60 | Flow | 1 | |||
| NGC 1705 | SA0 pec | 0.008 | 0.95 | 43 | 50 | TRGB | 6 | |||
| NGC 2403 | SABcd | 0.040 | 10.94 | 57 | 128 | Ceph | 4 | |||
| Ho II | Im | 0.032 | 3.97 | 38 | 16 | TRGB | 7 | |||
| M 81 Dw A | I? | 0.020 | 0.65 | 59 | TRGB | 7 | ||||
| DDO 053 | Im | 0.038 | 0.77 | 30 | 121 | TRGB | 7 | |||
| NGC 2798 | SBa pec | 0.020 | 1.28 | 70 | 160 | Flow | 1 | |||
| NGC 2841 | SAb | 0.015 | 4.06 | 66 | 147 | Ceph | 8 | |||
| NGC 2915 | I0 | 0.275 | 0.95 | 61 | 130 | TRGB | 7 | |||
| Ho I | IABm | 0.050 | 1.82 | 36 | TRGB | 7 | ||||
| NGC 2976 | SAc pec | 0.071 | 2.94 | 65 | 143 | TRGB | 7 | |||
| NGC 3049 | SBab | 0.038 | 1.09 | 49 | 25 | Flow | 1 | |||
| NGC 3031 | SAab | 0.080 | 13.46 | 60 | 157 | aaFor these objects we adopt the HST Key Project Cepheid distance uncorrected for metallicity variations (see Freedman et al. 2001). | Ceph | 4 | ||
| NGC 3034 | I0 | 0.156 | 5.61 | 70 | 65 | TRGB | 9 | |||
| Ho IX | Im | 0.079 | 1.26 | 36 | Mem | 7 | ||||
| M 81 Dw B | Im | 0.081 | 0.44 | 49 | 140 | BS | 7 | |||
| NGC 3190 | SAa pec | 0.025 | 2.18 | 72 | 125 | SN | 10 | |||
| NGC 3184 | SABcd | 0.017 | 3.71 | 21 | 135 | SN | 11 | |||
| NGC 3198 | SBc | 0.012 | 4.26 | 70 | 35 | aaFor these objects we adopt the HST Key Project Cepheid distance uncorrected for metallicity variations (see Freedman et al. 2001). | Ceph | 4 | ||
| IC 2574 | SABm | 0.036 | 6.59 | 68 | 50 | TRGB | 7 | |||
| NGC 3265 | E | 0.024 | 0.64 | 40 | 73 | Flow | 1 | |||
| Mrk 33 | Im pec | 0.012 | 0.50 | 21 | 150 | Flow | 1 | |||
| NGC 3351 | SBb | 0.028 | 3.71 | 48 | 13 | aaFor these objects we adopt the HST Key Project Cepheid distance uncorrected for metallicity variations (see Freedman et al. 2001). | Ceph | 4 | ||
| NGC 3521 | SABbc | 0.057 | 5.48 | 64 | 163 | Flow | 1 | |||
| NGC 3621 | SAd | 0.081 | 6.15 | 56 | 159 | aaFor these objects we adopt the HST Key Project Cepheid distance uncorrected for metallicity variations (see Freedman et al. 2001). | Ceph | 4 | ||
| NGC 3627 | SABb | 0.033 | 4.56 | 65 | 173 | aaFor these objects we adopt the HST Key Project Cepheid distance uncorrected for metallicity variations (see Freedman et al. 2001). | Ceph | 4 | ||
| NGC 3773 | SA0 | 0.027 | 0.59 | 32 | 165 | Flow | 1 | |||
| NGC 3938 | SAc | 0.021 | 2.69 | 24 | 29 | Flow | 1 | |||
| NGC 4125 | E6 pec | 0.019 | 2.88 | 58 | 95 | SBF | 2 | |||
| NGC 4236 | SBdm | 0.015 | 10.94 | 74 | 162 | TRGB | 7 | |||
| NGC 4254 | SAc | 0.039 | 2.69 | 30 | 24 | bbNGC 4254, NGC 4450, NGC 4569, and NGC 4579 have been placed at the distance of the Virgo cluster ( Mpc; Mei et al. 2007). | Mem | 12 | ||
| NGC 4321 | SABbc | 0.026 | 3.71 | 32 | 30 | aaFor these objects we adopt the HST Key Project Cepheid distance uncorrected for metallicity variations (see Freedman et al. 2001). | Ceph | 4 | ||
| NGC 4450 | SAab | 0.028 | 2.62 | 43 | 175 | bbNGC 4254, NGC 4450, NGC 4569, and NGC 4579 have been placed at the distance of the Virgo cluster ( Mpc; Mei et al. 2007). | Mem | 12 | ||
| NGC 4536 | SABbc | 0.018 | 3.79 | 67 | 130 | aaFor these objects we adopt the HST Key Project Cepheid distance uncorrected for metallicity variations (see Freedman et al. 2001). | Ceph | 4 | ||
| NGC 4552 | E | 0.041 | 2.56 | 24 | 150 | Mult | 5 | |||
| NGC 4559 | SABcd | 0.018 | 5.36 | 68 | 150 | Flow | 1 | |||
| NGC 4569 | SABab | 0.047 | 4.78 | 65 | 23 | bbNGC 4254, NGC 4450, NGC 4569, and NGC 4579 have been placed at the distance of the Virgo cluster ( Mpc; Mei et al. 2007). | Mem | 12 | ||
| NGC 4579 | SABb | 0.041 | 2.94 | 38 | 95 | bbNGC 4254, NGC 4450, NGC 4569, and NGC 4579 have been placed at the distance of the Virgo cluster ( Mpc; Mei et al. 2007). | Mem | 12 | ||
| NGC 4594 | SAa | 0.051 | 4.36 | 68 | 90 | Mult | 5 | |||
| NGC 4625 | SABm pec | 0.018 | 1.09 | 30 | 28 | Flow | 1 | |||
| NGC 4631 | SBd | 0.017 | 7.74 | 89 | 86 | TRGB | 13 | |||
| NGC 4725 | SABab pec | 0.012 | 5.36 | 46 | 35 | aaFor these objects we adopt the HST Key Project Cepheid distance uncorrected for metallicity variations (see Freedman et al. 2001). | Ceph | 4 | ||
| NGC 4736 | SAab | 0.018 | 5.61 | 36 | 105 | SBF | 2 | |||
| DDO 154 | IBm | 0.009 | 1.51 | 44 | 35 | BS | 14 | |||
| NGC 4826 | SAab | 0.041 | 5.00 | 59 | 115 | SBF | 2 | |||
| DDO 165 | Im | 0.024 | 1.73 | 58 | 90 | TRGB | 7 | |||
| NGC 5033 | SAc | 0.012 | 5.36 | 64 | 170 | Flow | 1 | |||
| NGC 5055 | SAbc | 0.018 | 6.30 | 56 | 105 | Flow | 1 | |||
| NGC 5194 | SABbc pec | 0.035 | 5.61 | 20ccFor NGC 5194 we adopt the kinematic inclination angle determined by Tully (1974). | 163 | ddThe interacting pair NGC 5194 (M 51 a) and NGC 5195 have been placed at a common distance. | PNLF | 15 | ||
| NGC 5195 | SB0 pec | 0.035 | 2.88 | 38 | 79 | ddThe interacting pair NGC 5194 (M 51 a) and NGC 5195 have been placed at a common distance. | PNLF | 15 | ||
| Tol 89 | SBdm | 0.066 | 1.41 | 54 | 172 | Flow | 1 | |||
| NGC 5408 | IBm | 0.068 | 0.81 | 62 | 62 | TRGB | 7 | |||
| NGC 5474 | SAcd pec | 0.011 | 2.39 | 27 | 98 | BS | 16 | |||
| NGC 5713 | SABbc pec | 0.039 | 1.38 | 27 | 10 | Flow | 1 | |||
| NGC 5866 | S0 | 0.013 | 2.34 | 68 | 128 | SBF | 2 | |||
| IC 4710 | SBm | 0.089 | 1.82 | 40 | 4 | Flow | 1 | |||
| NGC 6822 | IBm | 0.231 | 7.74 | 50eeFor NGC 6822 we adopt the kinematic inclination and position angle derived by Brandenburg & Skillman (1998). We have also adjusted the apparent - and -band magnitudes for this object from Dale et al. (2007) by mag to better match the -band magnitude from Karachentsev et al. (2004). | 122eeFor NGC 6822 we adopt the kinematic inclination and position angle derived by Brandenburg & Skillman (1998). We have also adjusted the apparent - and -band magnitudes for this object from Dale et al. (2007) by mag to better match the -band magnitude from Karachentsev et al. (2004). | eeFor NGC 6822 we adopt the kinematic inclination and position angle derived by Brandenburg & Skillman (1998). We have also adjusted the apparent - and -band magnitudes for this object from Dale et al. (2007) by mag to better match the -band magnitude from Karachentsev et al. (2004). | eeFor NGC 6822 we adopt the kinematic inclination and position angle derived by Brandenburg & Skillman (1998). We have also adjusted the apparent - and -band magnitudes for this object from Dale et al. (2007) by mag to better match the -band magnitude from Karachentsev et al. (2004). | Ceph | 17 | |
| NGC 6946 | SABcd | 0.342 | 5.74 | 32 | 53 | BS | 18 | |||
| NGC 7331 | SAb | 0.091 | 5.24 | 72 | 171 | aaFor these objects we adopt the HST Key Project Cepheid distance uncorrected for metallicity variations (see Freedman et al. 2001). | Ceph | 4 | ||
| NGC 7552 | SBab | 0.014 | 1.69 | 38 | 1 | Flow | 1 | |||
| NGC 7793 | SAd | 0.019 | 4.67 | 48 | 98 | TRGB | 7 |
Note. — (1) SINGS galaxy name; (2) Morphological type from Kennicutt et al. (2003a); (3) Color excess used to correct the optical spectroscopy and photometry for foreground Galactic reddening (Schlegel et al. 1998); (4) Radius of the major axis at the mag arcsec-2 isophote (de Vaucouleurs et al. 1991); (5-6) Galaxy inclination and position angles (de Vaucouleurs et al. 1991; Jarrett et al. 2003). We compute the inclination angle, , following Tully et al. (1998): , where is the minor-to-major axis ratio at mag arcsec-2 (de Vaucouleurs et al. 1991), or the isophotal axis ratio at mag arcsec-2 (Jarrett et al. 2003); (7-8) Absolute -band magnitude and color, both relative to Vega (Dale et al. 2007; Muñoz-Mateos et al. 2009a) (see §2.1 for more details); (9-11) Distance, distance method, and corresponding reference to the literature. The distance methods have the following meaning: Flow = Hubble distance assuming Mpc-1 corrected for peculiar motions; SBF = surface-brightness fluctuations; BS = bright stars (supergiants); Ceph = Cepheid variables; Mult = an average of multiple, cross-calibrated techniques; TRGB = tip of the red-giant branch; Mem = group/cluster membership; SN = supernova; PNLF = planetary nebula luminosity function.
References. — (1) Masters (2005); (2) Tonry et al. (2001); (3) Sharina et al. (1996); (4) Freedman et al. (2001); (5) Ferrarese et al. (2000b); (6) Tosi et al. (2001); (7) Karachentsev et al. (2003); (8) Macri et al. (2001); (9) Ferrarese et al. (2000a); (10) Jha et al. (2007); (11) Leonard et al. (2002); (12) Mei et al. (2007); (13) Seth et al. (2005); (14) Makarova et al. (1998); (15) Ciardullo et al. (2002); (16) Drozdovsky & Karachentsev (2000); (17) Pietrzyński et al. (2004); (18) Karachentsev et al. (2000).
| Nuclear | Circumnuclear | Radial Strip | |||||||||||||||
|---|---|---|---|---|---|---|---|---|---|---|---|---|---|---|---|---|---|
| Galaxy | ApertureaaSpectrophotometric extraction aperture along and perpendicular to the slit. | bbLong-slit position angle, measured positive from North to East, in degrees. | ccEffective exposure time, as defined in Moustakas & Kennicutt (2006a), in seconds. | PhotddFlag indicating whether the spectra were obtained during photometric (Y) or non-photometric conditions (N). | NoteseeExtraction notes: (1) Extended spatial profile; (2) One or more foreground stars subtracted; (3) Multiple pointings stitched together; (4) Extraction centered on bright H II region; (5) Residual foreground stellar contamination. | ApertureaaSpectrophotometric extraction aperture along and perpendicular to the slit. | bbLong-slit position angle, measured positive from North to East, in degrees. | ccEffective exposure time, as defined in Moustakas & Kennicutt (2006a), in seconds. | PhotddFlag indicating whether the spectra were obtained during photometric (Y) or non-photometric conditions (N). | NoteseeExtraction notes: (1) Extended spatial profile; (2) One or more foreground stars subtracted; (3) Multiple pointings stitched together; (4) Extraction centered on bright H II region; (5) Residual foreground stellar contamination. | ApertureaaSpectrophotometric extraction aperture along and perpendicular to the slit. | bbLong-slit position angle, measured positive from North to East, in degrees. | ccEffective exposure time, as defined in Moustakas & Kennicutt (2006a), in seconds. | PhotddFlag indicating whether the spectra were obtained during photometric (Y) or non-photometric conditions (N). | NoteseeExtraction notes: (1) Extended spatial profile; (2) One or more foreground stars subtracted; (3) Multiple pointings stitched together; (4) Extraction centered on bright H II region; (5) Residual foreground stellar contamination. | ||
| NGC 0024 | 177 | 300 | Y | 46 | 75 | Y | 46 | 109 | Y | ||||||||
| NGC 0337 | 25 | 600 | Y | 1 | 70 | 75 | Y | 70 | 109 | Y | |||||||
| NGC 0584 | 25 | 300 | Y | 70 | 75 | Y | 70 | 109 | Y | ||||||||
| NGC 0628 | 70 | 300 | Y | 70 | 150 | Y | 70 | 109 | Y | 2,3 | |||||||
| NGC 0855 | 70 | 300 | Y | 70 | 75 | Y | 70 | 109 | N | ||||||||
| NGC 0925 | 70 | 300 | Y | 70 | 112 | Y | 70 | 109 | Y | 2,3 | |||||||
| NGC 1097 | 110 | 600 | Y | 110 | 192 | Y | 70 | 192 | Y | ||||||||
| NGC 1266 | 70 | 600 | Y | 70 | 75 | Y | 70 | 109 | Y | ||||||||
| NGC 1291 | 5 | 1200 | N | 5 | 192 | N | 5 | 192 | N | 2 | |||||||
| NGC 1316 | 60 | 1200 | Y | 60 | 192 | Y | 60 | 192 | Y | ||||||||
| NGC 1377 | 0 | 300 | Y | 90 | 75 | Y | 90 | 109 | N | ||||||||
| NGC 1404 | 75 | 1200 | Y | 75 | 192 | Y | 75 | 192 | Y | ||||||||
| NGC 1482 | 110 | 600 | N | 90 | 75 | Y | 110 | 96 | N | ||||||||
| NGC 1512 | 50 | 900 | Y | 50 | 192 | Y | 50 | 192 | Y | ||||||||
| NGC 1566 | 60 | 1200 | Y | 60 | 192 | Y | 60 | 192 | Y | ||||||||
| NGC 1705 | 50 | 1200 | Y | 50 | 192 | Y | 50 | 192 | Y | ||||||||
| NGC 2798 | 103 | 300 | Y | 1 | 103 | 75 | Y | 1 | 103 | 109 | Y | 2,3 | |||||
| NGC 2841 | 90 | 300 | Y | 90 | 75 | Y | 135 | 120 | N | ||||||||
| NGC 2915 | 150 | 1200 | Y | 150 | 192 | Y | 150 | 192 | Y | 2 | |||||||
| NGC 2976 | 153 | 600 | Y | 90 | 150 | Y | 4 | 129 | 80 | Y | |||||||
| NGC 3049 | 111 | 300 | Y | 111 | 75 | Y | 115 | 105 | N | ||||||||
| NGC 3031 | 75 | 300 | Y | 90 | 75 | Y | 157 | 80 | Y | ||||||||
| NGC 3190 | 115 | 300 | Y | 115 | 75 | Y | 115 | 109 | Y | ||||||||
| NGC 3184 | 0 | 300 | Y | 124 | 75 | Y | 124 | 109 | Y | ||||||||
| NGC 3198 | 90 | 600 | Y | 4 | 120 | 75 | Y | 1 | 120 | 109 | Y | ||||||
| NGC 3265 | 120 | 300 | Y | 120 | 75 | Y | 120 | 109 | Y | ||||||||
| Mrk 33 | 59 | 300 | Y | 110 | 75 | Y | 110 | 109 | Y | ||||||||
| NGC 3351 | 134 | 300 | Y | 110 | 192 | N | 115 | 109 | Y | ||||||||
| NGC 3521 | 110 | 1200 | Y | 110 | 96 | Y | 110 | 192 | Y | ||||||||
| NGC 3621 | 150 | 1200 | Y | 150 | 192 | Y | 140 | 192 | Y | ||||||||
| NGC 3627 | 115 | 300 | Y | 115 | 75 | Y | 115 | 109 | Y | ||||||||
| NGC 3773 | 115 | 300 | Y | 115 | 75 | Y | 115 | 109 | Y | ||||||||
| NGC 3938 | 81 | 300 | Y | 90 | 75 | Y | 133 | 80 | N | ||||||||
| NGC 4125 | 13 | 300 | Y | 90 | 75 | Y | 90 | 80 | N | ||||||||
| NGC 4254 | 120 | 300 | Y | 120 | 75 | Y | 120 | 109 | Y | 2 | |||||||
| NGC 4321 | 60 | 300 | Y | 120 | 75 | Y | 121 | 80 | Y | ||||||||
| NGC 4450 | 120 | 300 | Y | 120 | 75 | Y | 120 | 109 | Y | ||||||||
| NGC 4536 | 168 | 600 | Y | 115 | 75 | Y | 115 | 109 | Y | ||||||||
| NGC 4552 | 120 | 300 | Y | 120 | 75 | Y | 120 | 109 | Y | 2 | |||||||
| NGC 4559 | 90 | 300 | Y | 90 | 75 | Y | 135 | 109 | Y | ||||||||
| NGC 4569 | 120 | 300 | Y | 120 | 75 | Y | 120 | 109 | Y | ||||||||
| NGC 4579 | 90 | 300 | Y | 90 | 75 | Y | 120 | 109 | Y | ||||||||
| NGC 4594 | 20 | 300 | Y | 113 | 75 | Y | 113 | 163 | N | ||||||||
| NGC 4625 | 90 | 300 | Y | 90 | 75 | Y | 143 | 80 | Y | 2,3 | |||||||
| NGC 4725 | 70 | 600 | N | 120 | 75 | N | 120 | 109 | N | ||||||||
| NGC 4736 | 82 | 300 | Y | 90 | 75 | Y | 118 | 80 | N | ||||||||
| NGC 4826 | 60 | 300 | Y | 120 | 75 | Y | 120 | 109 | Y | ||||||||
| NGC 5033 | 77 | 600 | Y | 90 | 75 | Y | 150 | 80 | Y | ||||||||
| NGC 5055 | 90 | 300 | Y | 90 | 75 | Y | 120 | 80 | N | ||||||||
| NGC 5194 | 90 | 300 | Y | 90 | 75 | Y | 158 | 80 | Y | 2,3 | |||||||
| NGC 5195 | 90 | 300 | Y | 90 | 75 | Y | 118 | 80 | N | ||||||||
| NGC 5713 | 150 | 300 | Y | 115 | 225 | Y | 113 | 109 | Y | ||||||||
| NGC 5866 | 120 | 600 | Y | 120 | 75 | Y | 120 | 109 | Y | ||||||||
| NGC 6946 | 140 | 300 | Y | 90 | 75 | Y | 37 | 80 | Y | ||||||||
| NGC 7331 | 90 | 300 | Y | 90 | 75 | Y | 90 | 109 | Y | ||||||||
| NGC 7793 | 80 | 1200 | Y | 80 | 192 | Y | 80 | 192 | Y | 5 | |||||||
Note. — Summary of our nuclear, circumnuclear, and radial-strip observations of the SINGS galaxies.
| Galaxy | [O ii] | H | H | [O iii] | H | [N ii] | [S ii] | [S ii] |
|---|---|---|---|---|---|---|---|---|
| Nuclear | ||||||||
| NGC 0024 | ||||||||
| NGC 0337 | ||||||||
| NGC 0584 | ||||||||
| NGC 0628 | ||||||||
| NGC 0855 | ||||||||
| NGC 0925 | ||||||||
| NGC 1097 | ||||||||
| NGC 1266 | ||||||||
| NGC 1291 | ||||||||
| NGC 1316 | ||||||||
| NGC 1377 | ||||||||
| NGC 1404 | ||||||||
| NGC 1482 | ||||||||
| NGC 1512 | ||||||||
| NGC 1566 | ||||||||
| NGC 1705 | ||||||||
| NGC 2798 | ||||||||
| NGC 2841 | ||||||||
| NGC 2915 | ||||||||
| NGC 2976 | ||||||||
| NGC 3049 | ||||||||
| NGC 3031 | ||||||||
| NGC 3034 | ||||||||
| NGC 3190 | ||||||||
| NGC 3184 | ||||||||
| NGC 3198 | ||||||||
| NGC 3265 | ||||||||
| Mrk 33 | ||||||||
| NGC 3351 | ||||||||
| NGC 3521 | ||||||||
| NGC 3621 | ||||||||
| NGC 3627 | ||||||||
| NGC 3773 | ||||||||
| NGC 3938 | ||||||||
| NGC 4125 | ||||||||
| NGC 4254 | ||||||||
| NGC 4321 | ||||||||
| NGC 4450 | ||||||||
| NGC 4536 | ||||||||
| NGC 4552 | ||||||||
| NGC 4559 | ||||||||
| NGC 4569 | ||||||||
| NGC 4579 | ||||||||
| NGC 4594 | ||||||||
| NGC 4625 | ||||||||
| NGC 4725 | ||||||||
| NGC 4736 | ||||||||
| NGC 4826 | ||||||||
| NGC 5033 | ||||||||
| NGC 5055 | ||||||||
| NGC 5194 | ||||||||
| NGC 5195 | ||||||||
| NGC 5713 | ||||||||
| NGC 5866 | ||||||||
| NGC 6946 | ||||||||
| NGC 7331 | ||||||||
| NGC 7793 | ||||||||
| Circumnuclear | ||||||||
| NGC 0024 | ||||||||
| NGC 0337 | ||||||||
| NGC 0584 | ||||||||
| NGC 0628 | ||||||||
| NGC 0855 | ||||||||
| NGC 0925 | ||||||||
| NGC 1097 | ||||||||
| NGC 1266 | ||||||||
| NGC 1291 | ||||||||
| NGC 1316 | ||||||||
| NGC 1377 | ||||||||
| NGC 1404 | ||||||||
| NGC 1482 | ||||||||
| NGC 1512 | ||||||||
| NGC 1566 | ||||||||
| NGC 1705 | ||||||||
| NGC 2403 | ||||||||
| DDO 053 | ||||||||
| NGC 2798 | ||||||||
| NGC 2841 | ||||||||
| NGC 2915 | ||||||||
| NGC 2976 | ||||||||
| NGC 3049 | ||||||||
| NGC 3031 | ||||||||
| NGC 3034 | ||||||||
| M 81 Dw B | ||||||||
| NGC 3190 | ||||||||
| NGC 3184 | ||||||||
| NGC 3198 | ||||||||
| IC 2574 | ||||||||
| NGC 3265 | ||||||||
| Mrk 33 | ||||||||
| NGC 3351 | ||||||||
| NGC 3521 | ||||||||
| NGC 3621 | ||||||||
| NGC 3627 | ||||||||
| NGC 3773 | ||||||||
| NGC 3938 | ||||||||
| NGC 4125 | ||||||||
| NGC 4236 | ||||||||
| NGC 4254 | ||||||||
| NGC 4321 | ||||||||
| NGC 4450 | ||||||||
| NGC 4536 | ||||||||
| NGC 4552 | ||||||||
| NGC 4559 | ||||||||
| NGC 4569 | ||||||||
| NGC 4579 | ||||||||
| NGC 4594 | ||||||||
| NGC 4625 | ||||||||
| NGC 4631 | ||||||||
| NGC 4725 | ||||||||
| NGC 4736 | ||||||||
| NGC 4826 | ||||||||
| NGC 5033 | ||||||||
| NGC 5055 | ||||||||
| NGC 5194 | ||||||||
| NGC 5195 | ||||||||
| Tol 89 | ||||||||
| NGC 5474 | ||||||||
| NGC 5713 | ||||||||
| NGC 5866 | ||||||||
| NGC 6946 | ||||||||
| NGC 7331 | ||||||||
| NGC 7793 | ||||||||
| Radial Strip | ||||||||
| NGC 0024 | ||||||||
| NGC 0337 | ||||||||
| NGC 0584 | ||||||||
| NGC 0628 | ||||||||
| NGC 0855 | ||||||||
| NGC 0925 | ||||||||
| NGC 1097 | ||||||||
| NGC 1266 | ||||||||
| NGC 1291 | ||||||||
| NGC 1316 | ||||||||
| NGC 1377 | ||||||||
| NGC 1404 | ||||||||
| NGC 1482 | ||||||||
| NGC 1512 | ||||||||
| NGC 1566 | ||||||||
| NGC 1705 | ||||||||
| NGC 2403 | ||||||||
| DDO 053 | ||||||||
| NGC 2798 | ||||||||
| NGC 2841 | ||||||||
| NGC 2915 | ||||||||
| NGC 2976 | ||||||||
| NGC 3049 | ||||||||
| NGC 3031 | ||||||||
| M 81 Dw B | ||||||||
| NGC 3190 | ||||||||
| NGC 3184 | ||||||||
| NGC 3198 | ||||||||
| NGC 3265 | ||||||||
| Mrk 33 | ||||||||
| NGC 3351 | ||||||||
| NGC 3521 | ||||||||
| NGC 3621 | ||||||||
| NGC 3627 | ||||||||
| NGC 3773 | ||||||||
| NGC 3938 | ||||||||
| NGC 4125 | ||||||||
| NGC 4254 | ||||||||
| NGC 4321 | ||||||||
| NGC 4450 | ||||||||
| NGC 4536 | ||||||||
| NGC 4552 | ||||||||
| NGC 4559 | ||||||||
| NGC 4569 | ||||||||
| NGC 4579 | ||||||||
| NGC 4594 | ||||||||
| NGC 4625 | ||||||||
| NGC 4631 | ||||||||
| NGC 4725 | ||||||||
| NGC 4736 | ||||||||
| NGC 4826 | ||||||||
| NGC 5033 | ||||||||
| NGC 5055 | ||||||||
| NGC 5194 | ||||||||
| NGC 5195 | ||||||||
| Tol 89 | ||||||||
| NGC 5474 | ||||||||
| NGC 5713 | ||||||||
| NGC 5866 | ||||||||
| NGC 6946 | ||||||||
| NGC 7331 | ||||||||
| NGC 7793 | ||||||||
Note. — Optical emission-line fluxes in units of erg s-1 cm-2, corrected for foreground Galactic extinction (; O’Donnell 1994; Schlegel et al. 1998). Note that the uncertainties include only statistical measurement uncertainties, and do not include systematic errors due to, for example, imperfect continuum subtraction. For most applications we recommend that a minimum signal-to-noise ratio cut be applied to the fluxes listed in this table.
| Galaxy | [O ii] | H | H | [O iii] | H | [N ii] | [S ii] | [S ii] |
|---|---|---|---|---|---|---|---|---|
| Nuclear | ||||||||
| NGC 0024 | ||||||||
| NGC 0337 | ||||||||
| NGC 0584 | ||||||||
| NGC 0628 | ||||||||
| NGC 0855 | ||||||||
| NGC 0925 | ||||||||
| NGC 1097 | ||||||||
| NGC 1266 | ||||||||
| NGC 1291 | ||||||||
| NGC 1316 | ||||||||
| NGC 1377 | ||||||||
| NGC 1404 | ||||||||
| NGC 1482 | ||||||||
| NGC 1512 | ||||||||
| NGC 1566 | ||||||||
| NGC 1705 | ||||||||
| NGC 2798 | ||||||||
| NGC 2841 | ||||||||
| NGC 2915 | ||||||||
| NGC 2976 | ||||||||
| NGC 3049 | ||||||||
| NGC 3031 | ||||||||
| NGC 3034 | ||||||||
| NGC 3190 | ||||||||
| NGC 3184 | ||||||||
| NGC 3198 | ||||||||
| NGC 3265 | ||||||||
| Mrk 33 | ||||||||
| NGC 3351 | ||||||||
| NGC 3521 | ||||||||
| NGC 3621 | ||||||||
| NGC 3627 | ||||||||
| NGC 3773 | ||||||||
| NGC 3938 | ||||||||
| NGC 4125 | ||||||||
| NGC 4254 | ||||||||
| NGC 4321 | ||||||||
| NGC 4450 | ||||||||
| NGC 4536 | ||||||||
| NGC 4552 | ||||||||
| NGC 4559 | ||||||||
| NGC 4569 | ||||||||
| NGC 4579 | ||||||||
| NGC 4594 | ||||||||
| NGC 4625 | ||||||||
| NGC 4725 | ||||||||
| NGC 4736 | ||||||||
| NGC 4826 | ||||||||
| NGC 5033 | ||||||||
| NGC 5055 | ||||||||
| NGC 5194 | ||||||||
| NGC 5195 | ||||||||
| NGC 5713 | ||||||||
| NGC 5866 | ||||||||
| NGC 6946 | ||||||||
| NGC 7331 | ||||||||
| NGC 7793 | ||||||||
| Circumnuclear | ||||||||
| NGC 0024 | ||||||||
| NGC 0337 | ||||||||
| NGC 0584 | ||||||||
| NGC 0628 | ||||||||
| NGC 0855 | ||||||||
| NGC 0925 | ||||||||
| NGC 1097 | ||||||||
| NGC 1266 | ||||||||
| NGC 1291 | ||||||||
| NGC 1316 | ||||||||
| NGC 1377 | ||||||||
| NGC 1404 | ||||||||
| NGC 1482 | ||||||||
| NGC 1512 | ||||||||
| NGC 1566 | ||||||||
| NGC 1705 | ||||||||
| NGC 2403 | ||||||||
| DDO 053 | ||||||||
| NGC 2798 | ||||||||
| NGC 2841 | ||||||||
| NGC 2915 | ||||||||
| NGC 2976 | ||||||||
| NGC 3049 | ||||||||
| NGC 3031 | ||||||||
| NGC 3034 | ||||||||
| M 81 Dw B | ||||||||
| NGC 3190 | ||||||||
| NGC 3184 | ||||||||
| NGC 3198 | ||||||||
| IC 2574 | ||||||||
| NGC 3265 | ||||||||
| Mrk 33 | ||||||||
| NGC 3351 | ||||||||
| NGC 3521 | ||||||||
| NGC 3621 | ||||||||
| NGC 3627 | ||||||||
| NGC 3773 | ||||||||
| NGC 3938 | ||||||||
| NGC 4125 | ||||||||
| NGC 4236 | ||||||||
| NGC 4254 | ||||||||
| NGC 4321 | ||||||||
| NGC 4450 | ||||||||
| NGC 4536 | ||||||||
| NGC 4552 | ||||||||
| NGC 4559 | ||||||||
| NGC 4569 | ||||||||
| NGC 4579 | ||||||||
| NGC 4594 | ||||||||
| NGC 4625 | ||||||||
| NGC 4631 | ||||||||
| NGC 4725 | ||||||||
| NGC 4736 | ||||||||
| NGC 4826 | ||||||||
| NGC 5033 | ||||||||
| NGC 5055 | ||||||||
| NGC 5194 | ||||||||
| NGC 5195 | ||||||||
| Tol 89 | ||||||||
| NGC 5474 | ||||||||
| NGC 5713 | ||||||||
| NGC 5866 | ||||||||
| NGC 6946 | ||||||||
| NGC 7331 | ||||||||
| NGC 7793 | ||||||||
| Radial Strip | ||||||||
| NGC 0024 | ||||||||
| NGC 0337 | ||||||||
| NGC 0584 | ||||||||
| NGC 0628 | ||||||||
| NGC 0855 | ||||||||
| NGC 0925 | ||||||||
| NGC 1097 | ||||||||
| NGC 1266 | ||||||||
| NGC 1291 | ||||||||
| NGC 1316 | ||||||||
| NGC 1377 | ||||||||
| NGC 1404 | ||||||||
| NGC 1482 | ||||||||
| NGC 1512 | ||||||||
| NGC 1566 | ||||||||
| NGC 1705 | ||||||||
| NGC 2403 | ||||||||
| DDO 053 | ||||||||
| NGC 2798 | ||||||||
| NGC 2841 | ||||||||
| NGC 2915 | ||||||||
| NGC 2976 | ||||||||
| NGC 3049 | ||||||||
| NGC 3031 | ||||||||
| M 81 Dw B | ||||||||
| NGC 3190 | ||||||||
| NGC 3184 | ||||||||
| NGC 3198 | ||||||||
| NGC 3265 | ||||||||
| Mrk 33 | ||||||||
| NGC 3351 | ||||||||
| NGC 3521 | ||||||||
| NGC 3621 | ||||||||
| NGC 3627 | ||||||||
| NGC 3773 | ||||||||
| NGC 3938 | ||||||||
| NGC 4125 | ||||||||
| NGC 4254 | ||||||||
| NGC 4321 | ||||||||
| NGC 4450 | ||||||||
| NGC 4536 | ||||||||
| NGC 4552 | ||||||||
| NGC 4559 | ||||||||
| NGC 4569 | ||||||||
| NGC 4579 | ||||||||
| NGC 4594 | ||||||||
| NGC 4625 | ||||||||
| NGC 4631 | ||||||||
| NGC 4725 | ||||||||
| NGC 4736 | ||||||||
| NGC 4826 | ||||||||
| NGC 5033 | ||||||||
| NGC 5055 | ||||||||
| NGC 5194 | ||||||||
| NGC 5195 | ||||||||
| Tol 89 | ||||||||
| NGC 5474 | ||||||||
| NGC 5713 | ||||||||
| NGC 5866 | ||||||||
| NGC 6946 | ||||||||
| NGC 7331 | ||||||||
| NGC 7793 | ||||||||
Note. — Rest-frame emission-line equivalent widths in Å. Note that the uncertainties include only statistical measurement uncertainties; they do not include systematic errors due to, for example, imperfect continuum subtraction. For most applications we recommend that a minimum signal-to-noise ratio cut be applied to the EWs listed in this table.
| Galaxy | Nuclear | Circumnuclear | Radial Strip | Ho97 | Adopted |
|---|---|---|---|---|---|
| (1) | (2) | (3) | (4) | (5) | (6) |
| NGC 0024 | SF | SF | SF | SF | |
| NGC 0337 | SF | SF | SF | SF | |
| NGC 0584 | ? | ? | ? | AGNaaThe lower limit on the nuclear [N ii]/H ratio for NGC 0584 suggests that it hosts a weak AGN. | |
| NGC 0628 | ? | SF | SFbbThese spectra were classified as SF or AGN on the basis of the [N ii]/H ratio alone because of an unconstrained [O iii]/H ratio, where we adopt as the boundary between the two classes. | SF | |
| NGC 0855 | SF | SF | SF | SF | |
| NGC 0925 | SF | SF | SF | SF | SF |
| NGC 1097 | AGN | SF | SFeeThe radial strip spectra of NGC 1097, NGC 1482, and NGC 1512 formally yield a SF/AGN classification; however, the more physically realistic SF classification is consistent with the errors in the emission-line ratios, and with the uncertainty in the classification method. For the same reasons we have changed the circumnuclear classifications of NGC 2403 and NGC 3198 from SF/AGN to SF. | AGN | |
| NGC 1266 | AGNbbThese spectra were classified as SF or AGN on the basis of the [N ii]/H ratio alone because of an unconstrained [O iii]/H ratio, where we adopt as the boundary between the two classes. | AGNbbThese spectra were classified as SF or AGN on the basis of the [N ii]/H ratio alone because of an unconstrained [O iii]/H ratio, where we adopt as the boundary between the two classes. | AGNbbThese spectra were classified as SF or AGN on the basis of the [N ii]/H ratio alone because of an unconstrained [O iii]/H ratio, where we adopt as the boundary between the two classes. | AGN | |
| NGC 1291 | AGNbbThese spectra were classified as SF or AGN on the basis of the [N ii]/H ratio alone because of an unconstrained [O iii]/H ratio, where we adopt as the boundary between the two classes. | AGNbbThese spectra were classified as SF or AGN on the basis of the [N ii]/H ratio alone because of an unconstrained [O iii]/H ratio, where we adopt as the boundary between the two classes. | ? | AGN | |
| NGC 1316 | AGNbbThese spectra were classified as SF or AGN on the basis of the [N ii]/H ratio alone because of an unconstrained [O iii]/H ratio, where we adopt as the boundary between the two classes. | AGNbbThese spectra were classified as SF or AGN on the basis of the [N ii]/H ratio alone because of an unconstrained [O iii]/H ratio, where we adopt as the boundary between the two classes. | ? | AGN | |
| NGC 1377 | ? | SFbbThese spectra were classified as SF or AGN on the basis of the [N ii]/H ratio alone because of an unconstrained [O iii]/H ratio, where we adopt as the boundary between the two classes.ccNGC 1377 is a “nascent starburst” with a highly dust-obscured nucleus and AGN-like emission-line ratios (Roussel et al. 2006); therefore, although the formal classification based on our circumnuclear spectrum is an AGN, we have changed it to SF. | ? | SF | |
| NGC 1404 | ? | ? | ? | AGNddTajer et al. (2005) report an X-ray luminosity for NGC 1404 of erg s-1, suggesting the presence of a weak AGN in this elliptical galaxy. | |
| NGC 1482 | SF | SF | SFeeThe radial strip spectra of NGC 1097, NGC 1482, and NGC 1512 formally yield a SF/AGN classification; however, the more physically realistic SF classification is consistent with the errors in the emission-line ratios, and with the uncertainty in the classification method. For the same reasons we have changed the circumnuclear classifications of NGC 2403 and NGC 3198 from SF/AGN to SF. | SF | |
| NGC 1512 | AGNbbThese spectra were classified as SF or AGN on the basis of the [N ii]/H ratio alone because of an unconstrained [O iii]/H ratio, where we adopt as the boundary between the two classes. | SF | SFeeThe radial strip spectra of NGC 1097, NGC 1482, and NGC 1512 formally yield a SF/AGN classification; however, the more physically realistic SF classification is consistent with the errors in the emission-line ratios, and with the uncertainty in the classification method. For the same reasons we have changed the circumnuclear classifications of NGC 2403 and NGC 3198 from SF/AGN to SF. | AGN | |
| NGC 1566 | AGN | AGNbbThese spectra were classified as SF or AGN on the basis of the [N ii]/H ratio alone because of an unconstrained [O iii]/H ratio, where we adopt as the boundary between the two classes. | AGNbbThese spectra were classified as SF or AGN on the basis of the [N ii]/H ratio alone because of an unconstrained [O iii]/H ratio, where we adopt as the boundary between the two classes. | AGNffOne or more spectra of these objects exhibits broad Balmer emission lines. | |
| NGC 1705 | ? | SF | SF | SF | |
| NGC 2403 | SFeeThe radial strip spectra of NGC 1097, NGC 1482, and NGC 1512 formally yield a SF/AGN classification; however, the more physically realistic SF classification is consistent with the errors in the emission-line ratios, and with the uncertainty in the classification method. For the same reasons we have changed the circumnuclear classifications of NGC 2403 and NGC 3198 from SF/AGN to SF. | SF | SF | SF | |
| Ho II | SFggHo II, M 81 Dw A, DDO 053, Ho I, Ho IX, M 81 DwB, DDO 154, DDO 165, NGC 5408, IC 4710, and NGC 6822 are clearly star-forming galaxies; they are diffuse, low-luminosity ( mag) galaxies with no well-defined bulge or nucleus. | ||||
| M 81 Dw A | SFggHo II, M 81 Dw A, DDO 053, Ho I, Ho IX, M 81 DwB, DDO 154, DDO 165, NGC 5408, IC 4710, and NGC 6822 are clearly star-forming galaxies; they are diffuse, low-luminosity ( mag) galaxies with no well-defined bulge or nucleus. | ||||
| DDO 053 | ? | ? | SFggHo II, M 81 Dw A, DDO 053, Ho I, Ho IX, M 81 DwB, DDO 154, DDO 165, NGC 5408, IC 4710, and NGC 6822 are clearly star-forming galaxies; they are diffuse, low-luminosity ( mag) galaxies with no well-defined bulge or nucleus. | ||
| NGC 2798 | SF/AGN | SF/AGN | SF/AGN | SF/AGN | |
| NGC 2841 | AGN | ? | SF/AGN | AGN | AGN |
| NGC 2915 | SF | SF | SF | SF | |
| Ho I | SFggHo II, M 81 Dw A, DDO 053, Ho I, Ho IX, M 81 DwB, DDO 154, DDO 165, NGC 5408, IC 4710, and NGC 6822 are clearly star-forming galaxies; they are diffuse, low-luminosity ( mag) galaxies with no well-defined bulge or nucleus. | ||||
| NGC 2976 | SF | SF | SF | SF/AGN | SF |
| NGC 3049 | SF | SF | SF | SF | |
| NGC 3031 | AGNbbThese spectra were classified as SF or AGN on the basis of the [N ii]/H ratio alone because of an unconstrained [O iii]/H ratio, where we adopt as the boundary between the two classes. | AGNbbThese spectra were classified as SF or AGN on the basis of the [N ii]/H ratio alone because of an unconstrained [O iii]/H ratio, where we adopt as the boundary between the two classes. | ? | AGN | AGNffOne or more spectra of these objects exhibits broad Balmer emission lines. |
| NGC 3034 | SFhhOur nuclear and circumnuclear spectra of the starburst galaxy NGC 3034=M 82 exhibit enhanced [N ii]/H ratios, likely from shock-ionized gas, resulting in AGN-like spectral classifications; therefore, we have changed these classifications to SF, although we note that recent evidence suggests that M 82 may host a low-luminosity AGN (Matsumoto et al. 2001). | SFhhOur nuclear and circumnuclear spectra of the starburst galaxy NGC 3034=M 82 exhibit enhanced [N ii]/H ratios, likely from shock-ionized gas, resulting in AGN-like spectral classifications; therefore, we have changed these classifications to SF, although we note that recent evidence suggests that M 82 may host a low-luminosity AGN (Matsumoto et al. 2001). | SF/AGN | SF | |
| Ho IX | SFggHo II, M 81 Dw A, DDO 053, Ho I, Ho IX, M 81 DwB, DDO 154, DDO 165, NGC 5408, IC 4710, and NGC 6822 are clearly star-forming galaxies; they are diffuse, low-luminosity ( mag) galaxies with no well-defined bulge or nucleus. | ||||
| M 81 Dw B | ? | ? | SFggHo II, M 81 Dw A, DDO 053, Ho I, Ho IX, M 81 DwB, DDO 154, DDO 165, NGC 5408, IC 4710, and NGC 6822 are clearly star-forming galaxies; they are diffuse, low-luminosity ( mag) galaxies with no well-defined bulge or nucleus. | ||
| NGC 3190 | ? | ? | ? | AGN | AGN |
| NGC 3184 | SF | SF | SF | SF | SF |
| NGC 3198 | SF | SFeeThe radial strip spectra of NGC 1097, NGC 1482, and NGC 1512 formally yield a SF/AGN classification; however, the more physically realistic SF classification is consistent with the errors in the emission-line ratios, and with the uncertainty in the classification method. For the same reasons we have changed the circumnuclear classifications of NGC 2403 and NGC 3198 from SF/AGN to SF. | SF | SF | SF |
| IC 2574 | ? | SF | SF | ||
| NGC 3265 | SF | SF | SF | SF | |
| Mrk 33 | SF | SF | SF | SF | |
| NGC 3351 | SF | SF | SF | SF/AGN | SF |
| NGC 3521 | ? | AGNbbThese spectra were classified as SF or AGN on the basis of the [N ii]/H ratio alone because of an unconstrained [O iii]/H ratio, where we adopt as the boundary between the two classes. | SF | AGN | AGN |
| NGC 3621 | AGN | SF/AGN | SF | AGN | |
| NGC 3627 | AGNbbThese spectra were classified as SF or AGN on the basis of the [N ii]/H ratio alone because of an unconstrained [O iii]/H ratio, where we adopt as the boundary between the two classes. | AGNbbThese spectra were classified as SF or AGN on the basis of the [N ii]/H ratio alone because of an unconstrained [O iii]/H ratio, where we adopt as the boundary between the two classes. | SF/AGN | AGN | AGN |
| NGC 3773 | SF | SF | SF | SF | |
| NGC 3938 | ? | SF | ? | AGN | AGN |
| NGC 4125 | AGNbbThese spectra were classified as SF or AGN on the basis of the [N ii]/H ratio alone because of an unconstrained [O iii]/H ratio, where we adopt as the boundary between the two classes. | ? | ? | AGN | AGN |
| NGC 4236 | ? | SF | SF | ||
| NGC 4254 | SF/AGN | SF | SF | SF/AGN | SF/AGN |
| NGC 4321 | AGN | SF | SF | AGN | AGN |
| NGC 4450 | AGN | AGN | AGN | AGN | AGN |
| NGC 4536 | SF/AGN | SF | SF | SF/AGN | SF/AGN |
| NGC 4552 | ? | ? | ? | AGN | AGN |
| NGC 4559 | SFbbThese spectra were classified as SF or AGN on the basis of the [N ii]/H ratio alone because of an unconstrained [O iii]/H ratio, where we adopt as the boundary between the two classes. | SF | SF | SF | SF |
| NGC 4569 | AGN | AGN | AGN | AGN | AGN |
| NGC 4579 | AGN | ? | AGN | AGN | AGNffOne or more spectra of these objects exhibits broad Balmer emission lines. |
| NGC 4594 | AGN | ? | ? | AGN | AGNffOne or more spectra of these objects exhibits broad Balmer emission lines. |
| NGC 4625 | SFbbThese spectra were classified as SF or AGN on the basis of the [N ii]/H ratio alone because of an unconstrained [O iii]/H ratio, where we adopt as the boundary between the two classes. | SF | SF | SF | |
| NGC 4631 | SF | SF | SF | SF | |
| NGC 4725 | AGNbbThese spectra were classified as SF or AGN on the basis of the [N ii]/H ratio alone because of an unconstrained [O iii]/H ratio, where we adopt as the boundary between the two classes. | ? | ? | AGN | AGN |
| NGC 4736 | ? | ? | SF/AGN | AGN | AGN |
| DDO 154 | SFggHo II, M 81 Dw A, DDO 053, Ho I, Ho IX, M 81 DwB, DDO 154, DDO 165, NGC 5408, IC 4710, and NGC 6822 are clearly star-forming galaxies; they are diffuse, low-luminosity ( mag) galaxies with no well-defined bulge or nucleus. | ||||
| NGC 4826 | AGN | SF/AGN | SF/AGN | AGN | AGN |
| DDO 165 | SFggHo II, M 81 Dw A, DDO 053, Ho I, Ho IX, M 81 DwB, DDO 154, DDO 165, NGC 5408, IC 4710, and NGC 6822 are clearly star-forming galaxies; they are diffuse, low-luminosity ( mag) galaxies with no well-defined bulge or nucleus. | ||||
| NGC 5033 | AGN | AGN | SF/AGN | AGN | AGNffOne or more spectra of these objects exhibits broad Balmer emission lines. |
| NGC 5055 | AGNbbThese spectra were classified as SF or AGN on the basis of the [N ii]/H ratio alone because of an unconstrained [O iii]/H ratio, where we adopt as the boundary between the two classes. | AGN | SFbbThese spectra were classified as SF or AGN on the basis of the [N ii]/H ratio alone because of an unconstrained [O iii]/H ratio, where we adopt as the boundary between the two classes. | AGN | AGN |
| NGC 5194 | AGN | AGN | SF/AGN | AGN | |
| NGC 5195 | AGNbbThese spectra were classified as SF or AGN on the basis of the [N ii]/H ratio alone because of an unconstrained [O iii]/H ratio, where we adopt as the boundary between the two classes. | AGNbbThese spectra were classified as SF or AGN on the basis of the [N ii]/H ratio alone because of an unconstrained [O iii]/H ratio, where we adopt as the boundary between the two classes. | AGNbbThese spectra were classified as SF or AGN on the basis of the [N ii]/H ratio alone because of an unconstrained [O iii]/H ratio, where we adopt as the boundary between the two classes. | AGN | |
| Tol 89 | SF | SF | SF | ||
| NGC 5408 | SFggHo II, M 81 Dw A, DDO 053, Ho I, Ho IX, M 81 DwB, DDO 154, DDO 165, NGC 5408, IC 4710, and NGC 6822 are clearly star-forming galaxies; they are diffuse, low-luminosity ( mag) galaxies with no well-defined bulge or nucleus. | ||||
| NGC 5474 | SF/AGN | SF | SF | SF/AGN | |
| NGC 5713 | SF | SF | SF | SF | |
| NGC 5866 | AGNbbThese spectra were classified as SF or AGN on the basis of the [N ii]/H ratio alone because of an unconstrained [O iii]/H ratio, where we adopt as the boundary between the two classes. | AGNbbThese spectra were classified as SF or AGN on the basis of the [N ii]/H ratio alone because of an unconstrained [O iii]/H ratio, where we adopt as the boundary between the two classes. | ? | AGN | AGN |
| IC 4710 | SFggHo II, M 81 Dw A, DDO 053, Ho I, Ho IX, M 81 DwB, DDO 154, DDO 165, NGC 5408, IC 4710, and NGC 6822 are clearly star-forming galaxies; they are diffuse, low-luminosity ( mag) galaxies with no well-defined bulge or nucleus. | ||||
| NGC 6822 | SFggHo II, M 81 Dw A, DDO 053, Ho I, Ho IX, M 81 DwB, DDO 154, DDO 165, NGC 5408, IC 4710, and NGC 6822 are clearly star-forming galaxies; they are diffuse, low-luminosity ( mag) galaxies with no well-defined bulge or nucleus. | ||||
| NGC 6946 | SFiiNGC 6946 is undergoing a powerful nuclear starburst, resulting in a shock-enhanced [N ii]/H ratio in our nuclear and circumnuclear spectra; therefore, the formal SF/AGN classifications indicated by these two spectra have been changed to SF. | SFiiNGC 6946 is undergoing a powerful nuclear starburst, resulting in a shock-enhanced [N ii]/H ratio in our nuclear and circumnuclear spectra; therefore, the formal SF/AGN classifications indicated by these two spectra have been changed to SF. | SFbbThese spectra were classified as SF or AGN on the basis of the [N ii]/H ratio alone because of an unconstrained [O iii]/H ratio, where we adopt as the boundary between the two classes. | SF/AGN | SF |
| NGC 7331 | AGNbbThese spectra were classified as SF or AGN on the basis of the [N ii]/H ratio alone because of an unconstrained [O iii]/H ratio, where we adopt as the boundary between the two classes. | AGNbbThese spectra were classified as SF or AGN on the basis of the [N ii]/H ratio alone because of an unconstrained [O iii]/H ratio, where we adopt as the boundary between the two classes. | SF/AGN | AGN | AGN |
| NGC 7552 | SFjjWe classify NGC 7552 as SF using the nuclear emission-line flux ratios published by Kewley et al. (2001b), although Durret & Bergeron (1988) argue that this object may host a weak AGN. | ||||
| NGC 7793 | SF | SF | SF | SF |
Note. — Optical spectral classifications based on our nuclear, circumnuclear, and radial-strip spectra and the [N ii]/H vs. [O iii]/H emission-line diagnostic diagram (see Fig. 4). For comparison we also tabulate the classifications based on the Ho et al. (1997, hereafter Ho97) nuclear spectra. Ellipses indicate no data are available, while a question mark indicates that one or more emission line failed our requirement (see §3). We list the final, adopted classification for each galaxy, usually based on the nuclear or circumnuclear spectrum, in the last column. See §3 for additional details.
| Nuclear | Circumnuclear | Radial Strip | ||||||
|---|---|---|---|---|---|---|---|---|
| Galaxy | H/H | H/H | H/H | |||||
| NGC 0024 | ||||||||
| NGC 0337 | ||||||||
| NGC 0855 | ||||||||
| NGC 0925 | ||||||||
| NGC 1097 | ||||||||
| NGC 1482 | ||||||||
| NGC 1512 | ||||||||
| NGC 1705 | ||||||||
| NGC 2403 | ||||||||
| DDO 053 | ||||||||
| NGC 2798 | ||||||||
| NGC 2841 | ||||||||
| NGC 2915 | ||||||||
| NGC 2976 | ||||||||
| NGC 3049 | ||||||||
| NGC 3034 | ||||||||
| M 81 Dw B | ||||||||
| NGC 3184 | ||||||||
| NGC 3198 | ||||||||
| IC 2574 | ||||||||
| NGC 3265 | ||||||||
| Mrk 33 | ||||||||
| NGC 3351 | ||||||||
| NGC 3521 | ||||||||
| NGC 3621 | ||||||||
| NGC 3627 | ||||||||
| NGC 3773 | ||||||||
| NGC 4254 | ||||||||
| NGC 4321 | ||||||||
| NGC 4536 | ||||||||
| NGC 4559 | ||||||||
| NGC 4625 | ||||||||
| NGC 4631 | ||||||||
| NGC 4736 | ||||||||
| NGC 4826 | ||||||||
| NGC 5033 | ||||||||
| NGC 5194 | ||||||||
| Tol 89 | ||||||||
| NGC 5474 | ||||||||
| NGC 5713 | ||||||||
| NGC 7331 | ||||||||
| NGC 7793 | ||||||||
Note. — Balmer decrement, H/H, and corresponding color excess, , in magnitudes, asuming the O’Donnell (1994) Milky Way extinction curve and an intrinsic (unreddened) decrement of . Note that the tabulated uncertainties only include the statistical measurement errors of the emission lines and the uncertainty in the adopted intrinsic Balmer decrement; they do not include possible systematic errors arising from, for example, a breakdown of our assumption of a foreground dust screen geometry (e.g., Witt & Gordon 2000, but see Kennicutt et al. 2009).
| Galaxy | Branch | ||||||
|---|---|---|---|---|---|---|---|
| (1) | (2) | (3) | (4) | (5) | (6) | (7) | (8) |
| Nuclear | |||||||
| NGC 0024 | U | ||||||
| NGC 0337 | U | ||||||
| NGC 0855 | U | ||||||
| NGC 0925 | U | ||||||
| NGC 1482 | U | ||||||
| NGC 2798 | U | ||||||
| NGC 2915 | L | ||||||
| NGC 2976 | U | ||||||
| NGC 3049 | U | ||||||
| NGC 3034 | U | ||||||
| NGC 3184 | U | ||||||
| NGC 3265 | U | ||||||
| Mrk 33 | U | ||||||
| NGC 3351 | U | ||||||
| NGC 3773 | U | ||||||
| NGC 4254 | U | ||||||
| NGC 4536 | U | ||||||
| NGC 5713 | U | ||||||
| NGC 7793 | U | ||||||
| Circumnuclear | |||||||
| NGC 0024 | U | ||||||
| NGC 0337 | U | ||||||
| NGC 0855 | U | ||||||
| NGC 0925 | U | ||||||
| NGC 1097 | U | ||||||
| NGC 1482 | U | ||||||
| NGC 1512 | U | ||||||
| NGC 1705 | L | ||||||
| NGC 2403 | U | ||||||
| DDO 053 | L | ||||||
| NGC 2798 | U | ||||||
| NGC 2915 | L | ||||||
| NGC 2976 | U | ||||||
| NGC 3049 | U | ||||||
| NGC 3034 | U | ||||||
| M 81 Dw B | L | ||||||
| NGC 3184 | U | ||||||
| IC 2574 | L | ||||||
| NGC 3265 | U | ||||||
| Mrk 33 | U | ||||||
| NGC 3351 | U | ||||||
| NGC 3621 | U | ||||||
| NGC 3773 | U | ||||||
| NGC 4254 | U | ||||||
| NGC 4321 | U | ||||||
| NGC 4536 | U | ||||||
| NGC 4559 | U | ||||||
| NGC 4625 | U | ||||||
| NGC 4631 | U | ||||||
| NGC 4826 | U | ||||||
| Tol 89 | U | ||||||
| NGC 5474 | AbbThe oxygen abundance of this H ii region is not defined according to the criteria described in §4.2. | ||||||
| NGC 5713 | U | ||||||
| NGC 7793 | U | ||||||
| Radial Strip | |||||||
| NGC 0024 | U | ||||||
| NGC 0337 | U | ||||||
| NGC 0855 | U | ||||||
| NGC 0925 | U | ||||||
| NGC 1097 | U | ||||||
| NGC 1482 | U | ||||||
| NGC 1512 | U | ||||||
| NGC 1705 | L | ||||||
| NGC 2403 | U | ||||||
| DDO 053 | L | ||||||
| NGC 2798 | U | ||||||
| NGC 2841 | U | ||||||
| NGC 2915 | L | ||||||
| NGC 2976 | U | ||||||
| NGC 3049 | U | ||||||
| M 81 Dw B | L | ||||||
| NGC 3184 | U | ||||||
| NGC 3198 | U | ||||||
| NGC 3265 | U | ||||||
| Mrk 33 | U | ||||||
| NGC 3351 | U | ||||||
| NGC 3521 | U | ||||||
| NGC 3621 | U | ||||||
| NGC 3627 | U | ||||||
| NGC 3773 | U | ||||||
| NGC 4254 | U | ||||||
| NGC 4321 | U | ||||||
| NGC 4536 | U | ||||||
| NGC 4559 | U | ||||||
| NGC 4625 | U | ||||||
| NGC 4631 | U | ||||||
| NGC 4736 | U | ||||||
| NGC 4826 | U | ||||||
| NGC 5033 | U | ||||||
| NGC 5194 | U | ||||||
| Tol 89 | U | ||||||
| NGC 5474 | U | ||||||
| NGC 5713 | U | ||||||
| NGC 7331 | U | ||||||
| NGC 7793 | U | ||||||
Note. — (1) Galaxy name; (2-5) Adopted branch (U=upper, L=lower, A=ambiguous), parameter, and excitation parameters and (see §4.1 and §4.2); (6-8) Ionization parameter and oxygen abundances based on the KK04 and PT05 strong-line calibrations. Note that the uncertainties on the ionization parameter and oxygen abundances include statistical measurement errors only.
| Gradient | 12+log(O/H) | 12+log(O/H) | 12+log(O/H) | ||||
|---|---|---|---|---|---|---|---|
| Galaxy | Branch | (dex ) | at | at | Average | N(H ii) | Refs. |
| (1) | (2) | (3) | (4) | (5) | (6) | (7) | (8) |
| KK04 | |||||||
| NGC 0628 | U | 34 | 1,2,3,4,5 | ||||
| NGC 0925 | U | 55 | 2,5,6 | ||||
| NGC 1097 | U | 15 | 7 | ||||
| NGC 1705 | L | 9 | 8 | ||||
| NGC 2403 | U | 46 | 1,4,5,9,10 | ||||
| Ho II | L | 21 | 11,12,13 | ||||
| DDO 053 | L | 4 | 11,14 | ||||
| NGC 2841 | U | 5 | 1,15 | ||||
| NGC 2915 | L | 1 | 16 | ||||
| Ho I | L | 4 | 11,17 | ||||
| NGC 3049 | U | 1 | 18 | ||||
| NGC 3031 | U | 36 | 1,15,19,20 | ||||
| Ho IX | UaaThe branch of NGC 5474 based on its circumnuclear spectrum is ambiguous, according to the criteria defined in §4.2. | 2 | 11 | ||||
| M 81 Dw B | L | 1 | 17 | ||||
| NGC 3184 | U | 32 | 4,5,6 | ||||
| NGC 3198 | U | 13 | 6 | ||||
| IC 2574 | L | 21 | 11,13,17 | ||||
| Mrk 33 | U | 1 | 21 | ||||
| NGC 3351 | U | 25 | 1,4,15,22,23 | ||||
| NGC 3521 | U | 12 | 1,6 | ||||
| NGC 3621 | U | 30 | 6,24 | ||||
| NGC 4254 | U | 18 | 4,25,26 | ||||
| NGC 4321 | U | 9 | 4,26 | ||||
| NGC 4559 | U | 18 | 6 | ||||
| NGC 4725 | U | 8 | 6 | ||||
| NGC 4736 | U | 15 | 1,4,15 | ||||
| DDO 154 | L | 4 | 27,28 | ||||
| NGC 4826 | U | 5 | 15 | ||||
| DDO 165 | L | 1 | 11 | ||||
| NGC 5033 | U | 7 | 6 | ||||
| NGC 5055 | U | 5 | 4 | ||||
| NGC 5194 | U | 34 | 1,4,29,30,31 | ||||
| NGC 5408 | L | 1 | 32 | ||||
| NGC 6822 | U | 19 | 33,34 | ||||
| NGC 6946 | U | 8 | 3,4 | ||||
| NGC 7331 | U | 10 | 1,15 | ||||
| NGC 7552 | U | 1 | 35 | ||||
| NGC 7793 | U | 12 | 4,36 | ||||
| PT05 | |||||||
| NGC 0628 | U | 33 | 1,2,3,4,5 | ||||
| NGC 0925 | U | 52 | 2,5,6 | ||||
| NGC 1097 | U | 15 | 7 | ||||
| NGC 1705 | L | 5 | 8 | ||||
| NGC 2403 | U | 44 | 1,4,5,9,10 | ||||
| Ho II | L | 20 | 11,12,13 | ||||
| DDO 053 | L | 4 | 11,14 | ||||
| NGC 2841 | U | 5 | 1,15 | ||||
| NGC 2915 | L | 1 | 16 | ||||
| Ho I | L | 4 | 11,17 | ||||
| NGC 3049 | U | 1 | 18 | ||||
| NGC 3031 | U | 36 | 1,15,19,20 | ||||
| Ho IX | UaaAlthough Ho IX is among the faintest galaxies in our sample, the [N ii]/H and [N ii]/[O ii] line-ratios clearly place it on the upper branch (Croxall et al. 2009). | 2 | 11 | ||||
| M 81 Dw B | L | 1 | 17 | ||||
| NGC 3184 | U | 32 | 4,5,6 | ||||
| NGC 3198 | U | 12 | 6 | ||||
| IC 2574 | L | 18 | 11,13,17 | ||||
| Mrk 33 | U | 1 | 21 | ||||
| NGC 3351 | U | 25 | 1,4,15,22,23 | ||||
| NGC 3521 | U | 11 | 1,6 | ||||
| NGC 3621 | U | 29 | 6,24 | ||||
| NGC 4254 | U | 18 | 4,25,26 | ||||
| NGC 4321 | U | 9 | 4,26 | ||||
| NGC 4559 | U | 16 | 6 | ||||
| NGC 4725 | U | 8 | 6 | ||||
| NGC 4736 | U | 15 | 1,4,15 | ||||
| DDO 154 | L | 4 | 27,28 | ||||
| NGC 4826 | U | 5 | 15 | ||||
| DDO 165 | L | 1 | 11 | ||||
| NGC 5033 | U | 7 | 6 | ||||
| NGC 5055 | U | 5 | 4 | ||||
| NGC 5194 | U | 34 | 1,4,29,30,31 | ||||
| NGC 5408 | L | 1 | 32 | ||||
| NGC 6822 | U | 18 | 33,34 | ||||
| NGC 6946 | U | 8 | 3,4 | ||||
| NGC 7331 | U | 10 | 1,15 | ||||
| NGC 7552 | U | 1 | 35 | ||||
| NGC 7793 | U | 12 | 4,36 | ||||
Note. — (1) Galaxy name; (2) Adopted branch (U=upper, L=lower, A=ambiguous); (3) Slope of the radial abundance gradient; (4) Central oxygen abundance based on the derived abundance gradient; (5) Characteristic oxygen abundance, defined as the metallicity at , based on the derived abundance gradient; (6) Unweighted average and standard deviation of all the H ii-region abundances (see §4.3.2); (7) Number of H ii regions with measured abundances; (8) References to the literature from which the H ii-region line-ratios were taken (see Appendix B).
References. — (1) Bresolin et al. (1999); (2) Castellanos et al. (2002); (3) Ferguson et al. (1998); (4) McCall et al. (1985); (5) van Zee et al. (1998); (6) Zaritsky et al. (1994); (7) Storchi-Bergmann et al. (1996); (8) Lee & Skillman (2004); (9) Garnett et al. (1997); (10) Garnett et al. (1999); (11) Croxall et al. (2009); (12) Lee et al. (2003b); (13) Masegosa et al. (1991); (14) Skillman et al. (1989); (15) Oey & Kennicutt (1993); (16) Lee et al. (2003a); (17) Miller & Hodge (1996); (18) Guseva et al. (2000); (19) Garnett & Shields (1987); (20) Stauffer & Bothun (1984); (21) Kong & Cheng (2002); (22) Bresolin & Kennicutt (2002); (23) Díaz et al. (2007); (24) Ryder (1995); (25) Henry et al. (1994); (26) Shields (1991); (27) Kennicutt & Skillman (2001); (28) van Zee et al. (1997); (29) Bresolin et al. (2004); (30) Diaz et al. (1991); (31) Garnett et al. (2004b); (32) Stasińska et al. (1986); (33) Lee et al. (2006b); (34) Peimbert et al. (2005); (35) Storchi-Bergmann et al. (1995); (36) Edmunds & Pagel (1984).
| 12+log(O/H)KK04 | 12+log(O/H)PT05 | ||||||
|---|---|---|---|---|---|---|---|
| Galaxy | Central | Characteristic | Central | Characteristic | |||
| NGC 0024 | |||||||
| NGC 0337 | |||||||
| NGC 0584 | |||||||
| NGC 0628 | |||||||
| NGC 0855 | |||||||
| NGC 0925 | |||||||
| NGC 1097 | |||||||
| NGC 1266 | |||||||
| NGC 1291 | |||||||
| NGC 1316 | |||||||
| NGC 1377 | |||||||
| NGC 1404 | |||||||
| NGC 1482 | |||||||
| NGC 1512 | |||||||
| NGC 1566 | |||||||
| NGC 1705 | |||||||
| NGC 2403 | |||||||
| Ho II | |||||||
| M 81 Dw A | |||||||
| DDO 053 | |||||||
| NGC 2798 | |||||||
| NGC 2841 | |||||||
| NGC 2915 | |||||||
| Ho I | |||||||
| NGC 2976 | |||||||
| NGC 3049 | |||||||
| NGC 3031 | |||||||
| NGC 3034 | |||||||
| Ho IX | |||||||
| M 81 Dw B | |||||||
| NGC 3190 | |||||||
| NGC 3184 | |||||||
| NGC 3198 | |||||||
| IC 2574 | |||||||
| NGC 3265 | |||||||
| Mrk 33 | |||||||
| NGC 3351 | |||||||
| NGC 3521 | |||||||
| NGC 3621 | |||||||
| NGC 3627 | |||||||
| NGC 3773 | |||||||
| NGC 3938 | |||||||
| NGC 4125 | |||||||
| NGC 4236 | |||||||
| NGC 4254 | |||||||
| NGC 4321 | |||||||
| NGC 4450 | |||||||
| NGC 4536 | |||||||
| NGC 4552 | |||||||
| NGC 4559 | |||||||
| NGC 4569 | |||||||
| NGC 4579 | |||||||
| NGC 4594 | |||||||
| NGC 4625 | |||||||
| NGC 4631 | |||||||
| NGC 4725 | |||||||
| NGC 4736 | |||||||
| DDO 154 | |||||||
| NGC 4826 | |||||||
| DDO 165 | |||||||
| NGC 5033 | |||||||
| NGC 5055 | |||||||
| NGC 5194 | |||||||
| NGC 5195 | |||||||
| Tol 89 | |||||||
| NGC 5408 | |||||||
| NGC 5474 | |||||||
| NGC 5713 | |||||||
| NGC 5866 | |||||||
| IC 4710 | |||||||
| NGC 6822 | |||||||
| NGC 6946 | |||||||
| NGC 7331 | |||||||
| NGC 7552 | |||||||
| NGC 7793 | |||||||
Note. — Final central and characteristic nebular oxygen abundances for the SINGS galaxies based on the KK04 and PT05 abundance calibrations. The central abundance characterizes the inner, or nuclear metallicity of each galaxy, while the characteristic abundance is a globally-averaged metallicity. Note that the uncertainties on the oxygen abundances include statistical measurement errors only. We also provide the oxygen abundances inferred from the -band luminosity-metallicity () relation for every object; the uncertainty in the abundance is at least dex (see §4.4 and Fig. 11).
| No. | Galaxy | Region | Ref. | ||||||
|---|---|---|---|---|---|---|---|---|---|
| (1) | (2) | (3) | (4) | (5) | (6) | (7) | (8) | (9) | (10) |
| 001 | NGC 0628 | H292 | 0.23 | 1 | |||||
| 002 | NGC 0628 | H451 | 0.26 | 1 | |||||
| 003 | NGC 0628 | H572 | 0.39 | 1 | |||||
| 004 | NGC 0628 | H598 | 0.41 | 1 | |||||
| 005 | NGC 0628 | H627 | 0.51 | 1 | |||||
| 006 | NGC 0628 | H154-155 | 0.72 | 1 | |||||
| 007 | NGC 0628 | H13 | 0.71 | 1 | |||||
| 008 | NGC 0628 | FGW628A | 0.26 | 2 | |||||
| 009 | NGC 0628 | FGW628B | 0.80 | 2 | |||||
| 010 | NGC 0628 | +081-140 | 0.55 | 3 | |||||
| 011 | NGC 0628 | +062-158 | 0.57 | 3 | |||||
| 012 | NGC 0628 | +047-172 | 0.59 | 3 | |||||
| 013 | NGC 0628 | +044-175 | 0.60 | 3 | |||||
| 014 | NGC 0628 | +180-008 | 0.62 | 3 | |||||
| 015 | NGC 0628 | +178-052 | 0.65 | 3 | |||||
| 016 | NGC 0628 | -086+186 | 0.69 | 3 | |||||
| 017 | NGC 0628 | -075+200 | 0.72 | 3 | |||||
| 018 | NGC 0628 | -073+203 | 0.72 | 3 | |||||
| 019 | NGC 0628 | -069+208 | 0.73 | 3 | |||||
| 020 | NGC 0628 | +254-043 | 0.90 | 3 | |||||
| 021 | NGC 0628 | +256-041 | 0.90 | aaThe branch of this H ii region is ambiguous according to the criteria described in §4.2. | 3 | ||||
| 022 | NGC 0628 | -232+112 | 0.90 | 3 | |||||
| 023 | NGC 0628 | +262-041 | 0.92 | 3 | |||||
| 024 | NGC 0628 | +264-037 | 0.93 | 3 | |||||
| 025 | NGC 0628 | +265-041 | 0.93 | 3 | |||||
| 026 | NGC 0628 | -227+148 | 0.95 | 3 | |||||
| 027 | NGC 0628 | +049+052 | 0.23 | 4 | |||||
| 028 | NGC 0628 | -074-022 | 0.26 | 4 | |||||
| 029 | NGC 0628 | -060-107 | 0.39 | 4 | |||||
| 030 | NGC 0628 | +042-116 | 0.41 | 4 | |||||
| 031 | NGC 0628 | -042-154 | 0.51 | 4 | |||||
| 032 | NGC 0628 | -186+086 | 0.72 | 4 | |||||
| 033 | NGC 0628 | -089+192 | 0.71 | 4 | |||||
| 034 | NGC 0628 | H13 | 0.71 | 5 | |||||
| 035 | NGC 0925 | CDT1 | 0.03 | 5 | |||||
| 036 | NGC 0925 | CDT2 | 0.02 | 5 | |||||
| 037 | NGC 0925 | CDT3 | 0.04 | 5 | |||||
| 038 | NGC 0925 | CDT4 | 0.14 | 5 | |||||
| 039 | NGC 0925 | +002-002 | 0.01 | 3 | |||||
| 040 | NGC 0925 | -005+000 | 0.02 | 3 | |||||
| 041 | NGC 0925 | -008+000 | 0.03 | 3 | |||||
| 042 | NGC 0925 | +010-004 | 0.04 | 3 | |||||
| 043 | NGC 0925 | +015-005 | 0.05 | 3 | |||||
| 044 | NGC 0925 | +030-008 | 0.10 | 3 | |||||
| 045 | NGC 0925 | +036-010 | 0.12 | 3 | |||||
| 046 | NGC 0925 | +042-011 | 0.14 | 3 | |||||
| 047 | NGC 0925 | +087-031 | 0.30 | 3 | |||||
| 048 | NGC 0925 | -012-066 | 0.40 | 3 | |||||
| 049 | NGC 0925 | -047-058 | 0.41 | 3 | |||||
| 050 | NGC 0925 | +135-016 | 0.44 | 3 | |||||
| 051 | NGC 0925 | -109+062 | 0.44 | 3 | |||||
| 052 | NGC 0925 | +137+011 | 0.48 | 3 | |||||
| 053 | NGC 0925 | -137+056 | 0.49 | 3 | |||||
| 054 | NGC 0925 | -145-006 | 0.50 | 3 | |||||
| 055 | NGC 0925 | -080+087 | 0.51 | 3 | |||||
| 056 | NGC 0925 | -114+087 | 0.55 | bbThe oxygen abundance of this H ii region is not defined according to the criteria described in §4.2. | 3 | ||||
| 057 | NGC 0925 | +161+015 | 0.57 | 3 | |||||
| 058 | NGC 0925 | +174+018 | 0.62 | 3 | |||||
| 059 | NGC 0925 | +182+019 | 0.65 | 3 | |||||
| 060 | NGC 0925 | -187-017 | 0.66 | 3 | |||||
| 061 | NGC 0925 | -192-018 | 0.68 | 3 | |||||
| 062 | NGC 0925 | -192-018 | 0.68 | 3 | |||||
| 063 | NGC 0925 | -198-013 | 0.69 | 3 | |||||
| 064 | NGC 0925 | +209-006 | 0.69 | 3 | |||||
| 065 | NGC 0925 | -200-020 | 0.71 | 3 | |||||
| 066 | NGC 0925 | +217-006 | 0.72 | 3 | |||||
| 067 | NGC 0925 | +156-114 | 0.73 | 3 | |||||
| 068 | NGC 0925 | -220+004 | 0.73 | 3 | |||||
| 069 | NGC 0925 | +221-006 | 0.73 | 3 | |||||
| 070 | NGC 0925 | +052+130 | 0.82 | 3 | |||||
| 071 | NGC 0925 | -250+019 | 0.82 | 3 | |||||
| 072 | NGC 0925 | +206-114 | 0.82 | 3 | |||||
| 073 | NGC 0925 | +019+143 | 0.85 | aaThe branch of this H ii region is ambiguous according to the criteria described in §4.2. | 3 | ||||
| 074 | NGC 0925 | -174+140 | 0.87 | 3 | |||||
| 075 | NGC 0925 | -262+011 | 0.86 | aaThe branch of this H ii region is ambiguous according to the criteria described in §4.2. | 3 | ||||
| 076 | NGC 0925 | -272+016 | 0.89 | 3 | |||||
| 077 | NGC 0925 | -274+010 | 0.90 | 3 | |||||
| 078 | NGC 0925 | -285+023 | 0.93 | 3 | |||||
| 079 | NGC 0925 | -159+162 | 0.96 | 3 | |||||
| 080 | NGC 0925 | -308+035 | 1.00 | 3 | |||||
| 081 | NGC 0925 | -205-001 | 0.69 | 6 | |||||
| 082 | NGC 0925 | -179-022 | 0.65 | 6 | |||||
| 083 | NGC 0925 | -236+017 | 0.77 | 6 | |||||
| 084 | NGC 0925 | -259+007 | 0.86 | 6 | |||||
| 085 | NGC 0925 | +003-003 | 0.02 | 6 | |||||
| 086 | NGC 0925 | -004-068 | 0.40 | 6 | |||||
| 087 | NGC 0925 | -069+081 | 0.47 | 6 | |||||
| 088 | NGC 0925 | +060-077 | 0.44 | 6 | |||||
| 089 | NGC 0925 | +029+134 | 0.81 | 6 | |||||
| 090 | NGC 1097 | H130+9.0 RING | 0.03 | 7 | |||||
| 091 | NGC 1097 | H130-9.0 RING | 0.03 | 7 | |||||
| 092 | NGC 1097 | H130-121.5 | 0.43 | 7 | |||||
| 093 | NGC 1097 | H139+8.2 RING | 0.03 | 7 | |||||
| 094 | NGC 1097 | H139+49.2 | 0.18 | 7 | |||||
| 095 | NGC 1097 | H139+55.2 | 0.20 | 7 | |||||
| 096 | NGC 1097 | H139+107.9 | 0.39 | 7 | |||||
| 097 | NGC 1097 | H139-9.0 | 0.03 | 7 | |||||
| 098 | NGC 1097 | H139-57.8 | 0.21 | 7 | |||||
| 099 | NGC 1097 | H139-70.8 | 0.26 | 7 | |||||
| 100 | NGC 1097 | H139-100.8 | 0.37 | 7 | |||||
| 101 | NGC 1097 | H139-112.8 | 0.41 | 7 | |||||
| 102 | NGC 1097 | H170+9.0 RING | 0.04 | 7 | |||||
| 103 | NGC 1097 | H170-9.9 RING | 0.04 | 7 | |||||
| 104 | NGC 1097 | H170-83.7 | 0.37 | 7 | |||||
| 105 | NGC 1705 | A1 | 8 | ||||||
| 106 | NGC 1705 | A2 | 0.13 | aaThe branch of this H ii region is ambiguous according to the criteria described in §4.2. | aaThe branch of this H ii region is ambiguous according to the criteria described in §4.2. | 8 | |||
| 107 | NGC 1705 | A3 | 0.22 | 8 | |||||
| 108 | NGC 1705 | A4 | 8 | ||||||
| 109 | NGC 1705 | B1 | 0.19 | aaThe branch of this H ii region is ambiguous according to the criteria described in §4.2. | 8 | ||||
| 110 | NGC 1705 | B2 | bbThe oxygen abundance of this H ii region is not defined according to the criteria described in §4.2. | bbThe oxygen abundance of this H ii region is not defined according to the criteria described in §4.2. | 8 | ||||
| 111 | NGC 1705 | B3 | aaThe branch of this H ii region is ambiguous according to the criteria described in §4.2. | 8 | |||||
| 112 | NGC 1705 | B4 | aaThe branch of this H ii region is ambiguous according to the criteria described in §4.2. | bbThe oxygen abundance of this H ii region is not defined according to the criteria described in §4.2. | 8 | ||||
| 113 | NGC 1705 | B5 | bbThe oxygen abundance of this H ii region is not defined according to the criteria described in §4.2. | bbThe oxygen abundance of this H ii region is not defined according to the criteria described in §4.2. | 8 | ||||
| 114 | NGC 1705 | B6 | 0.22 | bbThe oxygen abundance of this H ii region is not defined according to the criteria described in §4.2. | bbThe oxygen abundance of this H ii region is not defined according to the criteria described in §4.2. | 8 | |||
| 115 | NGC 1705 | B7 | 8 | ||||||
| 116 | NGC 1705 | B8 | aaThe branch of this H ii region is ambiguous according to the criteria described in §4.2. | 8 | |||||
| 117 | NGC 1705 | C1 | aaThe branch of this H ii region is ambiguous according to the criteria described in §4.2. | 8 | |||||
| 118 | NGC 1705 | C2 | 0.22 | aaThe branch of this H ii region is ambiguous according to the criteria described in §4.2. | bbThe oxygen abundance of this H ii region is not defined according to the criteria described in §4.2. | 8 | |||
| 119 | NGC 1705 | C3 | bbThe oxygen abundance of this H ii region is not defined according to the criteria described in §4.2. | bbThe oxygen abundance of this H ii region is not defined according to the criteria described in §4.2. | 8 | ||||
| 120 | NGC 1705 | C4 | aaThe branch of this H ii region is ambiguous according to the criteria described in §4.2. | bbThe oxygen abundance of this H ii region is not defined according to the criteria described in §4.2. | 8 | ||||
| 121 | NGC 1705 | C6 | 8 | ||||||
| 122 | NGC 2403 | -096+035 | 0.17 | 1 | |||||
| 123 | NGC 2403 | -045+055 | 0.11 | 1 | |||||
| 124 | NGC 2403 | -186+045 | 0.35 | 1 | |||||
| 125 | NGC 2403 | +010+032 | 0.09 | 1 | |||||
| 126 | NGC 2403 | -133-146 | 0.56 | 1 | |||||
| 127 | NGC 2403 | +063-049 | 0.12 | 1 | |||||
| 128 | NGC 2403 | +165+136 | 0.60 | 1 | |||||
| 129 | NGC 2403 | +045+069 | 0.23 | 1 | |||||
| 130 | NGC 2403 | -494+137 | 0.91 | 1 | |||||
| 131 | NGC 2403 | VS38 | 0.09 | 9 | |||||
| 132 | NGC 2403 | VS44 | 0.26 | 9 | |||||
| 133 | NGC 2403 | VS9 | 0.56 | 9 | |||||
| 134 | NGC 2403 | +186-177 | 0.40 | aaThe branch of this H ii region is ambiguous according to the criteria described in §4.2. | 3 | ||||
| 135 | NGC 2403 | +178-203 | 0.43 | 3 | |||||
| 136 | NGC 2403 | +176-211 | 0.44 | 3 | |||||
| 137 | NGC 2403 | +166-229 | 0.47 | 3 | |||||
| 138 | NGC 2403 | +356-195 | 0.64 | bbThe oxygen abundance of this H ii region is not defined according to the criteria described in §4.2. | 3 | ||||
| 139 | NGC 2403 | +360-190 | 0.64 | 3 | |||||
| 140 | NGC 2403 | +377-163 | 0.67 | 3 | |||||
| 141 | NGC 2403 | +376-106 | 0.69 | 3 | |||||
| 142 | NGC 2403 | -377+104 | 0.70 | 3 | |||||
| 143 | NGC 2403 | -105-218 | 0.68 | 3 | |||||
| 144 | NGC 2403 | -105-224 | 0.69 | 3 | |||||
| 145 | NGC 2403 | -381+082 | 0.72 | 3 | |||||
| 146 | NGC 2403 | +383-056 | 0.75 | 3 | |||||
| 147 | NGC 2403 | -104-256 | 0.76 | 3 | |||||
| 148 | NGC 2403 | -425-002 | 0.90 | 3 | |||||
| 149 | NGC 2403 | -423-010 | 0.91 | 3 | |||||
| 150 | NGC 2403 | -421-017 | 0.92 | 3 | |||||
| 151 | NGC 2403 | VS35 | 0.08 | 10 | |||||
| 152 | NGC 2403 | VS24 | 0.09 | 10 | |||||
| 153 | NGC 2403 | VS38 | 0.09 | 10 | |||||
| 154 | NGC 2403 | VS21 | 0.18 | 10 | |||||
| 155 | NGC 2403 | VS28 | 0.19 | 10 | |||||
| 156 | NGC 2403 | VS41 | 0.23 | 10 | |||||
| 157 | NGC 2403 | VS44 | 0.26 | 10 | |||||
| 158 | NGC 2403 | VS51 | 0.33 | 10 | |||||
| 159 | NGC 2403 | VS3 | 0.35 | 10 | |||||
| 160 | NGC 2403 | VS49 | 0.51 | 10 | |||||
| 161 | NGC 2403 | VS48 | 0.51 | 10 | |||||
| 162 | NGC 2403 | +010+032 | 0.09 | 4 | |||||
| 163 | NGC 2403 | +063-049 | 0.12 | 4 | |||||
| 164 | NGC 2403 | +045+069 | 0.23 | 4 | |||||
| 165 | NGC 2403 | -133-146 | 0.56 | 4 | |||||
| 166 | NGC 2403 | +165+136 | 0.60 | 4 | |||||
| 167 | NGC 2403 | -494+137 | 0.91 | 4 | |||||
| 168 | Ho II | H2 | 0.69 | 11 | |||||
| 169 | Ho II | H3 | 0.69 | 11 | |||||
| 170 | Ho II | H4 | 0.69 | 11 | |||||
| 171 | Ho II | H5 | 0.63 | 11 | |||||
| 172 | Ho II | H7 | 0.20 | 11 | |||||
| 173 | Ho II | H8 | 0.18 | 11 | |||||
| 174 | Ho II | H9 | 0.13 | 11 | |||||
| 175 | Ho II | H11 | 0.99 | 11 | |||||
| 176 | Ho II | H13 | 0.60 | 11 | |||||
| 177 | Ho II | H1 | 0.69 | aaThe branch of this H ii region is ambiguous according to the criteria described in §4.2. | 12 | ||||
| 178 | Ho II | H2 | 0.69 | 12 | |||||
| 179 | Ho II | H3 | 0.69 | 12 | |||||
| 180 | Ho II | H4 | 0.69 | 12 | |||||
| 181 | Ho II | H5 | 0.68 | 12 | |||||
| 182 | Ho II | H6 | 0.65 | 12 | |||||
| 183 | Ho II | H7 | 0.65 | 12 | |||||
| 184 | Ho II | H8 | 0.65 | 12 | |||||
| 185 | Ho II | H9 | 0.63 | 12 | |||||
| 186 | Ho II | AA | 13 | ||||||
| 187 | Ho II | AA1 | 13 | ||||||
| 188 | Ho II | AS | 13 | ||||||
| 189 | DDO 053 | H3 | 0.87 | 11 | |||||
| 190 | DDO 053 | H4 | 0.65 | 11 | |||||
| 191 | DDO 053 | H5 | 0.02 | 11 | |||||
| 192 | DDO 053 | No.1 | 14 | ||||||
| 193 | NGC 2841 | HK27 | 0.61 | 1 | |||||
| 194 | NGC 2841 | HK51 | 0.41 | 1 | |||||
| 195 | NGC 2841 | HK52 | 0.37 | 1 | |||||
| 196 | NGC 2841 | HK62 | 0.47 | 1 | |||||
| 197 | NGC 2841 | -042+086 | 0.41 | 15 | |||||
| 198 | NGC 2915 | H1 | bbThe oxygen abundance of this H ii region is not defined according to the criteria described in §4.2. | bbThe oxygen abundance of this H ii region is not defined according to the criteria described in §4.2. | 16 | ||||
| 199 | NGC 2915 | H1 | 16 | ||||||
| 200 | Ho I | H1 | 11 | ||||||
| 201 | Ho I | H3 | 11 | ||||||
| 202 | Ho I | H5 | 11 | ||||||
| 203 | Ho I | MH25 | 17 | ||||||
| 204 | NGC 3049 | 0952+095 | 18 | ||||||
| 205 | NGC 3031 | GS1 | 0.39 | 1 | |||||
| 206 | NGC 3031 | GS2 | 0.34 | 1 | |||||
| 207 | NGC 3031 | GS4 | 0.63 | 1 | |||||
| 208 | NGC 3031 | GS7 | 0.66 | 1 | |||||
| 209 | NGC 3031 | GS9 | 0.46 | 1 | |||||
| 210 | NGC 3031 | GS11 | 0.39 | 1 | |||||
| 211 | NGC 3031 | GS12 | 0.35 | 1 | |||||
| 212 | NGC 3031 | GS13 | 0.35 | 1 | |||||
| 213 | NGC 3031 | Muench18 | 0.69 | 1 | |||||
| 214 | NGC 3031 | +107-291 | 0.39 | 15 | |||||
| 215 | NGC 3031 | HK472 | 0.29 | 19 | |||||
| 216 | NGC 3031 | HK230 | 0.35 | 19 | |||||
| 217 | NGC 3031 | HK152 | 0.40 | 19 | |||||
| 218 | NGC 3031 | HK343-50 | 0.34 | 19 | |||||
| 219 | NGC 3031 | HK453 | 0.35 | 19 | |||||
| 220 | NGC 3031 | HK305-12 | 0.36 | 19 | |||||
| 221 | NGC 3031 | HK268 | 0.39 | 19 | |||||
| 222 | NGC 3031 | HK500-9 | 0.39 | 19 | |||||
| 223 | NGC 3031 | HK652 | 0.46 | 19 | |||||
| 224 | NGC 3031 | HK712 | 0.51 | 19 | |||||
| 225 | NGC 3031 | HK666-72 | 0.50 | 19 | |||||
| 226 | NGC 3031 | HK767 | 0.63 | 19 | |||||
| 227 | NGC 3031 | HK741-4 | 0.66 | 19 | |||||
| 228 | NGC 3031 | HK105 | 0.67 | 19 | |||||
| 229 | NGC 3031 | MUNCH18 | 0.69 | 19 | |||||
| 230 | NGC 3031 | HK537 | 0.76 | 19 | |||||
| 231 | NGC 3031 | HK74 | 0.61 | 20 | |||||
| 232 | NGC 3031 | HK169 | 0.39 | 20 | |||||
| 233 | NGC 3031 | HK305 | 0.36 | 20 | |||||
| 234 | NGC 3031 | HK361 | 0.30 | 20 | |||||
| 235 | NGC 3031 | HK385 | 0.32 | 20 | |||||
| 236 | NGC 3031 | HK453 | 0.35 | 20 | |||||
| 237 | NGC 3031 | HK740 | 0.60 | 20 | |||||
| 238 | NGC 3031 | HK744 | 0.65 | 20 | |||||
| 239 | NGC 3031 | HK755 | 0.64 | 20 | |||||
| 240 | NGC 3031 | SB84 A | 0.49 | 20 | |||||
| 241 | Ho IX | H3 | 11 | ||||||
| 242 | Ho IX | H12 | 11 | ||||||
| 243 | M 81 Dw B | MH1 | 0.61 | 17 | |||||
| 244 | NGC 3184 | -058-007 | 0.28 | 3 | |||||
| 245 | NGC 3184 | -064-006 | 0.30 | 3 | |||||
| 246 | NGC 3184 | -080-005 | 0.38 | 3 | |||||
| 247 | NGC 3184 | +085-004 | 0.40 | 3 | |||||
| 248 | NGC 3184 | +079+035 | 0.41 | 3 | |||||
| 249 | NGC 3184 | +059-079 | 0.44 | 3 | |||||
| 250 | NGC 3184 | +074+064 | 0.47 | 3 | |||||
| 251 | NGC 3184 | +092-093 | 0.59 | 3 | |||||
| 252 | NGC 3184 | +005+135 | 0.63 | 3 | |||||
| 253 | NGC 3184 | -002+136 | 0.63 | 3 | |||||
| 254 | NGC 3184 | -017+137 | 0.64 | 3 | |||||
| 255 | NGC 3184 | +111-102 | 0.68 | 3 | |||||
| 256 | NGC 3184 | -119-121 | 0.82 | 3 | |||||
| 257 | NGC 3184 | -113-127 | 0.82 | 3 | |||||
| 258 | NGC 3184 | -101-137 | 0.82 | 3 | |||||
| 259 | NGC 3184 | -110-130 | 0.82 | 3 | |||||
| 260 | NGC 3184 | -095-142 | 0.82 | 3 | |||||
| 261 | NGC 3184 | +106-020 | 0.50 | 6 | |||||
| 262 | NGC 3184 | +106-020 | 0.50 | 6 | |||||
| 263 | NGC 3184 | +000+068 | 0.32 | 6 | |||||
| 264 | NGC 3184 | -008+073 | 0.34 | 6 | |||||
| 265 | NGC 3184 | -020-097 | 0.47 | 6 | |||||
| 266 | NGC 3184 | -011+078 | 0.36 | 6 | |||||
| 267 | NGC 3184 | -012-089 | 0.42 | 6 | |||||
| 268 | NGC 3184 | -059-041 | 0.35 | 6 | |||||
| 269 | NGC 3184 | -075-087 | 0.56 | 6 | |||||
| 270 | NGC 3184 | -172-041 | 0.84 | 6 | |||||
| 271 | NGC 3184 | -067-039 | 0.37 | 4 | |||||
| 272 | NGC 3184 | -020-095 | 0.46 | 4 | |||||
| 273 | NGC 3184 | -077+093 | 0.54 | 4 | |||||
| 274 | NGC 3184 | +070+091 | 0.55 | 4 | |||||
| 275 | NGC 3184 | +073-147 | 0.74 | 4 | |||||
| 276 | NGC 3198 | -066-111 | 0.52 | 6 | |||||
| 277 | NGC 3198 | -089-110 | 0.56 | 6 | |||||
| 278 | NGC 3198 | -041-045 | 0.25 | 6 | |||||
| 279 | NGC 3198 | -040-009 | 0.34 | 6 | |||||
| 280 | NGC 3198 | -060-007 | 0.54 | 6 | |||||
| 281 | NGC 3198 | +030-030 | 0.48 | 6 | |||||
| 282 | NGC 3198 | +071+046 | 0.48 | 6 | |||||
| 283 | NGC 3198 | +038+044 | 0.24 | 6 | |||||
| 284 | NGC 3198 | +083+150 | 0.70 | 6 | |||||
| 285 | NGC 3198 | +093+152 | 0.71 | 6 | |||||
| 286 | NGC 3198 | +009+113 | 0.76 | aaThe branch of this H ii region is ambiguous according to the criteria described in §4.2. | 6 | ||||
| 287 | NGC 3198 | +016+118 | 0.75 | 6 | |||||
| 288 | NGC 3198 | +026+126 | 0.75 | aaThe branch of this H ii region is ambiguous according to the criteria described in §4.2. | aaThe branch of this H ii region is ambiguous according to the criteria described in §4.2. | 6 | |||
| 289 | NGC 3198 | +036+131 | 0.73 | 6 | |||||
| 290 | IC 2574 | H1 | 0.69 | 11 | |||||
| 291 | IC 2574 | H2 | 0.81 | 11 | |||||
| 292 | IC 2574 | H3 | 0.74 | 11 | |||||
| 293 | IC 2574 | H5 | 0.85 | 11 | |||||
| 294 | IC 2574 | H6 | 0.88 | 11 | |||||
| 295 | IC 2574 | H8 | 0.92 | 11 | |||||
| 296 | IC 2574 | H9 | 0.83 | 11 | |||||
| 297 | IC 2574 | H10 | 0.90 | 11 | |||||
| 298 | IC 2574 | H11 | 0.98 | 11 | |||||
| 299 | IC 2574 | H13 | 0.95 | 11 | |||||
| 300 | IC 2574 | MH167 | 0.91 | 17 | |||||
| 301 | IC 2574 | MH198 | 0.85 | 17 | |||||
| 302 | IC 2574 | MH242 | 0.82 | 17 | |||||
| 303 | IC 2574 | IIA | 13 | ||||||
| 304 | IC 2574 | IIS | 13 | ||||||
| 305 | IC 2574 | IIAA | 13 | ||||||
| 306 | IC 2574 | IIAB | 13 | ||||||
| 307 | IC 2574 | IIIA | 13 | ||||||
| 308 | IC 2574 | IIIB | bbThe oxygen abundance of this H ii region is not defined according to the criteria described in §4.2. | 13 | |||||
| 309 | IC 2574 | IIIC | bbThe oxygen abundance of this H ii region is not defined according to the criteria described in §4.2. | 13 | |||||
| 310 | IC 2574 | IIIS | aaThe branch of this H ii region is ambiguous according to the criteria described in §4.2. | 13 | |||||
| 311 | Mrk 33 | H1 | 21 | ||||||
| 312 | NGC 3351 | R1 | 0.03 | 22 | |||||
| 313 | NGC 3351 | R2 | 0.02 | 22 | |||||
| 314 | NGC 3351 | R3 | 0.03 | 22 | |||||
| 315 | NGC 3351 | R4 | 0.02 | 22 | |||||
| 316 | NGC 3351 | R5 | 0.03 | 22 | |||||
| 317 | NGC 3351 | H34 | 0.31 | 23 | |||||
| 318 | NGC 3351 | H19 | 0.33 | 23 | |||||
| 319 | NGC 3351 | PR2 | 0.02 | 23 | |||||
| 320 | NGC 3351 | PR3 | 0.03 | 23 | |||||
| 321 | NGC 3351 | PR7 | 0.03 | 23 | |||||
| 322 | NGC 3351 | PR1 | 0.03 | 23 | |||||
| 323 | NGC 3351 | HK45 | 0.31 | 1 | |||||
| 324 | NGC 3351 | HK80 | 0.67 | 1 | |||||
| 325 | NGC 3351 | HK101 | 0.58 | 1 | |||||
| 326 | NGC 3351 | HK109 | 0.74 | 1 | |||||
| 327 | NGC 3351 | +029-192 | 0.95 | 1 | |||||
| 328 | NGC 3351 | +023+067 | 0.32 | 15 | |||||
| 329 | NGC 3351 | +000+068 | 0.32 | 15 | |||||
| 330 | NGC 3351 | HK80 | 0.67 | 15 | |||||
| 331 | NGC 3351 | HK101 | 0.58 | 15 | |||||
| 332 | NGC 3351 | HK109 | 0.74 | 15 | |||||
| 333 | NGC 3351 | -001+006 | 0.03 | 15 | |||||
| 334 | NGC 3351 | -004-006 | 0.03 | 4 | |||||
| 335 | NGC 3351 | -088-026 | 0.58 | 4 | |||||
| 336 | NGC 3351 | -058-135 | 0.67 | 4 | |||||
| 337 | NGC 3521 | +013+097 | 0.39 | 1 | |||||
| 338 | NGC 3521 | -005+080 | 0.27 | 1 | |||||
| 339 | NGC 3521 | -048+047 | 0.29 | 1 | |||||
| 340 | NGC 3521 | +013+097 | 0.39 | 6 | |||||
| 341 | NGC 3521 | -005+080 | 0.27 | 6 | |||||
| 342 | NGC 3521 | -048+047 | 0.29 | 6 | |||||
| 343 | NGC 3521 | -048+043 | 0.29 | 6 | |||||
| 344 | NGC 3521 | -010-025 | 0.13 | 6 | |||||
| 345 | NGC 3521 | +040-035 | 0.24 | 6 | |||||
| 346 | NGC 3521 | +034-097 | 0.31 | 6 | |||||
| 347 | NGC 3521 | -033-118 | 0.56 | aaThe branch of this H ii region is ambiguous according to the criteria described in §4.2. | 6 | ||||
| 348 | NGC 3521 | +062-170 | 0.55 | 6 | |||||
| 349 | NGC 3521 | -048+031 | 0.29 | 6 | |||||
| 350 | NGC 3621 | P1A2 | 0.32 | 24 | |||||
| 351 | NGC 3621 | P1A3 | 0.19 | 24 | |||||
| 352 | NGC 3621 | P1A4 | 0.21 | 24 | |||||
| 353 | NGC 3621 | P1A6 | 0.12 | 24 | |||||
| 354 | NGC 3621 | P1A7 | 0.19 | 24 | |||||
| 355 | NGC 3621 | P1A8 | 0.19 | 24 | |||||
| 356 | NGC 3621 | P1A9 | 0.35 | 24 | |||||
| 357 | NGC 3621 | P2A1 | 0.39 | 24 | |||||
| 358 | NGC 3621 | P2A2 | 0.23 | 24 | |||||
| 359 | NGC 3621 | P2A3 | 0.16 | 24 | |||||
| 360 | NGC 3621 | P2A6 | 0.09 | 24 | |||||
| 361 | NGC 3621 | P2A7 | 0.26 | 24 | |||||
| 362 | NGC 3621 | S1A3 | 0.19 | 24 | |||||
| 363 | NGC 3621 | S1A4 | 0.39 | 24 | |||||
| 364 | NGC 3621 | S2A1 | 0.39 | 24 | |||||
| 365 | NGC 3621 | S2A2 | 0.23 | 24 | |||||
| 366 | NGC 3621 | S2A3 | 0.10 | 24 | |||||
| 367 | NGC 3621 | S2A4 | 0.19 | 24 | |||||
| 368 | NGC 3621 | S3A1 | 0.66 | 24 | |||||
| 369 | NGC 3621 | S3A2 | 0.65 | aaThe branch of this H ii region is ambiguous according to the criteria described in §4.2. | bbThe oxygen abundance of this H ii region is not defined according to the criteria described in §4.2. | 24 | |||
| 370 | NGC 3621 | S4A2 | 0.39 | aaThe branch of this H ii region is ambiguous according to the criteria described in §4.2. | 24 | ||||
| 371 | NGC 3621 | S5A1 | 0.22 | 24 | |||||
| 372 | NGC 3621 | S5A2 | 0.20 | 24 | |||||
| 373 | NGC 3621 | S5A3 | 0.21 | 24 | |||||
| 374 | NGC 3621 | +025+068 | 0.28 | 6 | |||||
| 375 | NGC 3621 | -010+095 | 0.28 | 6 | |||||
| 376 | NGC 3621 | +061-015 | 0.27 | 6 | |||||
| 377 | NGC 3621 | +026-037 | 0.13 | 6 | |||||
| 378 | NGC 3621 | +067-058 | 0.30 | 6 | |||||
| 379 | NGC 3621 | +029-018 | 0.13 | 6 | |||||
| 380 | NGC 3621 | +091-068 | 0.40 | 6 | |||||
| 381 | NGC 4254 | H142 | 0.13 | 25 | |||||
| 382 | NGC 4254 | H78 | 0.24 | 25 | |||||
| 383 | NGC 4254 | H173 | 0.25 | 25 | |||||
| 384 | NGC 4254 | H134 | 0.42 | 25 | |||||
| 385 | NGC 4254 | H185 | 0.53 | 25 | |||||
| 386 | NGC 4254 | H184 | 0.62 | 25 | |||||
| 387 | NGC 4254 | H84 | 0.64 | 25 | |||||
| 388 | NGC 4254 | H22 | 0.80 | 25 | |||||
| 389 | NGC 4254 | H12 | 0.86 | 25 | |||||
| 390 | NGC 4254 | HK20 | 0.58 | 26 | |||||
| 391 | NGC 4254 | HK1 | 0.74 | 26 | |||||
| 392 | NGC 4254 | HK208 | 0.82 | 26 | |||||
| 393 | NGC 4254 | +013+006 | 0.10 | 4 | |||||
| 394 | NGC 4254 | -005+042 | 0.27 | 4 | |||||
| 395 | NGC 4254 | +055-042 | 0.49 | 4 | |||||
| 396 | NGC 4254 | -047-075 | 0.55 | 4 | |||||
| 397 | NGC 4254 | +093+039 | 0.67 | 4 | |||||
| 398 | NGC 4254 | +102+015 | 0.71 | 4 | |||||
| 399 | NGC 4321 | HK160 | 0.31 | 26 | |||||
| 400 | NGC 4321 | HK143 | 0.48 | 26 | |||||
| 401 | NGC 4321 | HK201 | 0.74 | 26 | |||||
| 402 | NGC 4321 | HK284 | 0.67 | 26 | |||||
| 403 | NGC 4321 | HK128 | 0.68 | 26 | |||||
| 404 | NGC 4321 | -051+091 | 0.53 | 4 | |||||
| 405 | NGC 4321 | +032-074 | 0.41 | 4 | |||||
| 406 | NGC 4321 | -114+010 | 0.59 | 4 | |||||
| 407 | NGC 4321 | +034+145 | 0.68 | 4 | |||||
| 408 | NGC 4559 | +011-008 | 0.06 | 6 | |||||
| 409 | NGC 4559 | -026+103 | 0.40 | 6 | |||||
| 410 | NGC 4559 | -043+117 | 0.42 | 6 | |||||
| 411 | NGC 4559 | -074-094 | 0.97 | 6 | |||||
| 412 | NGC 4559 | +135-092 | 0.76 | 6 | |||||
| 413 | NGC 4559 | +129-113 | 0.69 | 6 | |||||
| 414 | NGC 4559 | +128-112 | 0.69 | 6 | |||||
| 415 | NGC 4559 | +124-114 | 0.66 | 6 | |||||
| 416 | NGC 4559 | +102-153 | 0.58 | 6 | |||||
| 417 | NGC 4559 | +098-193 | 0.68 | 6 | |||||
| 418 | NGC 4559 | +095-191 | 0.67 | 6 | |||||
| 419 | NGC 4559 | -111+184 | 0.67 | 6 | |||||
| 420 | NGC 4559 | -116+187 | 0.69 | aaThe branch of this H ii region is ambiguous according to the criteria described in §4.2. | 6 | ||||
| 421 | NGC 4559 | -081+170 | 0.60 | aaThe branch of this H ii region is ambiguous according to the criteria described in §4.2. | 6 | ||||
| 422 | NGC 4559 | -085+173 | 0.61 | bbThe oxygen abundance of this H ii region is not defined according to the criteria described in §4.2. | bbThe oxygen abundance of this H ii region is not defined according to the criteria described in §4.2. | 6 | |||
| 423 | NGC 4559 | -077+167 | 0.59 | aaThe branch of this H ii region is ambiguous according to the criteria described in §4.2. | bbThe oxygen abundance of this H ii region is not defined according to the criteria described in §4.2. | 6 | |||
| 424 | NGC 4559 | +062-051 | 0.34 | 6 | |||||
| 425 | NGC 4559 | +041-074 | 0.26 | 6 | |||||
| 426 | NGC 4559 | -014-017 | 0.18 | 6 | |||||
| 427 | NGC 4559 | -016+004 | 0.11 | 6 | |||||
| 428 | NGC 4725 | +101+042 | 0.39 | 6 | |||||
| 429 | NGC 4725 | +050+125 | 0.43 | 6 | |||||
| 430 | NGC 4725 | -120-095 | 0.50 | 6 | |||||
| 431 | NGC 4725 | -066-127 | 0.45 | 6 | |||||
| 432 | NGC 4725 | -047-120 | 0.41 | 6 | |||||
| 433 | NGC 4725 | +040+124 | 0.42 | 6 | |||||
| 434 | NGC 4725 | +020+123 | 0.43 | 6 | |||||
| 435 | NGC 4725 | +122+010 | 0.49 | 6 | |||||
| 436 | NGC 4736 | HK8 | 0.12 | 1 | |||||
| 437 | NGC 4736 | HK45 | 0.10 | 1 | |||||
| 438 | NGC 4736 | HK52 | 0.12 | 1 | |||||
| 439 | NGC 4736 | HK53 | 0.13 | 1 | |||||
| 440 | NGC 4736 | +116-038 | 0.36 | 15 | |||||
| 441 | NGC 4736 | +123-055 | 0.40 | 15 | |||||
| 442 | NGC 4736 | +037+009 | 0.12 | 15 | |||||
| 443 | NGC 4736 | +037+003 | 0.11 | 15 | |||||
| 444 | NGC 4736 | +032-016 | 0.11 | 15 | |||||
| 445 | NGC 4736 | -029+014 | 0.10 | 15 | |||||
| 446 | NGC 4736 | -036-003 | 0.11 | 15 | |||||
| 447 | NGC 4736 | -038+009 | 0.12 | 15 | |||||
| 448 | NGC 4736 | -039+020 | 0.13 | 15 | |||||
| 449 | NGC 4736 | -039+017 | 0.13 | 4 | |||||
| 450 | NGC 4736 | +040+010 | 0.13 | 4 | |||||
| 451 | DDO 154 | H2 | 0.28 | 27 | |||||
| 452 | DDO 154 | H3 | 0.41 | 27 | |||||
| 453 | DDO 154 | H1 | 0.90 | 28 | |||||
| 454 | DDO 154 | H2 | 0.41 | 28 | |||||
| 455 | NGC 4826 | -006+016 | 0.09 | 15 | |||||
| 456 | NGC 4826 | -012+019 | 0.10 | 15 | |||||
| 457 | NGC 4826 | -017+020 | 0.11 | 15 | |||||
| 458 | NGC 4826 | +008+012 | 0.09 | 15 | |||||
| 459 | NGC 4826 | +015+011 | 0.11 | 15 | |||||
| 460 | DDO 165 | H4 | 0.55 | 11 | |||||
| 461 | NGC 5033 | +144-155 | 1.00 | 6 | |||||
| 462 | NGC 5033 | +028-215 | 0.68 | 6 | |||||
| 463 | NGC 5033 | +022-217 | 0.69 | aaThe branch of this H ii region is ambiguous according to the criteria described in §4.2. | bbThe oxygen abundance of this H ii region is not defined according to the criteria described in §4.2. | 6 | |||
| 464 | NGC 5033 | +052-097 | 0.41 | 6 | |||||
| 465 | NGC 5033 | -065+013 | 0.45 | 6 | |||||
| 466 | NGC 5033 | -065-001 | 0.46 | 6 | |||||
| 467 | NGC 5033 | -066-033 | 0.51 | 6 | |||||
| 468 | NGC 5033 | -014+028 | 0.11 | 6 | |||||
| 469 | NGC 5055 | -089-010 | 0.27 | 4 | |||||
| 470 | NGC 5055 | -112-034 | 0.40 | 4 | |||||
| 471 | NGC 5055 | +050-088 | 0.39 | 4 | |||||
| 472 | NGC 5055 | -165+034 | 0.45 | 4 | |||||
| 473 | NGC 5055 | -270+068 | 0.74 | 4 | |||||
| 474 | NGC 5194 | CCM10 | 0.47 | 29 | |||||
| 475 | NGC 5194 | CCM53 | 0.47 | 29 | |||||
| 476 | NGC 5194 | CCM54 | 0.49 | 29 | |||||
| 477 | NGC 5194 | CCM55 | 0.48 | 29 | |||||
| 478 | NGC 5194 | CCM57 | 0.47 | 29 | |||||
| 479 | NGC 5194 | CCM57A | 0.43 | 29 | |||||
| 480 | NGC 5194 | CCM71A | 0.71 | 29 | |||||
| 481 | NGC 5194 | CCM72 | 0.38 | 29 | |||||
| 482 | NGC 5194 | CCM84A | 0.38 | 29 | |||||
| 483 | NGC 5194 | P203 | 0.18 | 29 | |||||
| 484 | NGC 5194 | CCM6A | 0.10 | 29 | |||||
| 485 | NGC 5194 | CCM37A | 0.11 | 29 | |||||
| 486 | NGC 5194 | CCM45 | 0.26 | 29 | |||||
| 487 | NGC 5194 | CCM56 | 0.21 | 29 | |||||
| 488 | NGC 5194 | CCM107 | 0.17 | 29 | |||||
| 489 | NGC 5194 | CCM72 | 0.38 | 30 | |||||
| 490 | NGC 5194 | CCM10 | 0.47 | 30 | |||||
| 491 | NGC 5194 | CCM37a | 0.11 | 1 | |||||
| 492 | NGC 5194 | CCM10 | 0.47 | 1 | |||||
| 493 | NGC 5194 | CCM72 | 0.38 | 1 | |||||
| 494 | NGC 5194 | CCM55 | 0.48 | 1 | |||||
| 495 | NGC 5194 | CCM53 | 0.47 | 1 | |||||
| 496 | NGC 5194 | CCM84 | 0.25 | 1 | |||||
| 497 | NGC 5194 | CCM91 | 0.40 | 1 | |||||
| 498 | NGC 5194 | CCM71a | 0.71 | 1 | |||||
| 499 | NGC 5194 | CCM68 | 0.42 | 1 | |||||
| 500 | NGC 5194 | X | 31 | ||||||
| 501 | NGC 5194 | CCM72 | 0.38 | 31 | |||||
| 502 | NGC 5194 | CCM24 | 31 | ||||||
| 503 | NGC 5194 | CCM10 | 0.47 | 31 | |||||
| 504 | NGC 5194 | -007+061 | 0.18 | 4 | |||||
| 505 | NGC 5194 | -087-082 | 0.37 | 4 | |||||
| 506 | NGC 5194 | -137-182 | 0.71 | 4 | |||||
| 507 | NGC 5194 | -007-303 | 0.91 | 4 | |||||
| 508 | NGC 5408 | H1 | 32 | ||||||
| 509 | NGC 6822 | H12 | 0.20 | 33 | |||||
| 510 | NGC 6822 | HUBBLEIII SE RING | 0.98 | 33 | |||||
| 511 | NGC 6822 | HUBBLEIII NW ARC | 0.98 | 33 | |||||
| 512 | NGC 6822 | HUBBLEIII NW RING | 0.98 | 33 | |||||
| 513 | NGC 6822 | HUBBLEV BLUE | 0.73 | 33 | |||||
| 514 | NGC 6822 | KBETA BLUE | 0.88 | 33 | |||||
| 515 | NGC 6822 | KD22E | 0.72 | 33 | |||||
| 516 | NGC 6822 | KD28E BLUE | 0.08 | 33 | |||||
| 517 | NGC 6822 | HK16 | 0.58 | 33 | |||||
| 518 | NGC 6822 | HK42 | 0.62 | bbThe oxygen abundance of this H ii region is not defined according to the criteria described in §4.2. | bbThe oxygen abundance of this H ii region is not defined according to the criteria described in §4.2. | 33 | |||
| 519 | NGC 6822 | HK70 | 0.11 | bbThe oxygen abundance of this H ii region is not defined according to the criteria described in §4.2. | bbThe oxygen abundance of this H ii region is not defined according to the criteria described in §4.2. | 33 | |||
| 520 | NGC 6822 | H7 | 0.29 | aaThe branch of this H ii region is ambiguous according to the criteria described in §4.2. | 33 | ||||
| 521 | NGC 6822 | H12 | 0.20 | 33 | |||||
| 522 | NGC 6822 | HUBBLEV LOW | 0.73 | 33 | |||||
| 523 | NGC 6822 | KBETA LOW | 0.88 | 33 | |||||
| 524 | NGC 6822 | KD9 | 0.59 | 33 | |||||
| 525 | NGC 6822 | KD21 | 0.76 | 33 | |||||
| 526 | NGC 6822 | KD24 | 0.04 | bbThe oxygen abundance of this H ii region is not defined according to the criteria described in §4.2. | bbThe oxygen abundance of this H ii region is not defined according to the criteria described in §4.2. | 33 | |||
| 527 | NGC 6822 | KD25 | 0.26 | 33 | |||||
| 528 | NGC 6822 | KD28E LOW | 0.08 | 33 | |||||
| 529 | NGC 6822 | HUBBLEV | 34 | ||||||
| 530 | NGC 6822 | HUBBLEX | 34 | ||||||
| 531 | NGC 6946 | FGW6946A | 0.61 | 2 | |||||
| 532 | NGC 6946 | FGW6946B | 0.66 | 2 | |||||
| 533 | NGC 6946 | -008+066 | 0.22 | 4 | |||||
| 534 | NGC 6946 | +144-003 | 0.45 | 4 | |||||
| 535 | NGC 6946 | +182+103 | 0.61 | 4 | |||||
| 536 | NGC 6946 | -128+146 | 0.67 | 4 | |||||
| 537 | NGC 6946 | -245+055 | 0.81 | 4 | |||||
| 538 | NGC 6946 | -099-261 | 0.86 | 4 | |||||
| 539 | NGC 7331 | HK95 | 0.39 | 1 | |||||
| 540 | NGC 7331 | HK98 | 0.38 | 1 | |||||
| 541 | NGC 7331 | HK101 | 0.32 | 1 | |||||
| 542 | NGC 7331 | HK40 | 0.48 | 1 | |||||
| 543 | NGC 7331 | -032-016 | 0.36 | 15 | |||||
| 544 | NGC 7331 | -028+018 | 0.27 | 15 | |||||
| 545 | NGC 7331 | -028+013 | 0.28 | 15 | |||||
| 546 | NGC 7331 | -031+024 | 0.30 | 15 | |||||
| 547 | NGC 7331 | -034+037 | 0.32 | 15 | |||||
| 548 | NGC 7331 | -032+027 | 0.31 | 15 | |||||
| 549 | NGC 7552 | H1 | 35 | ||||||
| 550 | NGC 7793 | W11 | 0.96 | 36 | |||||
| 551 | NGC 7793 | -010+033 | 0.18 | 4 | |||||
| 552 | NGC 7793 | -075-024 | 0.31 | 4 | |||||
| 553 | NGC 7793 | -104+035 | 0.40 | 4 | |||||
| 554 | NGC 7793 | -173+102 | 0.78 | 4 | |||||
| 555 | NGC 7793 | +092+098 | 0.66 | 4 | |||||
| 556 | NGC 7793 | NUCLEUS | 0.00 | 36 | |||||
| 557 | NGC 7793 | W12 | 0.16 | 36 | |||||
| 558 | NGC 7793 | W2 | 0.26 | 36 | |||||
| 559 | NGC 7793 | W5 6 | 0.41 | 36 | |||||
| 560 | NGC 7793 | W13 | 0.66 | 36 | |||||
| 561 | NGC 7793 | DV132 | 0.81 | 36 |
Note. — (1-2) Unique H ii-region identification number and SINGS galaxy name; (3) H ii-region name as listed in the originating reference, if available; (4) Deprojected galactocentric radius normalized by the radius of the galaxy (see Table Optical Spectroscopy and Nebular Oxygen Abundances of the Spitzer/SINGS Galaxies); (5-7) Abundance-sensitive parameter and excitation parameters and (see §4.1) (8-9) Oxygen abundances derived using the KK04 and PT05 strong-line calibrations assuming the branch listed in Table 7, unless otherwise noted; (10) References to the literature from which the H ii-region line-ratios were taken (see Appendix B).
References. — (1) Bresolin et al. (1999); (2) Ferguson et al. (1998); (3) van Zee et al. (1998); (4) McCall et al. (1985); (5) Castellanos et al. (2002); (6) Zaritsky et al. (1994); (7) Storchi-Bergmann et al. (1996); (8) Lee & Skillman (2004); (9) Garnett et al. (1999); (10) Garnett et al. (1997); (11) Croxall et al. (2009); (12) Lee et al. (2003b); (13) Masegosa et al. (1991); (14) Skillman et al. (1989); (15) Oey & Kennicutt (1993); (16) Lee et al. (2003a); (17) Miller & Hodge (1996); (18) Guseva et al. (2000); (19) Garnett & Shields (1987); (20) Stauffer & Bothun (1984); (21) Kong & Cheng (2002); (22) Díaz et al. (2007); (23) Bresolin & Kennicutt (2002); (24) Ryder (1995); (25) Henry et al. (1994); (26) Shields (1991); (27) Kennicutt & Skillman (2001); (28) van Zee et al. (1997); (29) Bresolin et al. (2004); (30) Garnett et al. (2004b); (31) Diaz et al. (1991); (32) Stasińska et al. (1986); (33) Lee et al. (2006b); (34) Peimbert et al. (2005); (35) Storchi-Bergmann et al. (1995); (36) Edmunds & Pagel (1984).