Total ozone columns and vertical ozone profiles above Kiev in 2005-2008
Abstract
The study of total ozone columns above Kiev and variations of ozone concentrations in the troposphere at different altitudes above Kiev was carried out using ground-based Fourier Transform InfraRed (FTIR) spectrometric observations that are taken on a routine basis at the Main Astronomical Observatory of the National Academy of Sciences of Ukraine (MAO NASU). This study was performed within the framework of the international ESA-NIVR-KNMI OMI-AO project no. 2907 entitled OMI validation by ground-based remote sensing: ozone columns and atmospheric profiles during the time frame 2005–2008. The infrared FTIR spectral observations of direct solar radiation in the wavelength range of 2-12 micron as transmitted through the Earth’s atmosphere were performed during the months of April-October of each year. The aim of the project was the validation of total ozone columns and vertical ozone profiles as obtained by the Ozone Monitoring Instrument (OMI)) onboard of the NASA EOS-Aura scientific satellite platform. The modeling of the ozone spectral band shape near 9.6 microns was performing with the MODTRAN code and a molecular band model based on the HITRAN-2004 molecular database. The a-priori information for the spectral modeling consisted of water vapor and temperature profiles from the NASA EOS-Aqua-AIRS satellite instrument, stratospheric ozone profiles from the NASA EOS-Aura-MLS satellite instrument, TEMIS-KNMI climatological ozone profiles and surface ozone concentration measurements performed at the specific times of infrared spectra observations. The troposphere ozone variability was analyzed for two typical episodes: the spring episode of enhanced total ozone columns and the summer episode of enhanced surface ozone concentrations.
1Main Astronomical Observatory, National Academy of Sciences of the Ukraine,
27 Akademika Zabolotnoho St., 03680 Kiev, Ukraine
2Royal Netherlands Meteorological Institute (KNMI), The Netherlands
1 Introduction
The study of ozone and its variability in the Earth’s atmosphere is of critical importance to both the scientific world, to international policy makers and to the general public at large. The stratospheric ozone layer protects all living organisms on Earth from the harmful effects of excessive ultraviolet solar irradiation.
Close monitoring of the recovery of the global ozone layer as a result of the Montreal protocol and its amendments on limiting the release of ozone depleting substances has therefore become a subject of major attention in atmospheric sciences and high levels in society.
However, the growing presence of high concentrations of ozone in the lower part of the atmosphere, the troposphere, where it acts as a health hazardous air pollutant and also as an important greenhouse gas is an alarming and disturbing development. Tropospheric ozone is very toxic to air breathing organisms like humans and corrosive to the leaf surfaces of plants. This breathing-level ozone is formed by photochemical reactions of gaseous precursors of natural origin such as volatile organic compounds released by trees but also by anthropogenic sources such as exhaust emissions from motor vehicles and industrial enterprises. The observation of high concentrations of surface ozone over urbanized and industrialized regions on our blue marble planet is a clear indicator of substantial anthropogenic pollution of the air we breathe.
To identify the key processes in the stratospheric ozone budget, satellite soundings of the atmospheric abundance of the relevant trace gases have been routinely performed since the late 1970’s. These satellite observations allow us to determine the total ozone column and vertical profiles of ozone in the atmosphere, from the stratosphere down into the troposphere. Here ground-based observations serve the purpose of confirming the satellite data by means of validation and also complementing the satellite data by means of extending the tropospheric observations down to the surface where most satellite instruments have a reduced sensitivity. This is especially important to understand the role of local and regional sources and sinks of tropospheric ozone and its precursors. Such ground-based observations aid in studying the dynamic behavior of air pollutants and to verify the models describing the cross-boundary and intercontinental transport of air pollutants. These studies will also support the development of national and international policies aimed at reducing the precursors of tropospheric ozone and particularly breathing-level ozone, and reducing the effect of tropospheric ozone acting as a greenhouse gas on local and regional scales.
In our previous publications Shavrina et al., 2007, Shavrina et al., 2008 the results of our observations on total ozone column during the time frame 2005-2007 and the retrieval of tropospheric ozone profiles over Kiev in 2007 was described . This work was further expanded and improved in 2008 and here we summarize the results of our research performed during the time frame 2005-2008.
2 Ground based FTIR ozone observations
Ground-based observations of strong and weak absorption lines in the electromagnetic spectrum of direct solar radiation transmitted through the Earth’s atmosphere to the surface are routinely made at the Main Astronomical Observatory of National Academy of Sciences Ukraine with the Fourier Transform InfraRed spectrometer (FTIR model Infralum FT 801, [Egevskaya, Vlasov, Bublikov, 2001]). This particular instrument was optically redesigned for the study of atmosphere pollution in the Kiev metropolitan area [Shavrina et al., 2007]. The working spectral range of the Fourier spectrometer is 2-12 microns (equivalent to 800-5000 with a best spectral resolution of ~1.0. Recording software for the acquisition of the spectra allows us to average 2-99 individual spectra during one observation period. Here we averaged over 4 single spectra which spans a 120-180 seconds time frame as was recommended by the industrial developers of the spectrometer to avoid the effects of atmospheric instability at longer exposures. The averaged spectra have signal to noise ratio S/N = 150-200 which is more than sufficient for our purposes.
3 Satelite based ozone observations
The Ozone Monitoring Instrument OMI [Levelt et al., 2006] is a contribution of the Netherlands’s Agency for Aerospace Programs (NIVR) in collaboration with the Finnish Meteorological Institute (FMI) to the NASA EOS-Aura satellite platform [Schoeberl et al., 2006] launched in July 2004. The OMI instrument currently continues the global total ozone column measurements recorded by the NASA Total Ozone Mapping Spectrometer (TOMS) instruments since 1978. A series of TOMS instruments was operative on the Nimbus-7 (1978-1993) and Earth Probe (EP) (1996-2005) satellite platforms. The OMI instrument is a nadir viewing wide swath UVVIS hyperspectral spectrometer measuring solar light reflected and backscattered from the Earth’s atmosphere and surface in the wavelength range from 270 nm to 500 nm with a spectral resolution of 0.45 nm in the ultraviolet and 0.63 nm in the visible. The instrument has a 2600 km wide viewing swath and is capable of daily, global contiguous mapping of various atmospheric trace gases, clouds, surface UV radiance levels and particulate atmospheric species with an unprecedented high spatial resolution of 13x24 at nadir. The OMI total ozone column data used in this work were obtained from the OMI-TOMS algorithm which is based on the long-standing NASA TOMS V8 retrieval algorithm [Bhartia and Wellemeyer, 2002] and the OMI-DOAS algorithm developed at Royal Dutch Meteorological Institute (KNMI) [Veefkind et al., 2006] which is based on the Differential Optical Absorption Spectroscopy (DOAS) technique. A detailed analysis of the similarities and differences between OMI-TOMS and OMI-DOAS total ozone column data can be found in the recent work of Kroon et al. [2008]. Here both OMI ozone products are obtained in the new version of the OMI level 1 (radiance and irradiance) and level 2 (atmospheric data products) data set named collection 3. Please visit the NASA DISC at http://disc.gsfc.nasa.gov/Aura/OMI/ for EOS Aura OMI level 2 orbit data. Please visit the Aura Validation data Center at http://avdc.gsfc.nasa.gov for EOS-Aura OMI station overpass data. Please consult the OMI README files for the latest OMI data product information.
4 Spectral modeling and analysis
The estimates of total ozone columns (TOC) in the Earths atmosphere were obtained using a simulation of the ozone absorption spectrum at 9.6 microns with the radiative transfer code MODTRAN4.3 [Bernstein et al., 1996]. The program calculates the transmission of electromagnetic radiation of solar origin through the modeled atmosphere and its subsequent reflection on the surface in the frequency range from 0 to 50000 cm-1. The program employs a two-parameter (temperature and pressure) model of molecular spectral absorption, which is calculated with the molecular database HITRAN (http://www.cfa.harvard.edu/hitran/) containing molecular spectral absorption lines. To calculate the band model, data for 12 light gaseous molecules (H2O, CO2, O3, CO, CH4, O2, NO, SO2, NO2, N2O, NH4 and HNO3) from the HITRAN data base were used, and for heavy molecules - CFC (9 molecules) and CLONO2 , HNO4, CCl4 and N2O5 the calculated absorption cross section (see [Bernstein et al., 1996]) were applied. With the program MODTRAN4.3 the spectrum of solar radiation is calculated that is to be received by the FTIR instrument on the ground depending on its viewing geometry. The calculations were performed in the approximation of local thermodynamic equilibrium (LTE) for the moderate spectral resolution of 2 cm-1 which corresponds almost exactly to our observed spectra. The model parameters have been calculated by us using the database HITRAN-2004 [Rothman et al., 2005].
To construct the a-priori atmospheric profiles of ozone, temperature and water vapor we employed here (i) the observation of surface ozone concentrations as measured by the ground-based ultraviolet ozonometer TEI-49i that is located near to the Fourier spectrometer detecting breathing-level ozone, (ii) data of the NASA Atmospheric Infrared Sounder (AIRS) satellite instrument (http://avdc.gsfc.nasa.gov/Data/AIRS/) flying on board of the NASA EOS-Aqua satellite, and data of the Microwave Limb Sounder (MLS) satellite instrument (http://avdc.gsfc.nasa.gov/Data/Aura/) flying on board of the NASA EOS-Aura satellite. For the analysis of our observations of 2007-2008, we used MLS data version v2.2, the higher accuracy of which has enabled us to develop a new method of ozone profile analysis: we are now varying the input profile of the tropospheric ozone only, where we only scale the stratospheric profile by a certain factor within the specified accuracy of MLS (2-5% in the layers of the pressure 216-0.02 hPa) without modifying its overall shape. A detailed description of our method for determining detailed tropospheric and stratospheric concentrations of ozone can be found in [Shavrina et al., 2007, Shavrina et al., 2008]. The result of the analysis is the best fit of the model spectrum to the observed spectra of the ozone band, from which we obtained the best estimates of the tropospheric vertical profiles of ozone, the total column amount of ozone in the troposphere and finally the total column amount of ozone in the atmosphere.
5 Results
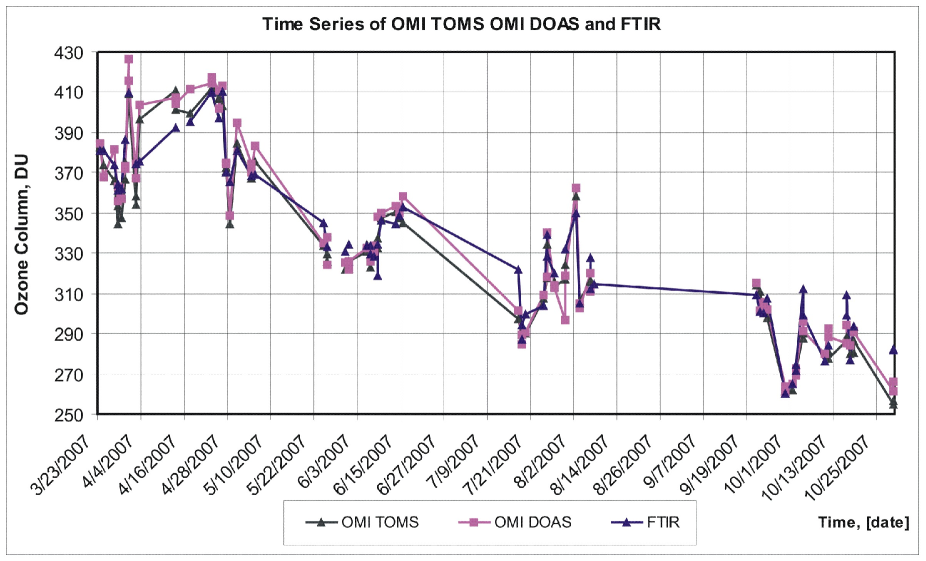
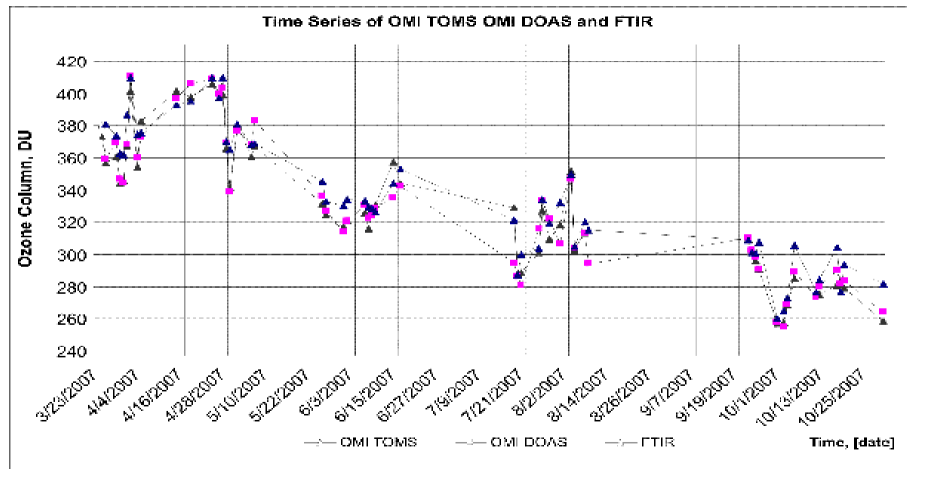
The results of the comparison of the OMI collection 2 satellite and FTIR ground-based total ozone column observations and first examples of the retrieved vertical ozone profiles as obtained during the time frame 2005-2007 were already presented in [Shavrina et al., 2007, Shavrina et al., 2008]. In the summer of 2008 a new version of all the OMI data became available, named collection 3 and short-named COL3. In Figure 1 we show a comparison of our ground-based results for the year 2007 with Aura-OMI data of collection 2 for the two algorithm versions available, OMI-TOMS and OMI-DOAS, respectively. The OMI collection 2 total ozone column data for the year 2007 is on average very close the ground-based observations, albeit with substantial standard deviations. The average difference of satellite minus ground-based amounts to -0.33 DU and -4.32 DU for OMI-DOAS and OMI-TOMS collection 2 data products respectively, with 10.66 DU and 10.88 DU standard deviations (1.35 DU and 1.39 DU standard errors). The OMI collection 3 total ozone column data for the year 2007 is on average not so close the ground-based observations, albeit with lesser standard deviations. The results are shown in Figure 2. The average difference of satellite minus ground-based amounts to -6.63 DU and -7.54 DU for OMI-DOAS and OMI-TOMS data products respectively, with a 9.06 DU and 9.00 DU standard deviations (1.31 DU and 1.25 DU standard errors). Destriping of the OMI data towards collection 3 has substantially reduced the standard deviations of validation comparisons against reference data but has substantially increased the bias.
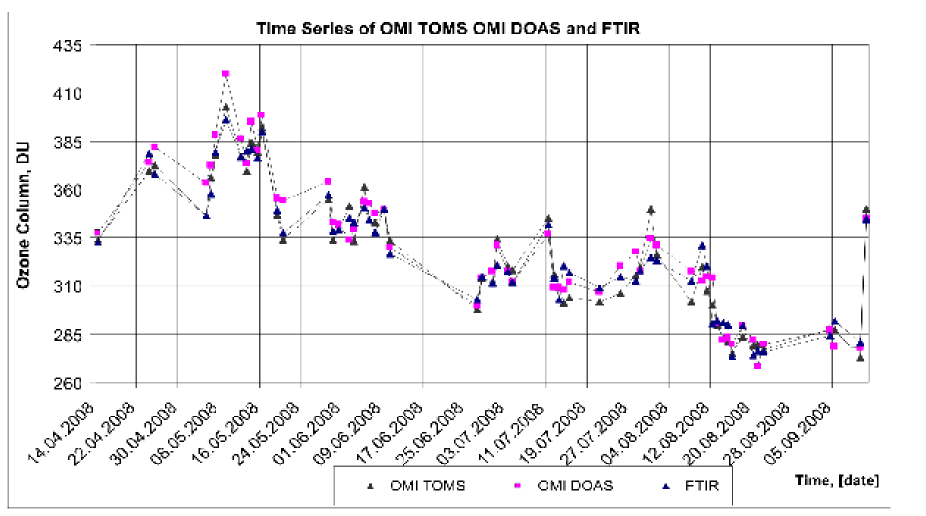
Figure 3 presents a comparison of our ground-based estimates of total ozone columns with OMI-DOAS and OMI-TOMS TOC satellite data for the year 2008. The average difference between satellite and ground-based observations is 0.29 DU and 2.85 DU for the OMI-TOMS and OMI-DOAS data products, respectively, with standard deviations of about 9 DU. Here the standard errors are equal to 0.99 and 1.18 DU, respectively (see Table 1). The correlation coefficient is 0.97 in both cases. In table 1 we present a comparison of our results with OMI for the entire observation period 2005-2008, which shows that the obtained accuracy meets the requirements for validation (3.0%, see [Shavrina et al., 2007]). More details can be found in our before mentioned publications.
6 Tropospheric ozone profiles
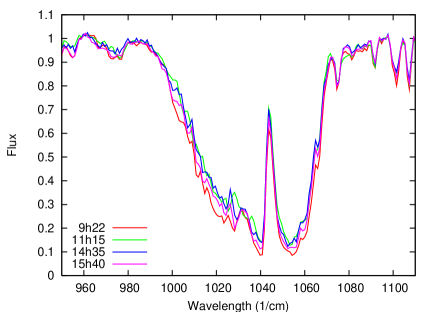
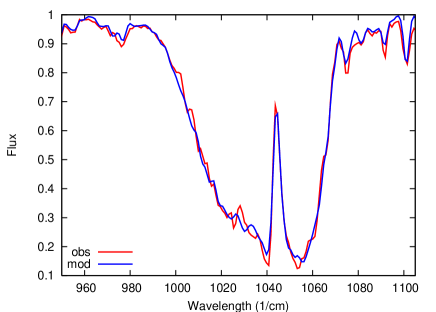
In a previous publication [Shavrina et al., 2008] we examined the variability of tropospheric ozone profiles for carefully selected episodes of 2007, each of which demonstrated a characteristic and different ozone situation. Two separate spring episodes showed an increased total and tropospheric ozone abundance, one of which episodes probably represents the occurrence of a stratospheric intrusion, i.e., the intrusion of stratospheric air masses with a much higher concentration of ozone dwelling down into the troposphere. The following summer episode demonstrated high concentrations of ground-level ozone probably due to the photochemical production of ozone, and a subsequent autumn episode that showed a much lower total ozone amount over Kiev of only 260.2 DU which is getting pretty close to the upper limit of the so-called ozone hole (220 DU). For the purpose of this study presented in this paper we have closely analyzed the changes of daytime ozone profiles for a set of selected days during these episodes. In Figure 4 we show the spectra observed during the daytime of the 23rd of April 2007. This figure also shows the best fit of our modeled spectra to the FTIR spectrum observed at 11h15m local time. On this particular day, the total ozone column amounted to 411.0 DU, as recorded by the FTIR and the tropospheric ozone column amounted to 48 DU [Shavrina et al., 2008], which both were very high. Please note that the highest value of the total ozone column in 2007 over Kiev was recorded on April 22nd and measured 448 DU as revealed by the OMI satellite data. Figure 5 shows the retrieved vertical profiles of atmospheric ozone for the time frame of April 23-28, 2007 for the moments of observations with a maximum solar elevation. Figure 5 reveals strong changes in the ozone abundance with altitude but contains too little information to reveal the intricate details of the intrusions process. Subsequently, in Figure 6 we plot all the recorded profiles as a function of time where we clearly see the intrusion of the stratospheric ozone rich air into the troposphere, its sinking during the time frame 23-26 April and a further dissipation and sinking to almost the surface during the 26th-28th of April. Please note the high level of detail presented in this one-week plot revealing the temporal and vertical spatial resolution and high accuracy of our ground-based method that can be achieved on a continuous basis. We believe that the daytime FTIR ozone profiles clearly reveal the intricate dynamics of the ozone layer caused by the intrusion of stratospheric ozone rich air to the lower altitude troposphere layers on April 23rd and its sinking and dissipation over the course of the following few days.
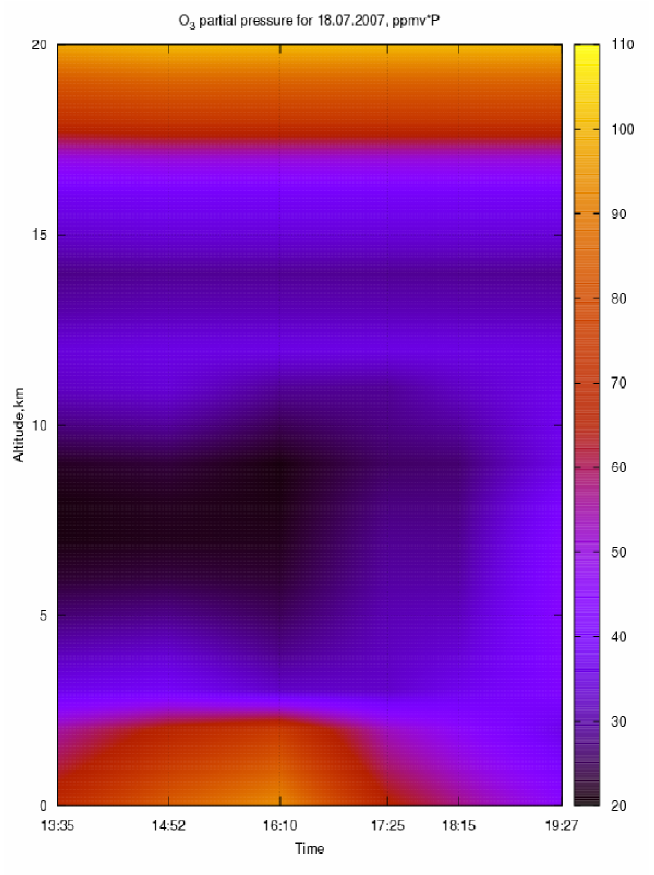
Figure 7 shows the reconstructed profiles of atmospheric ozone for the 18th of July 2007 recorded at 13h35m, 14h52m, 16h10m, 17h10m, 18h15m and 19h27m of local time. The enhanced abundance of ozone in the lower troposphere close to the surface, the high values of surface ozone concentrations and their daily dynamics are typical for the summer episodes of high ozone concentration in the troposphere due to photochemical processes. Note that on this day the total ozone column amount is rather low (291.5 DU). Figure 8 shows one day (at July 18, 2007) in our summer episode of continuous data, revealing photochemical production of ozone in the surface layers of our polluted urban atmosphere. Please note the high level of detail presented in this single day plot revealing the vertical resolution and accuracy of our ground-based method that can be achieved on a daily basis.
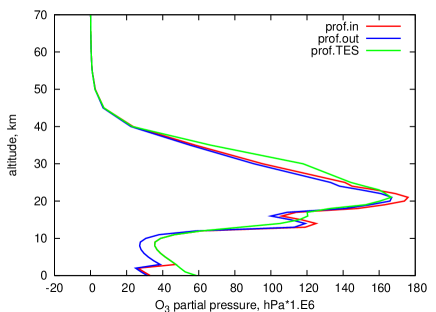
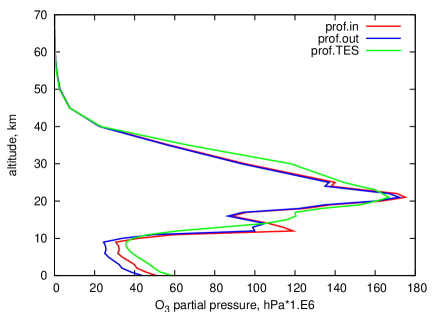
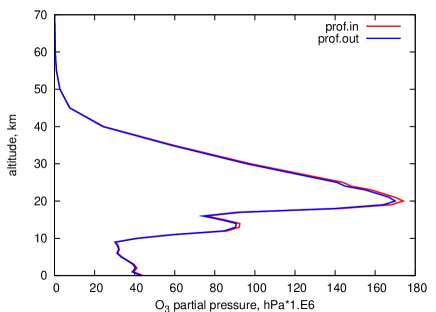
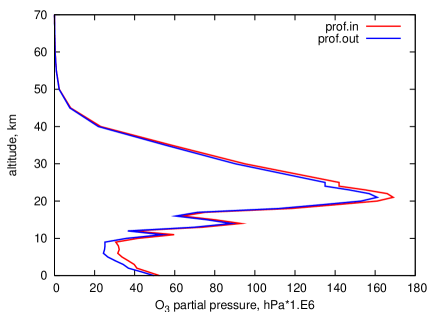
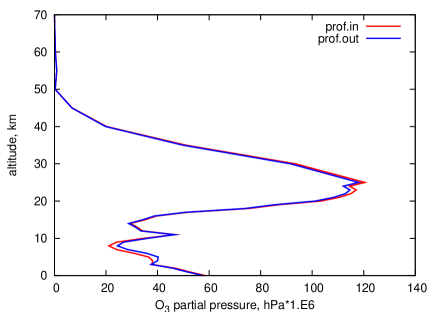
In the course of 2008 the final operational Aura-OMI data set of atmospheric vertical ozone profiles, labeled OMO3PR, became publically available and we compared them with our retrieved profiles for validation. A first comparison of the satellite ozone profile data set to our ground-based ozone profile data set is shown in the left hand side image of Figure 9 and it shows rather large differences between the profiles particularly for the tropospheric pressure layers. The surface ozone concentrations as reported in our ground-based retrieved ozone profiles are fixed by the simultaneous in-situ measurements of surface ozone concentrations as performed at the MAO NASU with the ozonometer. With the OMI satellite instrument being rather blind to the lowest layers of the atmosphere the satellite data retrieval algorithm tends to use the ozone concentration in the lowest - say tropospheric - pressure layers as an additional degree of freedom to increase the quality of the spectral fit, however, leading to large overestimations of the tropospheric ozone concentrations. Other validation studies confirmed these large deviations and hence the algorithm was redesigned. The latest version of the OMO3PR data set became available on 09 September 2009 and this data set complies much better with our ground-based data set. As an example, the fit of the latest OMO3PR data to our retrieved ozone profile for April 23, 2007 as shown in the right hand side image of Figure 9 looks very promising.
7 Conclusion
During the time frame 2005-2008 we have obtained an elaborate data set of total ozone column and vertical ozone profile estimates from our ground-based observations with the optically adapted Fourier Transform InfraRed spectrometer. Our estimates of total ozone are in a good agreement with the satellite-based EOS Aura-OMI total ozone columns. The differences are in the range of a few percent, which meets the validation requirements. The analysis of our retrieved ozone profiles was performed for two representative cases of the tropospheric ozone dynamics: a spring episode of high total ozone and a summer episode of photochemical ozone production. We noted also a fall episode of low total amount of stratospheric ozone. We firmly believe that the high vertical and temporal resolution of our daytime FTIR observations enables us to clearly observe the intricate dynamics of the ozone layer caused by the intrusion of stratospheric ozone rich air to the lower altitude troposphere layers on April 23rd and its sinking and dissipation over the course of the following few days. We also firmly believe that the daytime FTIR ozone profiles are accurate enough to clearly show the occurrence of high tropospheric ozone concetrations near the surface as a results of photochemical processes in response to increased air pollution. A first quantitative comparison of our retrieved vertical ozone profiles with the data Aura-OMI OMO3PR indicated some significant differences for the lower troposphere. However, the fit of the latest version of the publically available OMO3PR data set to our retrieved ozone profile for April 23 2007 looks very promising. Please note that the reported values of surface ozone concentrations in our retrieved ozone profiles are originating from the in-situ measurements of surface ozone concentrations as performed at the MAO NASU and hence are fixed by true observations. More attention will be given to this work in the near future with the complete OMO3PR data set now available. However, any airplane or lidar measurements of ozone at different altitudes over Kiev, which could be arbitral, are absent at the time of writing.
Our methodology could in principle be used for any FTIR observatinal station allowimg for a better characterization of the horizontal and vertical dynamics of the ozone layer world wide from ground-based observations alone.
8 Acknowledgements
The authors thank the administrations of the AVDC, Aura-MLS, Aura-TES and Aqua-AIRS web sites for the provision of the necessary satellite data of the respective atmosphere soundings. The work was partially supported by a grant STCU (2005-2007) and the Space Agency of Ukraine (2007-2008).
References
- [1] Bernstein L. S., Berk A., Acharya P. K., Robertson D. C., Anderson G. P., Chetwynd J. H., Kimball L. M. Very Narrow Band Model Calculations of Atmospheric Fluxes and Cooling Rates. Journal of Atmospheric Sciences. 1996 , Vol.53, P.2887–2904.
- [2] Bhartia P. K., Wellemeyer C. TOMS-V8 Total O3 Algorithm, OMI ATBD, Volume II, OMI Ozone Products, ATBD-OMI-02, edited by P. K. Bhartia, pp. 15- 31, NASA Goddard Space Flight Cent., Greenbelt, Md. (Available at
- [3] Egevskaya T. B., Vlasov A. M., Bublikov A. V. Infrakrasnyj Fur’e-spectrometr ”Infralum FT-801. Nauka Proizvodstvu. 2001. n.12, P.38–41.
- [4] Kroon, M., J. P. Veefkind, M. Sneep, R. D. McPeters, P. K. Bhartia, and P. F. Levelt (2008), Comparing OMI-TOMS and OMI-DOAS total ozone column data, J. Geophys. Res., 113, D16S28, doi:10.1029/2007JD008798.
- [5] Levelt P. F., G. H. J. van den Oord, Dobber M. R. et al. The Ozone Monitoring Instrument, IEEE Trans. Geosc. Rem. Sens., 2006, Vol. 44 (5). - P.1093–1101.
- [6] Levelt P. F., Hilsenrath E., Leppelmeier G. W., van den Oord G. H. J., Bhartia P. K., Tamminen J., de Haan J. F., Veefkind J. P. Science Objectives of the Ozone Monitoring Instrument. IEEE Trans. Geosc. Rem. Sens. 2006, Vol.44 (5), P.1199–1208.
- [7] OMI README http://disc.gsfc.nasa.gov/Aura/OMI/.
- [8] Rothman L. S., Jasqumart D., et al. The HITRAN 2004 molecular spectroscopic database. Journal of Quantitative Spectroscopy & Radiative Transfer. 2005, Vol.96, P.139–204.
- [9] Schoeberl M. R., Douglass A. R., Hilsenrath E., Bhartia P. K., Beer R., Waters J. W., Gunson M. R., Froidevaux L., Gille J. C., Barnett J. J., Levelt P. F., and P. DeCola. Overview of the EOS Aura Mission. IEEE Trans. Geosc. Rem. Sens. 2006, Vol.44 (5), P.1066–1074.
- [10] Shavrina A.V., Pavlenko Ya. V., Veles A. et al.,. Ozone columns obtained by ground-based remote sensing in Kiev for Aura Ozone Measuring Instrument validation // J. of Geophys. Res.-2007.- 112.- D24S45, doi:10.1029/2007JD008787.
- [11] Shavrina A.V., Pavlenko Ya. V., Veles A., Sheminova V.A., Syniavskyi I., Sosonkin M.G., Romanyuk Ya.O.,Eremenko N.A., Ivanov Yu.C., Monsar O.A., Kroon M. Obshchee soderzhanie ozona v troposfere i troposfernye profile ozona nad Kievom v 2007 godu . Kosmichna nauka i tekhnologiya, 2008, v.14, N 5, pp.85-94 (in English - Tropospheric ozone columns and ozone profiles over Kiev in 2007. Space Science and Technology, J. of Space Agency and NAS of Ukraine).
- [12] Veefkind J. P., de Haan J. F., Brinksma E. J., Kroon M., Levelt P. F., Total ozone from the Ozone Monitoring Instrument (OMI) using the OMI-DOAS technique. IEEE Trans. Geosc. Rem. Sens. 2006, Vol.44 (5), P.1239–1244.


| Year | 2005 | 2006 | 2007 | 2007 | 2008 |
|---|---|---|---|---|---|
| (old OMI data) | (new OMI data) | ||||
| Mean | 3.19 / 8.45 | -0.25 / 0.37 | -4.32 / -0.33 | -7.54 / -6.63 | -0.29 / 2.85 |
| Standard Error | 2.53 / 1.98 | 0.68 / 1.11 | 1.39 / 1.35 | 1.25 / 1.31 | 0.99 / 1.18 |
| Median | 1.45 / 10.70 | 0.115 / 0.16 | -2.98 / -0.05 | -7.59 / -4.09 | 0.57 / 3.51 |
| Standard Deviation | 13.41 / 10.50 | 5.37 / 8.77 | 10.88 / 10.66 | 9.00 / 9.06 | 7.52 / 8.88 |
| Count | 28/28 | 62 / 62 | 61 / 62 | 52 / 54 | 57 / 57 |
| Slope | 0.68 / 0.94 | 1.03 / 1.07 | 0.91 / 0.88 | 0.95 / 0.93 | 0.93 / 0.88 |
| Correlation | 0.60 / 0.76 | 0.98 / 0.96 | 0.97 / 0.98 | 0.98 / 0.98 | 0.97 / 0.97 |
| R-squared | 0.36 / 0.57 | 0.97 / 0.92 | 0.94 / 0.95 | 0.95 / 0.95 | 0.95 / 0.94 |