IRAS 22198+6336: Discovery of an Intermediate-Mass Hot Core
Abstract
We present new SMA and PdBI observations of the intermediate-mass object IRAS 22198+6336 in the millimeter continuum and in several molecular line transitions. The millimeter continuum emission reveals a strong and compact source with a mass of and with properties of Class 0 objects. CO emission shows an outflow with a quadrupolar morphology centered on the position of the dust condensation. The CO outflow emission seems to come from two distinct outflows, one of them associated with SiO outflow emission. A large set of molecular lines has been detected toward a compact dense core clearly coincident with the compact millimeter source, and showing a velocity gradient perpendicular to the outflow traced by CO and SiO. The chemically rich spectrum and the rotational temperatures derived from CH3CN and CH3OH (100–150 K) indicate that IRAS 22198+6336 is harbouring one the few intermediate-mass hot cores known at present.
Subject headings:
stars: formation — ISM: individual objects (IRAS 22198+6336) — ISM: lines and bands — radio continuum: ISM1. Introduction
Early stages of massive star formation have numerous observational signatures, including molecular masers and outflows, sub-millimeter continuum sources, hot molecular cores, and hyper/ultracompact HII regions. Hot molecular cores (HMCs), first discovered in the vicinity of massive protostars (see Kurtz et al. 2000 for a review), are compact ( pc, cm-3) objects with relatively high temperatures ( K) that show a very rich chemistry in complex organic molecules (CH3CN, CH3OH, CH3OCHO,…).
Recently, regions characterized by high temperatures and densities have also been detected around low-mass protostars (see Ceccarelli 2004 for a review). These so-called hot corinos share many characteristics with HMCs, although the former are times less massive. Many questions remain unanswered regarding both the high-mass and low-mass hot core phase. For example, HMCs are relatively large objects ( 0.1 pc) and harbor clusters of stars, while hot corinos seem to be smaller molecular envelopes surrounding a single low-mass young stellar object (YSO) or binary. Additionally, although HMCs are generally understood to be illuminated by the newly born high-mass stars embedded within the cores themselves (Cesaroni 2005), an alternative scenario has been proposed for hot corinos, in which jets and shocks are responsible for enhancing the temperature and the abundances of many species (Chandler et al. 2005).
Intermediate-mass YSOs (IMYSOs; –8 ) are excellent targets to study the different hot core heating mechanisms (radiative or shocks), because they share some properties of massive stars, such as their association with clusters and their ability to photodissociate and ionize the surrounding gas, and present the advantages of being located closer ( kpc) than most of the massive star-forming regions, and in regions of less complexity. However, there are only two IMYSOs with hot core emission reported in the literature, NGC 7129-FIRS 2 and IC 1396 N (Fuente et al. 2005, 2009), and few conclusions can be inferred from such a small number of intermediate-mass hot cores (IMHCs).
IRAS 22198+6336 (hereafter I22198) is an IMYSO located at a distance of 764 pc (Hirota et al. 2008) with a bolometric luminosity of 370 . The presence of a strong and compact submillimeter dust condensation (Jenness et al. 1995) with no near-infrared nor mid-infrared emission suggests that it is a deeply embedded object, classified as an intermediate-mass Class 0 source by Sánchez-Monge et al. (2008). Single-dish telescope observations reveal a CO outflow well centered on the position of the dust condensation (Zhang et al. 2005). Sánchez-Monge et al. (2008) detect slightly resolved partially optically thick centimeter emission consistent with a thermal ionized wind (or radiojet). Additionally, NH3 and CS dense gas emission together with H2O and OH maser emission has been detected toward I22198 (Tafalla et al. 1993; Larionov et al. 1999; Valdettaro et al. 2002; Edris et al. 2007; Hirota et al. 2008), all indicative of a very early evolutionary stage.
In this letter, we present new interferometric continuum and molecular line observations that reveal that I22198 is associated with an intermediate-mass hot core.
 |
 |
2. Observations
We observed the I22198 region with the Submillimeter Array (SMA111The SMA is a joint project between the Smithsonian Astrophysical Observatory and the Academia Sinica Institute of Astronomy and Astrophysics, and is funded by the Smithsonian Institution and the Academia Sinica.; Ho et al. 2004) in the 1.3 mm (230 GHz) band using the compact array configuration on 2008 June 11. The phase center was , and , and the projected baselines ranged from 7 k to 100 k. The two sidebands of the SMA covered the frequency ranges of 219.4–221.4 GHz and 229.4–231.4 GHz, with a spectral resolution of km s-1. System temperatures ranged between 200 and 300 K. The zenith opacities at 225 GHz were around 0.15 and 0.20 during the track. The FWHM of the primary beam at 1.3 mm was ″. Bandpass calibration was performed by observing the quasar 3C454.3. Amplitude and phase calibrations were achieved by monitoring 0019+734 and 1928+739, resulting in an rms phase of °. The absolute flux density scale was determined from Callisto and Jupiter with an estimated uncertainty around 15%. Data were calibrated and imaged with the MIRIAD software package. The continuum was constructed in the (u,v) domain from the line-free channels. Imaging was performed using natural weighting, obtaining a synthesized beam of with a P.A.=50°, and 1 rms of 80 mJy beam-1 per channel, and 3.9 mJy beam-1 for the continuum.
The IRAM Plateau de Bure Interferometer (PdBI222The Plateau de Bure Interferometer (PdBI) is operated by the Institut de Radioastronomie Millimetrique (IRAM), which is supported by INSU/CNRS (France), MPG (Germany), and IGN (Spain).) was used to observe the CO (1–0) (115.12 GHz) and SiO (2–1) (86.85 GHz) molecular transitions toward I22198. We carried out 2-pointing mosaic observations (primary beam″), in 2008 and 2009, with the array in the C and D configurations. The two spectral setups, tuned at 115.27 GHz (2.7 mm) and at 86.85 GHz (3.5 mm), include several molecular transitions, which will be presented in a forthcoming paper (Sánchez-Monge et al., in prep.). For the CO and SiO we used a correlator unit of 40 MHz of bandwidth with 512 spectral channels, which provides a spectral resolution of km s-1. A number of 320 MHz continuum units were used to image the continuum, six at 115 GHz and three at 86 GHz. The typical system temperatures for the receivers were K at 115 GHz and K at 86 GHz. Bandpass calibration was performed by observing 3C273 and 3C454.3. Amplitude and phase calibrations were achieved by monitoring 0116+731, 1928+738 and 2037+511, resulting in a phase rms of around °. The absolute flux density scale was determined from MWC349 and 3C84, with an estimated uncertainty around 25%. The data were calibrated with the program CLIC, and imaged with MAPPING, both parts of the GILDAS333GILDAS: Grenoble Image and Line Data Analysis System, see http://www.iram.fr/IRAMFR/GILDAS. software package. Imaging was performed using natural weighting, obtaining a synthesized beam of , with a P.A.=107° at 115 GHz, and , with a P.A.=81° at 87 GHz. The 1 rms for the channel and continuum images were and m at 115 GHz, and and m at 87 GHz, respectivelly.
3. Results
3.1. Continuum results
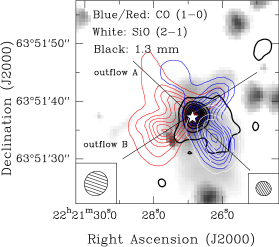
In Figure 1 (left panel) we show the interferometric millimeter continuum map toward I22198 (black contours). We detected a compact source (with coordinates and ) coincident with the centimeter source reported by Sánchez-Monge et al. (2008), and surrounded by a faint structure extended toward the southwest. The source is clearly detected at 3.5, 2.7, and 1.3 mm with integrated flux densities of mJy, mJy, and mJy, respectively, and has a similar morphology at the three wavelengths. The deconvolved size of the source is , with P.A.=°, corresponding to AU. The millimeter continuum emission is likely tracing the dust envelope of I22198.
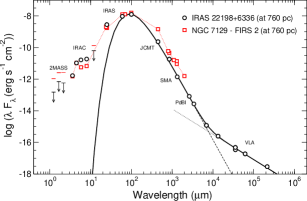
The spectral energy distribution (SED) reported by Sánchez-Monge et al. (2008) has been improved with the new continuum data. We also included the fluxes between 3.6 m and 8.0 m extracted from the Spitzer Space Telescope Infrared Array Camera (IRAC) maps (PI: Giovanni Fazio, project: 40147). We retrieved the images using the Leopard444http://ssc.spitzer.caltech.edu/warmmission/propkit/spot/ software, and evaluated the fluxes using the MOPEX555http://ssc.spitzer.caltech.edu/dataanalysistools/tools/mopex/ software. The global SED (open circles in Fig. 2) was fitted by a modified blackbody law plus a thermal ionized wind (with a spectral index of at centimeter wavelengths). Assuming a dust mass opacity coefficient given by with cm2 g-1 at GHz (Ossenkopf & Henning 1994), the SED is well fitted with a dust emissivity index of , a dust temperature of K, and an envelope mass of . As shown in Fig. 2, the SED of I22198 resembles that of Class 0 objects (André et al. 1993).
 |
3.2. Molecular results
Interferometric 12CO (1–0) (Fig. 1 left) and 12CO (2–1) (Sánchez-Monge et al., in prep.) maps reveal an outflow with a quadrupolar morphology clearly centered on the position of the dust condensation. The outflow emission spans a velocity range from km s-1 to km s-1 for the transition (the systemic velocity is km s-1). The quadrupolar morphology of the outflow can be interpreted as the walls of a single outflow or as the superposition of two bipolar outflows: outflow A in the southwest-northeast direction, and outflow B in the northwest-southeast direction. Both outflows are centered on the position of the millimeter continuum source, which could be a millimeter clump harbouring at least two sources. In fact, higher angular resolution observations (0.4” or 300 AU) with the PdBI at 1.3 mm reveal a strong source with indications of a faint extension to the south (Palau et al., in prep.). In the following, we will assume the two outflow interpretation. We estimated the physical parameters of outflows A and B (see Table 1) and found values similar to the outflow parameters found in other IMYSOs (e. g., IC 1396 N: Beltrán et al. 2002; IRAS 22272+6358 A: Beltrán et al. 2006). The integrated SiO (2–1) emission, spanning a velocity range from to km s-1, is shown in white contours in Fig. 1. This emission coincides with the blueshifted lobe of outflow A. No redshifted counterpart is observed for the SiO emission, however. The detection of SiO in outflow A suggests that it is younger than outflow B, because gas-phase SiO abundances may decrease with time (Klaassen & Wilson 2007; Shang et al. 2006). The SiO detection also suggests that the CO quadrupolar morphology arises from two distinct outflows, because SiO generally traces material associated with the primary jet driving the outflow rather than the walls of the outflow cavity (e. g., H211: Palau et al. 2006; Lee et al. 2007). We also note that the IRAC 4.5 m band (grey scale in Fig. 1 left) shows extended emission (“green fuzzy”) associated mainly with the blueshifted CO outflow lobes. Such 4.5 m extended emission is thought to be associated with shocked H2 emission (De Buizer & Vacca 2010).
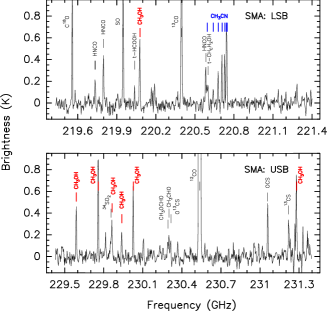 |
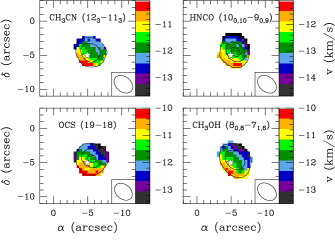
The wide-band SMA spectrum toward I22198 (Fig. 3) reveals a chemically rich dense core with typical hot core features (e. g., Cesaroni et al. 1999; Gibb et al. 2000). Molecular line transitions detected with K have been identified and imaged. We note that the linewidths observed for most of the molecules are 5–8 km s-1. Figure 1 (right panel) shows the maps of high-density tracers with a compact source (, with °) at the position of the millimeter continuum source. Although the maps of each molecule show a source barely resolved, and higher angular resolutions should be made, first-order moment (velocity field) maps for these high-density tracers (Fig. 1 right) show velocity gradients in the northwest-southeast direction, perpendicular to outflow A, presumable the youngest outflow. Most of these molecules trace disks and/or toroids in other massive YSOs (e. g., Beltrán et al. 2006). However, the presence of outflow B perpendicular to outflow A makes the interpretation of these velocity gradients uncertain. Assuming that these gradients trace rotation, the dynamical mass has been calculated from the expression , where is the velocity estimated from the gradient, the radius of the core, the gravitational constant, and the inclination angle assumed to be 90° (edge-on). In our case, with km s-1 and ″ for the four molecules shown in Fig. 1 right, the dynamical mass is . Additionally, following the models of Palla & Stahler (1993), and assuming a luminosity for the object of (Fig. 2), the mass of the embedded YSO is about 4–5 . Thus, the mass of the internal YSO estimated from both methods is , which is similar to the dust envelope mass ( ), as is characterisc of Class 0 objects.
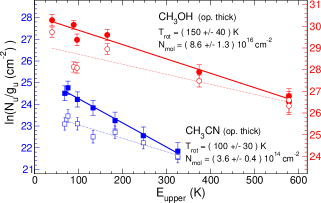
Because of the wide SMA band, one can observe several CH3CN and CH3OH transitions simultaneously. Following the rotational diagram method (Goldsmith & Langer 1999; Araya et al. 2005), which assumes that all molecular levels are populated according to the same excitation temperature, we can derive this temperature, , and the total column density, , for these molecules. We constructed the rotational diagrams following two methods. First, we assumed optically thin emission (open symbols in Fig. 4). Second, we estimated the opacity for each transition (following Goicoechea et al. 2006; see also Girart et al. 2002) and we adopted the value that yielded the best linear fit (filled symbols in Fig. 4). The resulting opacities for the different CH3CN and CH3OH transitions range from 0.3 to 3.5 and from 0.2 to 6.5, respectively. In the discussion we will use the results of the latter fit, which are K and cm-2 for CH3CN, and K and cm-2 for CH3OH. The high temperatures, together with the chemically rich spectrum, are clear evidence that I22198 is an intermediate-mass hot core.
 |
4. Discussion and Conclusions
Our interferometric continuum and molecular line observations toward I22198 reveal a compact and strong millimeter source driving a quadrupolar outflow, which is associated with a compact dense core with hot core signatures. At infrared wavelengths, IRAC images reveal a single source coincident with the hot core and with “green fuzzies” at 4.5 m. The high rotational temperature (100–150 K) estimated from the CH3CN and CH3OH rotational diagrams, and the chemically rich spectrum, make I22198 one of the few IMHCs known at present. There are only two other IMHCs reported in the literature: NGC 7129-FIRS 2 (Fuente et al. 2005), and IC 1396 N (Neri et al. 2007; Fuente et al. 2009). Table 1 lists the main properties of the three IMHCs known to date.
IC 1396 N is associated with a single IRAS source, IRAS 21319+5802. However, high-angular resolution millimeter images reveal a cluster of sources, only one of which is associated with the IMHC (Neri et al. 2007). Moreover, while Spitzer/IRAC observations reveal a counterpart for millimeter source 41.73+12.8, there is no counterpart for the IMHC millimeter source (41.86+11.9; Choudhury et al. 2010; Neri et al. 2007). All this makes it difficult to assess the IMHC contribution to the IRAS and IRAC fluxes, and hence we refrain from comparing IC 1396 N with I22198.
| IRAS 22198+6336 | NGC 7129-FIRS 2 | IC 1396 N | |
| distance (pc) | 760 | 1250 | 750 |
| () | 370 | 480 | <300 |
| () | 5 | 2 | <5 |
| clustering (mm) | no | no | yes |
| IRAC source | yes | yes | no |
| (mJy kpc2) | 0.34 | <0.36 | <0.15 |
| outflow | yes | yes | yes |
| hot core information | |||
| (K) | 100–150 | 50–100 | 100 |
| (cm-2) | b | ||
| X | |||
| outflow information | |||
| (yr) | 1300 / 1200 | 4000 | 2600 |
| ( yr-1) | 9 / 8 | 7 | 50 |
| ( km s-1) | 0.3 / 0.2 | 0.4 | 4 |
-
a
References are: I22198: Sánchez-Monge et al. 2008; this work (the two values in outflow parameters correspond to outflows A and B, respectively); NGC 7129-FIRS 2: Fuente et al. 2001, 2005, Crimier et al. 2010 (centimeter data from the VLA project AR304, and outflow parameteres: Sánchez-Monge, priv. com.); IC 1396 N: Beltrán et al. 2002; Neri et al. 2007; Fuente et al. 2009. Upper limits for IC 1396 N are due to the cluster properties (see text).
-
b
Estimated following Fuente et al. (2005), assuming K and a size of , which is the deconvolved size of the CH3CN core.
The other IMHC, NGC 7129-FIRS 2, has a bolometric luminosity similar to I22198, has a single associated source dominating the millimeter emission (Fuente et al. 2005) and also is clearly associated with a source detected in IRAC and MIPS bands (Sánchez-Monge, priv. com.). Eiroa et al. (1998) study the far-infrared emission, and find one HIRES source, which is coincident with the MIPS source (Crimier et al. 2010). The association of the millimeter, far-infrared and mid-infrared source with the IMHC is clear, as in the case of I22198 and, similarly, “green fuzzies” in the 4.5 m IRAC image appear associated with the molecular outflow, which is also quadrupolar (Fuente et al. 2001) and has physical parameters similar to the outflows in I22198 (Table 1). Regarding the centimeter emission, the upper limit for NGC 7129-FIRS 2 is consistent with the centimeter emission found toward I22198 (Table 1). Furthermore, Figure 2 shows that both IMHCs have quite similar Class 0-like SEDs. Thus, NGC 7129-FIRS 2 and I22198 have very similar properties concerning clustering, centimeter and outflow emission, and have a similar SED. Moreover, the hot core temperature, , and CH3CN abundance, XCH3CN, are similar for these two IMHCs. At this point, our data do not allow us to distinguish between the proposed hot core scenarios (radiative or shocked), because the two IMHCs have similar luminosities and outflow/centimeter properties. A detailed study of different molecular abundances (enhanced by the radiation field or by shocks) will be presented in a forthcoming paper, and should clarify the formation scenario of the hot core.
In summary, the properties of the newly discovered IMHC, I22198, and its comparison with the other known IMHCs help us better establish the characteristics of the hot core phase for IMYSOs. We have found that the IMHC phase is co-eval with mass ejection (as shown by outflow, “green fuzzies”, and faint centimeter emission), presents Class 0-like SEDs, has hot core temperatures K, and X. A detailed comparison of I22198 and NGC 7129-FIRS 2 and the discovery of new IMHCs will provide fundamental tools to understand the hot core phase of star formation.
References
- (1)
- (2) André, P., Ward-Thompson, D., & Barsony, M. 1993, ApJ, 406, 122
- (3)
- (4) Araya, E., Hofner, P., Kurtz, S., Bronfman, L., & DeDeo, S. 2005, ApJS, 157, 279
- (5)
- (6) Beltrán, M. T., Girart, J. M., & Estalella, R. 2006, A&A, 457, 865
- (7)
- (8) Beltrán, M. T., Girart, J. M., Estalella, R., Ho, P. T. P., & Palau, A. 2002, ApJ, 573, 246
- (9)
- (10) Ceccarelli, C. 2004, Star Formation in the Interstellar Medium: In Honor of David Hollenbach, 323, 195
- (11)
- (12) Cesaroni, R. 2005, Massive Star Birth: A Crossroads of Astrophysics, 227, 59
- (13)
- (14) Cesaroni, R., Felli, M., Jenness, T., Neri, R., Olmi, L., Robberto, M., Testi, L., & Walmsley, C. M. 1999, A&A, 345, 949
- (15)
- (16) Chandler, C. J., Brogan, C. L., Shirley, Y. L., & Loinard, L. 2005, ApJ, 632, 371
- (17)
- (18) Choudhury, R., Mookerjea, B., & Bhatt, H. C. 2010, ApJ, 717, 1067
- (19)
- (20) Crimier, N., Ceccarelli, C., Alonso-Albi, T., et al. 2010, arXiv:1005.0947
- (21)
- (22) De Buizer, J. M., & Vacca, W. D. 2010, AJ, 140, 196
- (23)
- (24) Edris, K. A., Fuller, G. A., & Cohen, R. J. 2007, A&A, 465, 865
- (25)
- (26) Eiroa, C., Palacios, J., & Casali, M. M. 1998, A&A, 335, 243
- (27)
- (28) Fuente, A., Neri, R., Martín-Pintado, J., Bachiller, R., Rodríguez-Franco, A., & Palla, F. 2001, A&A, 366, 873
- (29)
- (30) Fuente, A., Neri, R., & Caselli, P. 2005, A&A, 444, 481
- (31)
- (32) Fuente, A., Castro-Carrizo, A., Alonso-Albi, T., et al. 2009, A&A, 507, 1475
- (33)
- (34) Gibb, E., Nummelin, A., Irvine, W. M., Whittet, D. C. B., & Bergman, P. 2000, ApJ, 545, 309
- (35)
- (36) Girart, J. M., Viti, S., Williams, D. A., Estalella, R., & Ho, P. T. P. 2002, A&A, 388, 1004
- (37)
- (38) Goicoechea, J. R., Pety, J., Gerin, M., Teyssier, D., Roueff, E., Hily-Blant, P., & Baek, S. 2006, A&A, 456, 565
- (39)
- (40) Goldsmith, P. F., & Langer, W. D. 1999, ApJ, 517, 209
- (41)
- (42) Hirota, T., Ando, K., Bushimata, T., et al. 2008, PASJ, 60, 961
- (43)
- (44) Ho, P. T. P., Moran, J. M., & Lo, K. Y. 2004, ApJ, 616, L1
- (45)
- (46) Jenness, T., Scott, P. F., & Padman, R. 1995, MNRAS, 276, 1024
- (47)
- (48) Klaassen, P. D., & Wilson, C. D. 2007, ApJ, 663, 1092
- (49)
- (50) Kurtz, S., Cesaroni, R., Churchwell, E., et al. 2000, Protostars and Planets IV, 299
- (51)
- (52) Larionov, G. M., Val’tts, I. E., Winnberg, A., Johansson, L. E. B., Booth, R. S., & Golubev, V. V. 1999, A&AS, 139, 257
- (53)
- (54) Lee, C.-F., Ho, P. T. P., Palau, A., et al. 2007, ApJ, 670, 1188
- (55)
- (56) Neri, R., Fuente, A., Ceccarelli, C. et al. 2007, A&A, 468, L33
- (57)
- (58) Ossenkopf, V., & Henning, T. 1994, A&A, 291, 943
- (59)
- (60) Palau, A., Ho, P. T. P., Zhang, Q., et al. 2006, ApJ, 636, L137
- (61)
- (62) Palla, F., & Stahler, S. W. 1993, ApJ, 418, 414
- (63)
- (64) Sánchez-Monge, Á., Palau, A., Estalella, R., Beltrán, M. T., & Girart, J. M. 2008, A&A, 485, 497
- (65)
- (66) Shang, H., Allen, A., Li, Z.-Y., Liu, C.-F., Chou, M.-Y., & Anderson, J. 2006, ApJ, 649, 845
- (67)
- (68) Tafalla, M., Bachiller, R., & Martin-Pintado, J. 1993, ApJ, 403, 175
- (69)
- (70) Valdettaro, R., Palla, F., Brand, J., Cesaroni, R., Comoretto, G., Felli, M., & Palagi, F. 2002, A&A, 383, 244
- (71)
- (72) Zhang, Q., Hunter, T. R., Brand, J., Sridharan, T. K., Cesaroni, R., Molinari, S., Wang, J., & Kramer, M. 2005, ApJ, 625, 864
- (73)
- (74) Zhang, Q., Hunter, T. R., Beuther, H., Sridharan, T. K., Liu, S.-Y., Su, Y.-N., Chen, H.-R., & Chen, Y. 2007, ApJ, 658, 1152
- (75)