A correlation between the highest energy cosmic rays and nearby active galactic nuclei detected by Fermi
Abstract
We analyze the correlation of the positions of -ray sources in the Fermi Large Area Telescope First Source Catalog (1FGL) and the First LAT Active Galactic Nuclei (AGN) Catalog (1LAC) with the arrival directions of ultra-high-energy cosmic rays (UHECRs) observed with the Pierre Auger Observatory, in order to investigate the origin of UHECRs. We find that Galactic sources and blazars identified in the 1FGL are not significantly correlated with UHECRs, while the 1LAC sources display a mild correlation ( level) on a angular scale. When selecting only the 1LAC AGNs closer than 200 Mpc, we find a strong association () between their positions and the directions of UHECRs on a angular scale; the probability of the observed configuration being due to an isotropic flux of cosmic rays is . There is also a correlation with nearby 1LAC sources on a scale. We identify 7 “-ray loud” AGNs which are associated with UHECRs within and are likely candidates for the production sites of UHECRs: Centaurus A, NGC 4945, ESO 323-G77, 4C+04.77, NGC 1218, RX J0008.0+1450 and NGC 253. We interpret these results as providing additional support to the hypothesis of the origin of UHECRs in nearby extragalactic objects. As the angular scales of the correlations are large, we discuss the possibility that intervening magnetic fields might be considerably deflecting the trajectories of the particles on their way to Earth.
1 Introduction
The nature of the ultra-high-energy cosmic rays (UHECRs) with energies above eV remains enigmatic since they were first observed, more than half a century ago (Linsley, 1963). If such cosmic rays are composed predominantly of protons or nuclei, the Greisen, Zatsepin and Kuzmin (GZK) effect (Greisen, 1966; Zatsepin & Kuzmin, 1966) restricts their possible sources to the nearby universe, closer than about Mpc from Earth (the “GZK horizon”, Harari et al. 2006). Under the assumption that the UHECRs sources are relatively nearby and not uniformly distributed on the sky, then an anisotropic distribution of arrival directions is expected, as long as the deflections caused by the intervening magnetic fields are sufficiently small.
With the unprecedented capabilities of the Pierre Auger Observatory (PAO; Abraham et al. 2004), it is now possible to map the arrival directions of UHECRs with a precision (Abraham et al., 2007). This makes the cross-correlation analysis of the arrival directions with catalogs of astronomical objects a powerful tool for tracking the UHECR production sites (Abraham et al., 2007; Aublin, 2009; Hague, 2009). For instance, the anisotropy in the arrival directions of UHECRs was recently demonstrated with a significance level above 99%, through the correlation between the directions of such particles and the positions of nearby active galactic nuclei (AGNs) from the Véron-Cetty and Véron catalog (Abraham et al., 2007, 2008). This indicates that the highest-energy particles have an extragalactic origin within the GZK horizon, with either AGNs or other objects with a similar spatial distribution being the likely astrophysical sources of UHECRs. Note that the High Resolution Fly’s Eye (HiRes) experiment does not confirm the correlations suggested by the PAO data (Abbasi et al., 2008, 2010).
Since the pioneering work of Abraham et al. (2007), several authors have been studying the correlation of the PAO events’ directions with different classes of astrophysical objects. There is circumstantial evidence that at least some UHECRs appear to be associated with relatively few nearby radio galaxies (Nagar & Matulich, 2008; Moskalenko et al., 2009), with a puzzling paucity of UHECRs in the direction of the Virgo cluster (Zaw, Farrar & Greene, 2009). There is also evidence that spiral galaxies seem to host the producers of ultra-high energy cosmic rays (Guisellini et al., 2008). Moskalenko et al. (2009) noted the importance of taking into account the AGN morphology in correlation studies. Moskalenko et al. also pointed out the possibility of UHECRs being correlated with larger deflection angles and/or more distant sources than considered by Abraham et al. (2007). An understanding of which particular class of extragalactic sources is associated with the production sites of UHECRs is clearly missing.
Astrophysical -ray sources are appealing candidate accelerators of UHECRs, since by their very nature they are nonthermal objects where large energy transfers and extreme particle acceleration take place (Dermer & Razzaque, 2010). Thanks to the Large Area Telescope (LAT) aboard the Fermi Gamma-ray Space Telescope (Fermi; Atwood et al. 2009) which has been conducting a sky survey at energies above 100 MeV, we have an unprecedented map of the -ray sky (Abdo et al., 2009a, 2010a). In its first 11 months of operation Fermi detected and characterized 1451 -ray objects in the sky, culminating in the Fermi LAT First Source List (1FGL; Abdo et al. 2010a) and the First LAT AGN Catalog (1LAC; Abdo et al. 2010b). These detailed maps of the -ray sky are a rich dataset which that be used in cross-correlation analyses to shed light on the origin of energetic cosmic rays.
Mirabal & Oya (2010) recently investigated the correlation of the complete sample of 1FGL sources with the PAO dataset (as of Abraham et al. 2008). Their analysis was carried out without any redshift cut-off or type selection on the 1FGL, and counted associations when PAO events occur within circles of radius around the Fermi sources. Mirabal & Oya (2010) found no evidence that UHECRs are associated with Fermi sources for the particular angular radius considered. This does not imply though that there is no association at all between -ray sources and UHECRs. Considering that the 1FGL catalog is a “mixed bag” of -ray sources with quite different properties, if one particular class of -ray emitters is responsible for producing UHECRs, then other sources in the catalog bearing no relation with the cosmic rays might introduce “noise” in the correlation analysis. Furthermore, the correlation can be weak at a given angular separation and stronger at others.
In this work we use the 1FGL and 1LAC catalogs produced by the Fermi LAT to investigate the correlation between the positions of -ray sources and the arrival directions of UHECRs measured by the PAO. Our goal is to unveil if specific types of -ray sources might be driving any correlation and at what angular separations these correlations become significant. In §2 we describe the datasets we use. In §3 we describe our cross-correlation method. In §4 we list the results of our cross-correlation analysis when applied to the different subsamples of the 1FGL and 1LAC catalogs. We discuss the implications of our results in §5. In particular, we list the potential “-ray loud” UHECR accelerators and discuss their properties in §5.1. Section 6 closes with our concluding remarks.
2 Data
We base our analysis on the distribution of arrival directions of UHECRs with energies exceeding , collected by the surface array of PAO between 1 January, 2004 and 31 August 2007, with an integrated exposure of (Abraham et al., 2007, 2008). This data set corresponds to 27 events with zenith angles smaller than and angular resolution of (Ave, 2007).
To search for the potential astrophysical sources of UHECRs, we use the Fermi LAT First Source List (1FGL; Abdo et al. 2010a) and the First LAT AGN Catalog (1LAC; Abdo et al. 2010b) of -ray sources produced after the first eleven months of operation of Fermi. Source detection is based on the average flux over the 11-month period corresponding to a statistical significance higher than . The 1FGL consists of the 1451 sources detected and characterized in the 100 MeV to 100 GeV range. A subset of the 1FGL consisting of 671 sources constitutes the 1LAC.
1037 sources in the 1FGL are within the PAO field of view. Abdo et al. (2010a) provides identifications or plausible associations of these -ray sources with objects in other astronomical catalogs: 93 of them correspond to Galactic sources (pulsars, pulsar wind nebulae, supernova remnants, X-ray binaries and globular clusters) and 453 to AGNs in the 1LAC. Of the 1LAC AGNs, 367 are blazars, 69 are AGNs of uncertain type and 17 are non-blazar AGNs that include, for example, the radio galaxies M87, Centaurus A and 3C 207.0 (Abdo et al., 2010b). 490 1FGL sources could not be associated with any counterpart. Most of the unassociated sources are near the Galactic plane, and could not be identified because of a combination of Galactic extinction and source confusion (Abdo et al., 2009a, 2010a, 2010b).
3 Cross-correlation method
In order to quantify the statistical cross-correlation between the Fermi and PAO data, we compute the cumulative number of associated cosmic ray events as a function of angular separation (hereafter CCF for cumulative correlation function) from the data sets. The CCFs are computed by drawing circles of increasing radius around the Fermi sources, and counting the number of cosmic ray events that occur within such circles. This is qualitatively similar to the approach of Stephen et al. (2005) for the correlation analysis between two different X-ray catalogs.
The significance of the measured CCF (number of correlations measured in the observed data as a function ) is evaluated by comparing it against that expected by chance correlations assuming an isotropic flux of UHECRs. The chance CCF – number of correlations expected by chance vs. – is obtained by building simulated sets of UHECRs with the same number of observed events, drawn from an isotropic distribution of arrival directions convolved with the exposure function of the PAO (Sommers, 2001).
For a given configuration of Fermi sources and a given , our null hypothesis is that the number of associations measured in the data is the same as the average number expected by chance: . We calculate the p-value as the probability that exceeds . In practice, this p-value can be interpreted as the likelihood that the associations measured in the data could have occurred by chance if the null hypothesis is true, i.e. the likelihood that the observed configuration of -ray sources and UHECRs is a random accident. Assuming that the distribution of values obtained from the Monte Carlo simulation is normal, we define as
| (1) |
where , is the standard deviation of the distribution of values of and is the cumulative distribution function for a normal distribution.
When describing our results in the sections that follow, we will often refer to the statistical significance level with which we can reject the null hypothesis. We will refer to this significance level as , given in standard deviations. is just another way of expressing the p-value .
3.1 Consistency check
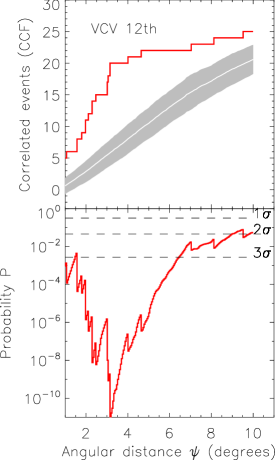
As a consistency check of the method outlined above, we applied it to calculate the cross-correlation between the arrival directions of UHECRs and the 292 AGNs with redshift within the PAO field of view listed in the 12th edition of the Véron-Cetty and Véron (VCV) catalog (Véron-Cetty & Véron, 2006), previously studied by Abraham et al. (2007, 2008). Figure 2 shows the resulting correlation signal. The upper panel in Figure 2 shows the measured CCFs, with angular separations ranging from (approximately the uncertainty in the arrival directions of PAO cosmic rays) up to . The lower panels display the probability .
Figure 2 illustrates that reaches a minimal value of at the angular separation , with 20 cosmic ray events correlated with AGNs at this angular scale, while only 5.9 correlations are expected by chance. Therefore, the results of our consistency check confirm with at least a significance level the anisotropy of the arrival directions of UHECRs and are in excellent agreement with those obtained by the statistical method used by the Pierre Auger Collaboration (Abraham et al., 2007, 2008). This lends strong support to the validity of our statistical method to probe the degree of correlation between the PAO and Fermi data sets.
As a matter of fact, when we apply our statistical test to the revised AGN sample in the 13th edition of the VCV catalog using the same redshift cutoff and considering only AGNs within the PAO field of view, we find that the association with UHECRs is maximized at with and correspondingly . Therefore, the correlation signal slightly changes when cross-correlating PAO events with the updated VCV catalog.
4 Results
We applied the above method to obtain the cross-correlation signal between the 1FGL/1LAC and PAO sources. In the following subsections we analyse the correlation signal of PAO events with: (1) all sources in the 1FGL catalog (§4.1), (2) only to 1FGL Galactic sources (§4.2) and (3) only to 1LAC AGNs (Sections 4.3 and 4.4). In §4.3 we impose no restriction on the redshifts of the sources while in §4.4 we restrict ourselves only to nearby AGNs within the GZK horizon.
4.1 UHECRs vs. all 1FGL sources
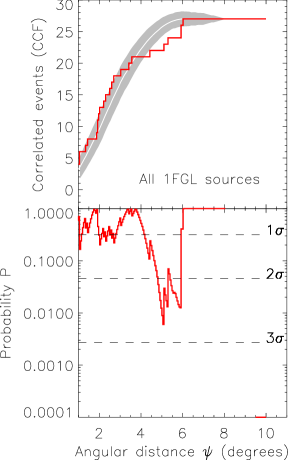
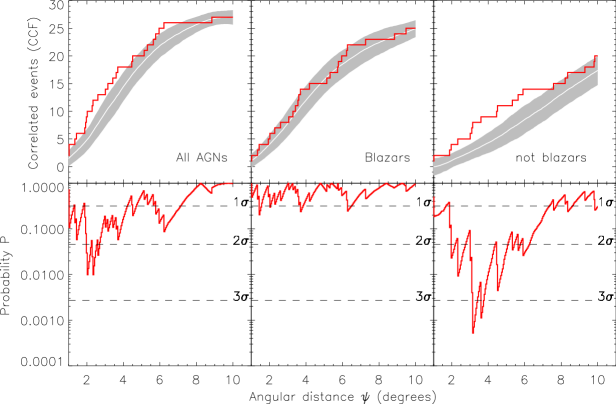
Figure 3 shows the correlation signal resulting from comparing the positions of all 1037 1FGL -ray sources within the PAO field of view with the directions of energetic cosmic ray events. The upper panel shows the measured CCFs, with angular separations ranging from (approximately the uncertainty in the arrival directions of PAO cosmic rays) up to . The lower panels display the probability .
Both panels of Figure 3 show that the number of observed correlated events follows the pattern of isotropic expectations within the significance until . In the range of angular separations , there is a systematic paucity of measured correlations with respect to chance expectations with . In particular, the maximal “anti-association” between the 1FGL and PAO datasets corresponds to the global minimum of the probability signal , which occurs at . This minimal probability corresponds to the significance level . At , 22 PAO events correlate with all 1FGL sources while 25.8 are expected from an isotropic flux.
The case corresponding to circles of radius deserves special attention. This is the estimated angular radius around AGNs in the Véron-Cetty and Véron catalog that maximizes their correlation with the arrival directions of UHECRs (Abraham et al., 2007). Figure 3 illustrates that at we find a high probability of chance correlation, (). This agrees with the analysis of Mirabal & Oya (2010).
The 1FGL catalog consists of a “mixed bag” of Galactic and extragalactic -ray sources with quite different properties. In the subsections below, we investigate the correlation of the individual classes of -ray sources identified by Abdo et al. (2010a) with the positions of PAO events.
4.2 UHECRs vs. 1FGL Galactic sources
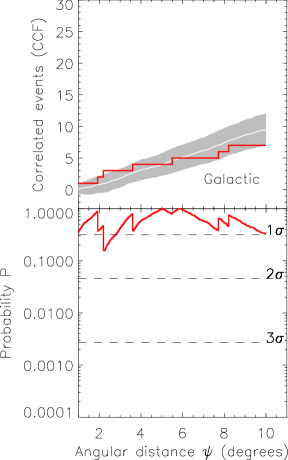
Figure 4 shows the correlation signal measured in the subset of 93 1FGL Galactic sources. The number of observed correlated events follows well the pattern of an isotropic expectation within the significance. There is a narrow fluctuation in the signal above at . Nevertheless, there are only 3 correlated events at this angular distance with 1 correlation expected from isotropy.
4.3 UHECRs vs. 1LAC AGNs
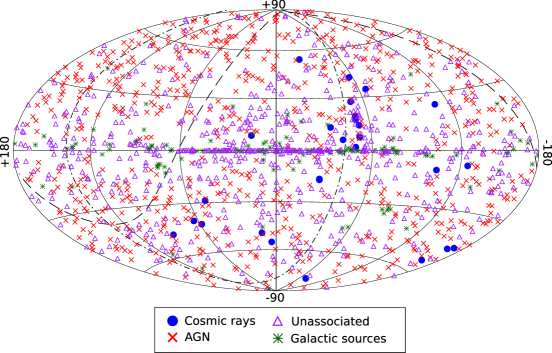
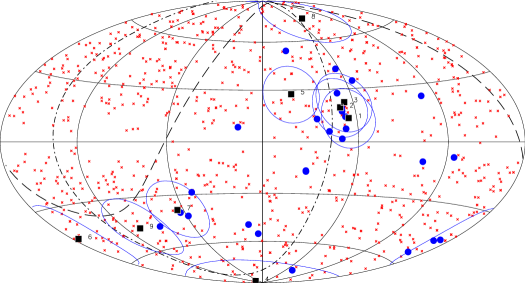
In this section we study the likelihood of association between UHECRs and the 453 AGNs identified in the 1FGL, i.e. the sources in the 1LAC catalog within the PAO field of view. Figure 5 shows the sky map in Galactic coordinates of the PAO events and the 1LAC sources. These AGNs are located at distances ranging from (the nearest 1LAC AGN is NGC 253) up to , which corresponds to the FSRQ blazar PKS 0336-017 (Abdo et al., 2010b).
The left panel of Figure 6 shows the correlation signal of the PAO events with all 1LAC AGNs. There is a maximal association between the two data sets at the angular scale (i.e. reaches a minimal value , corresponding to ). Within , 12 events correlate with all the Fermi AGNs without distinction of distance or AGN class, whereas 6.5 correlations are expected by chance.
The middle panel of Figure 6 shows the correlation signal with the 367 1LAC blazars. There is no significant correlation (i.e. ) between blazars and UHECRs that cannot be explained by an isotropic flux of cosmic rays. We also study the amount of correlation obtained when cross-correlating separately the two classes of blazars, BL Lacertae and FSRQ, with the PAO UHECRs. We obtained for the 169 BL Lacertae 1LAC sources a quite similar correlation signal to that of all blazars (i.e. consistent with chance correlations). If we select only FSRQ sources, we have a sample of 198 FSRQ objects, which increases the significance of the correlation up to at . It is interesting to note that 1LAC FSRQ blazars are located at , well outside the GZK horizon. Therefore, we should not expect an association of these objects with the arrival directions of UHECRs.
The right panel of Figure 6 displays the amount of cross-correlation between the subset of 86 AGNs consisting of non blazars (i.e. 17 misaligned jet sources such as the radio galaxies Centaurus A and M87) together with the AGNs that have not been identified yet (69 sources). The lower panel shows that the correlation significance raises above in the range . In particular, the probability signal reaches the minimum value () at , with 8 observed PAO event correlations, whereas only 2.9 chance correlations are expected. These PAO events are correlated with 7 AGNs, of which Cen A, 4C+04.77 and NGC 4945 are the only sources whose AGN types are known.
4.4 UHECRs vs. nearby 1LAC AGNs
Protons or nuclei with energies above 60 EeV interact with the cosmic microwave background and suffer the GZK effect: a strong attenuation of their flux for distant sources (Greisen, 1966; Zatsepin & Kuzmin, 1966). This defines a GZK horizon located roughly at a distance Mpc (Harari et al., 2006). Astrophysical sources located outside the GZK horizon are not expected to contribute appreciably to the observed flux of energetic cosmic rays. Motivated by this expectation, we investigate the correlation of PAO events with 1LAC AGNs located within the GZK horizon. We define the GZK horizon as being located at a comoving distance of 200 Mpc, which corresponds to , assuming the CDM cosmology with , , and (Komatsu et al., 2009).
We use the redshift information provided in the 1LAC (Abdo et al., 2010b) to discard the AGNs within the PAO field of view for which . Only 9 AGNs remain, including the radio galaxies Centaurus A (the nearest radio galaxy) and M87, the Seyfert 2 NGC 4945, the Seyfert 1 ESO 323-G77 and the starburst galaxy NGC 253 (as previously noted by Dermer & Razzaque 2010). Only three AGNs within the GZK horizon are BL Lacertae objects. There is no FSRQ AGN within the GZK horizon, with the nearest FSRQ blazar in the 1LAC being located at . 1LAC sources inside the GZK horizon are shown as squares in Figure 5.
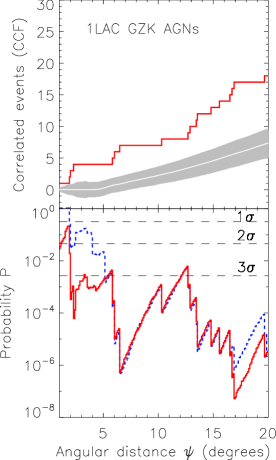
Figure 7 shows the correlation signal between 1LAC AGNs with and UHECRs, with reaching up to . The noteworthy feature here is that there are three characteristic angular scales where the probability of the observed configuration being explained by an isotropic flux of cosmic rays is minimized: , and . The first local minimum of the probability signal located at corresponds to only 4 associations, with and . The second local minimum of the probability signal located at corresponds to 7 measured correlations whereas 0.9 chance correlations are expected, with and . The absolute minimum of is characterized by , , , and .
Within the distance , 4 PAO events correlate with 3 AGNs: NGC 4945, Centaurus A and 4C+04.77; at , 7 PAO events correlate with 4 AGNs: NGC 4945, Centaurus A, ESO 323-G77 and 4C+04.77; at , 17 events are associated with 7 AGNs: NGC 4945, Centaurus A, ESO 323-G77, 4C+04.77, NGC 253, NGC 1218 and RXJ0008.0+1450. Table 1 lists the 9 1LAC AGNs located inside the GZK horizon, including their 1FGL names, Galactic coordinates (longitude and latitude ), identifications and redshifts according to Abdo et al. (2010a, b). We also list the number of PAO events potentially correlated with each AGN at the angular scales and . The ellipses in Figure 5 correspond to circles of radius centered on the GZK AGNs.
5 Discussion
We begin by pointing out some caveats in our analysis of the correlation of 1LAC AGNs and PAO events. Firstly, the 1LAC catalog of AGNs is increasingly incomplete towards the Galactic plane (Abdo et al. 2010a, b; see Figure 5) due to a combination of the effects of dust extinction in the Milky Way and source confusion. These effects may have some impact on our estimate of the correlation strength, since we might be missing some AGNs lying close to the Galactic plane. Secondly, there are many AGNs in the 1LAC that have not yet been identified with counterparts in other wavelengths, and lack redshift determinations (Abdo et al., 2010b). This may affect our cross-correlation analysis using the subset of 1LAC GZK AGNs, since we might be missing AGNs inside the GZK horizon that are yet unidentified in the 1LAC. With the progressive increase in the exposure time of the Fermi LAT survey observations, future releases of the Fermi LAT source catalog will improve on both these issues: they will increase the number of AGN detections near the Galactic plane and increase the number of associations of -ray sources with multiwavelength counterparts (Abdo et al., 2009a, 2010a, 2010b).
It is interesting to point out that – the angular separation which maximizes the association of PAO events with the AGNs in the 12th VCV catalog – does not correspond to a local minimum of the probability signal in our analysis of the correlation of 1LAC GZK sources and PAO events, even though at the hypothesis of the observed correlations being due to chance can be rejected at the level. On the other hand, the radius that maximizes the association with the sources in the 13th VCV catalog corresponds to a local minimum of the correlation signal in Figure 7.
We find no correlation between 1LAC blazars and UHECRs when considering all blazars detected by Fermi/LAT up to . In other words, relativistic jets nearly pointed along our line of sight do not seem to be significantly associated with the arrival directions of UHECRs on any angular scale. This result is in disagreement with the controversial claims of correlation of HiRes data with BL Lac objects (Gorbunov et al., 2004), but is expected on theoretical grounds (van Putten & Gupta, 2009).
5.1 The potential UHECR accelerators
Our results pinpoint 7 “-ray loud” 1LAC AGNs as the potential sites for the production of PAO UHECRs (see Table 1): Cen A, NGC 4945, ESO 323-G77, 4C+04.77, NGC 1218, RX J0008.0+1450 and NGC 253 (ordered by increasing number of associated UHECRs at the angular distance ). None of these AGNs display significant variability in their -ray emission (Abdo et al., 2010a, b). The three sources Cen A, NGC 4945 and ESO 323-G77 dominate the cosmic ray budget at all angular distances, having many UHECRs clustered near them. We discuss the likelihood of production of UHECRs in each of these sources.
As pointed out before by different authors, the nearby radio galaxy Centaurus A is an excellent candidate for the acceleration of UHECRs in its jets and radio lobes (Moskalenko et al., 2009; Hardcastle et al., 2009; Honda, 2009; Rieger & Aharonian, 2009; Dermer & Razzaque, 2010; Piran, 2010). Cen A is a prominent -ray source (Abdo et al., 2010a, b; Dermer & Razzaque, 2010), being associated with two UHECRs (Abraham et al., 2008) and potentially even more events (Gorbunov et al., 2008; Nagar & Matulich, 2008; Moskalenko et al., 2009). We can test the impact of Centaurus A in our results by removing it from the 1LAC data and recalculating the correlation signal of nearby 1LAC AGNs without Cen A. The dashed line in the lower panel of Fig. 7 corresponds to the correlation signal without Cen A, which differs from the signal including Cen A (solid line in Fig. 7) in the following way: the strength of the correlation is considerably weakened on separations smaller than , the minimum of the probability signal at essentially does not change its associated probability and the minimum at has its significance slightly decreased to . Therefore, statistically speaking, the impact of Cen A on the correlation is mainly in the significance of the short-distance associations.
NGC 4945 is classified as either a starburst galaxy or an obscured Seyfert 2 nucleus showing no signs of the presence of relativistic outflows (e.g., Spoon et al. 2000; Chou et al. 2007), while ESO 323-G77 is a Seyfert 1 galaxy that displays evidence for the presence of a mildly relativistic outflow in its X-ray spectrum (Jiménez-Bailón et al., 2008). We have to be careful when associating these galaxies with the nearby PAO events, since neither of them display powerful outflows or are energetically impressive (but see Boldt & Ghosh 1999; Pe’Er, Murase & Mészáros 2009). Both galaxies are located quite close to Cen A and any events associated with Cen A could also be mistakenly attributed to NGC 4945 and ESO 323-G77 in a correlation analysis, given their proximity (i.e. a case of accidental correlation).
A better understanding of the nature of the -ray emission in NGC 4945 and ESO 323-G77 could shed light on the issue of their likelihood as accelerators of energetic cosmic rays. Given the available information on these AGNs, our analysis suggests that Centaurus A is the primary candidate for the production site of several UHECRs observed in the direction of its group of galaxies. We note that ESO 323-G77 shows evidence of the presence of a relativistically broadened Fe K (Jiménez-Bailón et al., 2008), which suggests that the supermassive black hole in this galaxy could be rapidly spinning, with the Kerr black hole being a potential UHECR accelerator (Boldt & Ghosh, 1999; van Putten, 2008; Dermer & Menon, 2009).
5.2 Angular separations vs. deflection angles
The correlation signal obtained in this work will be helpful to constrain the results of simulations of the propagation of energetic cosmic rays originating from extragalactic sources (Abraham et al., 2008; Lima, 2009; Ryu, Das & Kang, 2010). One should be careful when mapping the separation angle that minimizes for a set of reference sources into the actual deflection angles suffered by the cosmic rays on their way towards Earth with respect to their actual sources. For instance, if the 1LAC GZK sources that we studied are tracing the production sites of the observed PAO events, which is a tempting possibility given the high significances of association that we obtain, the double-peaked significance pattern in the correlation between 1LAC GZK sources and PAO events raises a challenging question: Which of the angular scales , or actually corresponds to a deflection angle? The answer to this question is beyond the scope of this work, but it is worthwhile to compare our results with numerical simulations.
Ryu, Das & Kang (2010) modeled the propagation of UHECRs from source AGNs to observers through the intergalactic magnetic field, using a model universe based on results from cosmological structure formation simulations. Interestingly enough, they obtained the mean value of deflection angle between the arrival directions of UHECRs and the actual sources of . Therefore, our inferred angular distance – which corresponds to the maximum significance (see Figure 7) – is within the theoretical range of mean deflection angles calculated by Ryu, Das & Kang (2010)!
On the other hand, the separation angle between the arrival directions of UHECRs and the position of the nearest “mock” AGN in the simulation of Ryu, Das & Kang (2010) is , therefore . Quite interestingly, when comparing the position of PAO events against those of all 1LAC AGNs (left panel of Fig. 6) we find a much smaller separation angle that minimizes the probability of the observed configuration being due to an isotropic UHECR flux, . Taken together, our results seem to be in rough agreement with the theoretical results of Ryu, Das & Kang (2010).
5.3 Relation to the supergalactic plane
The SGP traces the distribution of matter in the local universe, with several nearby galaxy clusters and AGNs being concentrated near this plane (Lahav et al., 2000), as well as the arrival directions of many UHECRs (Abraham et al., 2007, 2008). For instance, 13 out of the 27 (48%) PAO events are located within a distance of to the SGP, with the average distance of UHECRs to the SGP of .
Of the 9 1LAC AGNs with in the PAO field of view, the 7 objects that correlate with energetic PAO cosmic rays within are located at an average distance to the SGP of . For comparison, PAO events associated with the 1LAC GZK AGNs are located at the average distance . This suggests that the nearby -ray bright AGNs associated with UHECRs on average fall very close to the nearby local overdensity of matter in the universe, even though the general distribution of 1LAC AGNs does not follow noticeably the SGP.
6 Concluding remarks
We analysed the correlation between the positions of the -ray sources in the Fermi LAT First Source Catalog (1FGL) and the First LAT AGN Catalog (1LAC) produced during the first eleven months of operation of the Fermi Gamma-ray Space Telescope, and the arrival directions of the highest energy cosmic rays measured during 1.2 years of operation of the Pierre Auger Observatory. Using our cross-correlation test, we are particularly interested in the value of separation angle between the positions of PAO events and reference sources that maximizes the significance level of rejecting the null hypothesis (that the observed configuration is due to chance assuming an isotropic flux of UHECRs). Our main results from the cross-correlation analysis of each 1FGL subset (in the PAO field of view) with the PAO events are summarized below:
-
•
When considering all -ray sources in the 1FGL, at with less observed correlations than expected assuming the null hypothesis.
-
•
Galactic 1FGL sources are not significantly correlated with the arrival directions of energetic cosmic rays ().
-
•
Considering the 1LAC AGNs we find at .
-
•
We find no significant correlation with 1LAC blazars ().
-
•
Considering the subset consisting of unidentified AGNs and non-blazars in the 1LAC, at .
-
•
We find a significant association with 1LAC sources closer than 200 Mpc, with the significance peaking at the separations (), () and ().
For the subset of nine 1LAC AGNs closer than 200 Mpc (, roughly the distance to the GZK horizon), we reject with the highest significance the null hypothesis compared to the other subsets of 1FGL sources ( at ). Of the 27 PAO events, 17 are located within of 7 nearby 1LAC AGNs: Centaurus A, NGC 4945, ESO 323-G77, 4C+04.77, NGC 1218, RX J0008.0+1450 and NGC 253. These “-ray loud” AGNs are likely candidates for the production sites of UHECRs.
The considerable separation angle that maximizes could suggest that the trajectories of the particles on their way to Earth are significantly deflected by the intervening magnetic fields, consistent with the numerical simulations of Ryu, Das & Kang (2010). This may set important constraints for the understanding of the structure of magnetic fields along the line of sight.
Given the small number of currently detected UHECR events, this work represents a first step towards understanding the relation among some of the highest-energy phenomena in the universe detected by PAO and Fermi. The data set that the PAO and Fermi will gather in the next few years should improve the correlation statistics of our work. Furthermore, cosmic ray observatories in the northern hemisphere such as the anticipated northern PAO site will offer a way of further identifying the sources of energetic cosmic rays. Thanks to PAO and Fermi, new perspectives to understand the relation among the highest-energy phenomena in the universe are being made possible!
References
- Abbasi et al. (2008) Abbasi, R. U., et al. (The High Resolution Fly’s Eye Collaboration) 2008, arXiv:0804.0382
- Abbasi et al. (2010) Abbasi, R. U., et al. (The High Resolution Fly’s Eye Collaboration) 2010, arXiv:1002.1444
- Abdo et al. (2009a) Abdo, A. A., et al. (Fermi LAT Collaboration) 2009a, ApJS, 183, 46
- Abdo et al. (2009b) Abdo, A. A., et al. (Fermi LAT Collaboration) 2009b, ApJ, 700, 597
- Abdo et al. (2010a) Abdo, A. A., et al. (Fermi LAT Collaboration) 2010a, ApJ, 188, 405
- Abdo et al. (2010b) Abdo, A. A., et al. (Fermi LAT Collaboration) 2010b, ApJ, 715, 429
- Abraham et al. (2004) Abraham, J., et al. (Pierre Auger Collaboration) 2004, Nucl. Instrum. Methods A, 523, 50
- Abraham et al. (2007) Abraham, J., et al. (Pierre Auger Collaboration) 2007, Science, 318, 938
- Abraham et al. (2008) Abraham, J., et al. (Pierre Auger Collaboration) 2008, Astroparticle Physics, 29, 188
- Atwood et al. (2009) Atwood, W. B., et al. 2009, ApJ, 697, 1071
- Aublin (2009) Aublin, J. (Pierre Auger Collaboration). 2009, Proceedings of the 31st International Cosmic Ray Conference (arXiv:0906.2347)
- Ave (2007) Ave, M. (Pierre Auger Collaboration). 2007, in Proceedings of the 30st International Cosmic Ray Conference (arXiv:0709.2125)
- Boldt & Ghosh (1999) Boldt, E., & Ghosh, P. 1999, MNRAS, 307, 491
- Chou et al. (2007) Chou, R. C. Y., et al. 2007, ApJ, 670, 1
- Dermer & Menon (2009) Dermer, C. D., & Menon, G. 2009, in High Energy Radiation from Black Holes: Gamma Rays, Cosmic Rays, and Neutrinos (1st ed.; Princeton Univerisity Press)
- Dermer & Razzaque (2010) Dermer, C. D., & Razzaque, S. 2010, ApJ, submitted, arXiv:1004.4249
- Gorbunov et al. (2004) Gorbunov, D. S., Tinyakov, P. G., Tkachev, I. I., & Troitsky, S. V. 2004, Soviet Journal of Experimental and Theoretical Physics Letters, 80, 145
- Gorbunov et al. (2008) Gorbunov, D. S., Tinyakov, P. G., Tkachev, I. I., & Troitsky, S. V. 2008, JETP Lett., 87, 461
- Greisen (1966) Greisen, K. 1966, Phys. Rev. Lett., 16, 748
- Guisellini et al. (2008) Guisellini, G., et al. 2008, MNRAS, 390, L88
- Hague (2009) Hague, J., D. (Pierre Auger Collaboration). 2009, Proceedings of the 31st International Cosmic Ray Conference (arXiv:0906.2347)
- Harari et al. (2006) Harari, D., Mollerach, S., & Roulet, E. 2006, JCAP, 11, 12
- Hardcastle et al. (2009) Hardcastle, M. J., Cheung, C. C., Feain, I. J., & Stawarz, L. 2009, MNRAS, 393, 1041
- Honda (2009) Honda, M. 2009, ApJ, 706, 1517
- Komatsu et al. (2009) Komatsu, E., et al. 2009, ApJS, 180, 330
- Lahav et al. (2000) Lahav, O., et al. 2000, MNRAS, 312, 166
- Jiménez-Bailón et al. (2008) Jiménez-Bailón, E., et al. 2008, MNRAS, 391, 1359
- Lima (2009) Lima, E. F. 2009, master dissertation, UFABC, São Paulo
- Linsley (1963) Linsley, J. 1963, Phys. Rev. Lett., 10, 146
- Mirabal & Oya (2010) Mirabal, N., & Oya, I. 2010, MNRAS, in press, arXiv:1002.2638
- Moskalenko et al. (2009) Moskalenko, I. V., Stawarz, L., Porter, T. A., & Cheung, C. C. 2009, ApJ, 693, 1261
- Nagar & Matulich (2008) Nagar, N. M., & Matulich, J. 2009, A&A, 488, 879
- Pe’Er, Murase & Mészáros (2009) Pe’Er, A., Murase, K., & Mészáros, P. 2009, Phys. Rev. D, 80, 12
- Piran (2010) Piran, T. 2010, arXiv:1005.3311
- Rieger & Aharonian (2009) Rieger, F. M., & Aharonian, F. A. 2009, A&A, 506, L41
- Ryu, Das & Kang (2010) Ryu, D., Das, S., & Kang, H. 2010, ApJ, 710, 1422
- Sommers (2001) Sommers, P. 2001, Astroparticle Physics, 14, 271
- Spoon et al. (2000) Spoon, H. W. W., et al. 2000, A&A, 357, 898
- Stephen et al. (2005) Stephen, J. B., et al. 2005, A&A, 432, L49
- van Putten & Gupta (2009) van Putten, M. H. P. M., & Gupta, A. C. 2009, MNRAS, 394, 2238
- van Putten (2008) van Putten, M. H. P. M. 2008, ApJ, 685, L63
- Véron-Cetty & Véron (1993) Véron-Cetty, M.-P., & Véron, P. 1993, A&AS, 100, 521
- Véron-Cetty & Véron (2006) Véron-Cetty, M.-P., & Véron, P. 2006, A&A, 455, 773
- Zatsepin & Kuzmin (1966) Zatsepin, G. T., & Kuzmin, V. A. 1966, Sov. Phys. JETP Lett., 4, 78
- Zaw, Farrar & Greene (2009) Zaw, I., Farrar, G. R., & Greene, J. E. 2009, ApJ, 696, 1218
| 1FGL | ClassaaMeaning of acronyms: RG = radio galaxy, BLL = BL Lacertae, Sy 1 = Seyfert 1, Sy 2 = Seyfert 2, SB = starburst galaxy. | NamebbName of identified or likely associated source. | IDccIdentification of each source numbered in Figure 5. | ddNumber of PAO events potentially associated with each Fermi source at the given separation. | ||||
|---|---|---|---|---|---|---|---|---|
| name | ||||||||
| J1305.4-4928 | Sy 2 | NGC 4945 | 0.002 | 1 | 4 | 7 | ||
| J1325.6-4300 | RG | Cen A | 0.002 | 2 | 3 | 7 | ||
| J1307.0-4030 | Sy 1 | ESO 323-G77 | 0.015 | 3 | 3 | 6 | ||
| J0047.3-2512 | SB | NGC 253 | 0.001 | 4 | 0 | 1 | ||
| J1517.8-2423 | BLL | Ap Lib | 0.048 | 5 | 0 | 0 | ||
| J0308.3+0403 | BLL | NGC 1218 | 0.029 | 6 | 0 | 2 | ||
| J2204.6+0442 | Sy 1/BLL | 4C+04.77 | 0.027 | 7 | 2 | 3 | ||
| J1230.8+1223 | RG | M87 | 0.004 | 8 | 0 | 0 | ||
| J0008.3+1452 | Sy 1 | RX J0008.0+1450 | 0.045 | 9 | 0 | 1 |