Dark Stars and Boosted Dark Matter Annihilation Rates
Abstract
Dark Stars (DS) may constitute the first phase of stellar evolution, powered by dark matter (DM) annihilation. We will investigate here the properties of DS assuming the DM particle has the required properties to explain the excess positron and electron signals in the cosmic rays detected by the PAMELA and FERMI satellites. Any possible DM interpretation of these signals requires exotic DM candidates, with annihilation cross sections a few orders of magnitude higher than the canonical value required for correct thermal relic abundance for Weakly Interacting Dark Matter candidates; additionally in most models the annihilation must be preferentially to leptons. Secondly, we study the dependence of DS properties on the concentration parameter of the initial DM density profile of the halos where the first stars are formed. We restrict our study to the DM in the star due to simple (vs. extended) adiabatic contraction and minimal (vs. extended) capture; this simple study is sufficient to illustrate dependence on the cross section and concentration parameter. Our basic results are that the final stellar properties, once the star enters the main sequence, are always roughly the same, regardless of the value of boosted annihilation or concentration parameter in the range between c=2 and c=5: stellar mass , luminosity , lifetime yrs (for the minimal DM models considered here; additional DM would lead to more massive dark stars). However, the lifetime, final mass, and final luminosity of the DS show some dependence on boost factor and concentration parameter as discussed in the paper.
keywords:
dark matter – first stars – stars: formation – stars: pre-main-sequence1 Introduction
Spolyar et al. (2008) first considered the effect of DM particles on the first stars during their formation. The first stars formed when the universe was about 200 million years old, at , in haloes consisting of DM and baryons predominantly in the form of H and He from big bang nucleosynthesis. The canonical example of particle DM is Weakly Interacting Massive Particles (WIMPs). In many theories WIMPs are their own antiparticles and annihilate with themselves wherever the DM density is high. The first stars are particularly good sites for annihilation because they form at high redshifts (density scales as ) and in the high density centers of DM haloes. Spolyar et al. (2008) found that DM annihilation provides a powerful heat source in the first stars and suggested that the very first stellar objects might be Dark Stars (DS), a new phase of stellar evolution in which the DM – while only a negligible fraction of the star’s mass – provides the key power source for the star through DM heating. Note that the term ’Dark’ refers to the power source, not the appearance of the star. Dark Stars are stars made primarily of hydrogen and helium with a smattering of dark matter (1% of the mass consists of DM); yet they shine due to DM heating.
In subsequent work, Freese et al. (2008a) and Spolyar et al. (2009) studied the stellar structure of the dark stars, and found that these objects grow to be large, puffy ( 10 A.U.), bright (), massive (they grow to at least ), and yet cool (K surface temperature) objects. They last as long as they are fed by dark matter. In another paper, Freese et al. (2010) considered the possibility of an extended period of dark matter heating and the consequent growth to Supermassive Dark Stars . By contrast, in the standard case, when DM heating is not included, Population III stars (the standard fusion powered first stars) 111 Pop. III stars refer to the first stars to form in the universe and are uncontaminated by previous stellar evolution. They consist only of the elements produced during Big Bang Nucleosynthesis. form by accretion onto a smaller protostar (Omukai & Nishi, 1998) up to and surface temperatures exceeding K. This higher surface temperature in the standard picture inhibits the accretion of the gas, as various feedback mechanisms become effective at those high temperatures (McKee & Tan, 2008). For reviews of first stars formation in the standard scenario, where DM heating is not included see e.g. Barkana & Loeb (2001); Yoshida et al. (2003); Bromm & Larson (2004); Ripamonti & Abel (2005); Yoshida et al. (2006).
WIMP annihilation produces energy at a rate per unit volume
| (1) |
where is the WIMP number density, mχ is the WIMP mass, and is the WIMP energy density. The final annihilation products typically are electrons, photons, and neutrinos. The neutrinos escape the star, while the other annihilation products are trapped in the dark star, thermalize with the star, and heat it up. The luminosity from the DM heating is
| (2) |
where is the fraction of the annihilation energy deposited in the star (not lost to neutrinos) and is the volume element.
The DM heating rate in Dark Stars scales as the square of the WIMP density times the annihilation cross section, as can be seen from Eq.(1). The WIMP density inside the star adjusts in response to changes in the star’s baryonic mass profile, since the gravitational potential well of the star is determined by the baryons. (The DM profile responds to changes in the gravitational potential due to the conservation of adiabatic invariants.)
In this paper, we investigate the dependence of Dark Star properties on these two quantities: (i) the annihilation cross section and (ii) the density of the halo within which the star forms, as characterized by the concentration parameter.
For a short list of papers by various other authors that have continued the work of Spolyar et al. (2008) and explored the repercussions of DM heating in the first stars see Iocco (2008); Iocco et al. (2008); Taoso et al. (2008); Yoon et al. (2008); Ripamonti et al. (2009); Gondolo et al. (2010); Ripamonti et al. (2010); Sivertsson & Gondolo (2010). Their potential observability has been discussed in Freese et al. (2010); Zackrisson et al. (2010a, b). The possibility that DM annihilation might have effects on today’s stars was actually considered in the by various authors such as Krauss et al. (1985); Bouquet & Salati (1989); Salati & Silk (1989). More recently the effect on today’s stars has been re-examined under the assumption that DM is made of WIMPs (Moskalenko & Wai, 2007; Scott et al., 2007; Bertone & Fairbairn, 2008; Scott et al., 2008) or within the hypothesis of inelastic dark matter (Hooper et al., 2010).
1.1 Boosted Leptophilic Annihilation Motivated by PAMELA data
Recent measurements of cosmic ray positrons and electrons in the GeV-TeV range could have significant implications on our understanding of dark matter (DM). The PAMELA collaboration (Adriani et al., 2009b, 2010) reported a flux excess in the cosmic energy spectrum from to GeV, reinforcing what was previously observed up to an energy of GeV by the HEAT experiment (Barwick et al., 1997). The FERMI-LAT collaboration (Abdo et al., 2009a, b) has found an excess in the flux in the GeV energy range above the background given by a conventional diffusive model, albeit in conflict with a much larger excesses in flux in the GeV range previously reported by ATIC collaboration.222The ATIC balloon experiment (Chang et al., 2008) found an increase in the spectrum between and GeV above background which has apparently been ruled out by FERMI. It is worth mentioning that a simple power-law fit of the FERMI-LAT electron energy spectrum is possible, being consistent with both astrophysical sources, or DM annihilation (e.g Di Bernardo et al., 2009; Grasso et al., 2009).
If confirmed, there are several possible explanations for the positron excess. The signals could be generated by astrophysical sources, such as pulsars or supernova shocks (e.g. Boulares, 1989; Profumo, 2008; Hooper et al., 2009a; Ahlers et al., 2009; Blasi, 2009; Fujita et al., 2009; Malyshev et al., 2009; Mertsch & Sarkar, 2009; Shaviv et al., 2009). Uncertainties in cosmic ray propagation in the galaxy leave open the possibility that standard cosmic ray physics could explain the signal (Delahaye et al., 2009). Another possible interpretation of the data could be in terms of a signal from DM annihilation (Baltz et al., 2002; Kane et al., 2002; de Boer et al., 2002; Hooper et al., 2004; Hooper & Silk, 2005; Cirelli et al., 2008; Cirelli & Strumia, 2008; Grajek et al., 2009; Nelson & Spitzer, 2008; Nomura & Thaler, 2009; Arkani-Hamed et al., 2009; Barger et al., 2009b, a; Bergstrom et al., 2009; Bai et al., 2009; Bi et al., 2009; Cholis et al., 2009a, b, c; Cirelli et al., 2009; Fox & Poppitz, 2009; Hooper & Zurek, 2009; Meade et al., 2009; Zurek, 2009; Meade et al., 2010) or decay (Chen & Takahashi, 2009; Chen et al., 2009a, b; Ibarra & Tran, 2009; Ibarra et al., 2009; Ibe et al., 2009a; Ishiwata et al., 2009; Shirai et al., 2009; Yin et al., 2009; Bajc et al., 2010; Chen et al., 2010). Others point out constraints against such an interpretation (Abdo et al., 2010; Abazajian et al., 2010).
The prospect that DM has been detected, although indirectly, has stirred a lot of excitement and a flurry of interest. There are several model-building challenges, however. If dark matter is to explain the positron flux excess in the cosmic-ray spectrum, in most models the products of decay or annihilation must be primarily leptonic since an excess in the anti-proton fluxes is not found (Adriani et al., 2009a) .
Moreover, in order to explain the observed signals the annihilation rate needs to be on the order of larger than for thermal relic. This could be explained by non-relativistic enhancements to the cross-section, such as the Sommerfeld enhancement (Sommerfeld, 1931; Hisano et al., 2004; Profumo, 2005; March-Russell et al., 2008; Cirelli et al., 2009; Lattanzi & Silk, 2009) or a Breit-Wigner enhancement (Feldman et al., 2009; Guo & Wu, 2009; Ibe et al., 2009b; Kadota et al., 2010). Scenarios involving non-standard cosmologies have also been considered as a possible solution (e.g Gelmini & Gondolo, 2008; Catena et al., 2009; Pallis, 2010). Alternatively, the annihilation rate could be greater than the standard prediction if the dark matter is not smoothly distributed in the local halo of the Milky Way (Diemand et al., 2008; Hooper et al., 2009b; Kamionkowski et al., 2010). For a review of the DM explanation for the the cosmic ray excess see He (2009).
In light of these new dark matter models, this paper will study the possible modifications to the evolution of a Dark Star (DS) for the case of leptophilic boosted dark matter. In Spolyar et al. (2009) a comprehensive study of DS for various WIMP masses was done, but the annihilation cross section was kept to its fiducial unboosted value. We return here to this problem, including the possibility of a boost factor for the cross section. Our starting point will be Bergstrom et al. (2009), where the authors find regions in the () parameter space (mass of WIMP vs. boost factor) that fits PAMELA/FERMI data based on three different classes of DM models. For simplicity we will consider only two of those models in our study: from the leptophilic class, the channel case, where direct annihilation to is assumed and the model, a subclass of the Arkani-Hamed model (Arkani-Hamed et al., 2009) which postulates that the Somerfeld enhancement is due to the exchange of a new type of light (sub- GeV) particle. In the case the new force carrier is a scalar, , which subsequently decays to . Somerfeld enhancement is now generated naturally via ladder diagrams for the process, producing 4 muons per annihilation versus 2 muons in the direct annihilation case.
1.2 Effect of Concentration Parameter
A second focus of this paper will be to study the dependence of DS properties on the concentration parameter of the initial density profile of the halo within which the first stars form. To remind the reader, the concentration parameter () characterizes how centrally condensed the initial density profile is: a larger concentration parameter means that more of the mass is concentrated at the center rather than at the outside of the dark matter halo (the precise definition is given below in Sec.2.3.2). Previous studies of DS considered and . Here we systematically examine a sensible range of concentration parameters. The most recent results of numerical simulations of structure formation seem to favor a ”floor” of on the concentration parameter of early structures (Zhao et al., 2003, 2009; Tinker et al., 2010) (Some halos can have a smaller concentration parameter if star formation begins before the halo is fully formed). At any rate the value will differ from halo to halo, even at the same redshift. Thus to explore how the properties of the DS are affected by a change in the concentration parameter, we will run the same simulation with three different values for it: , which characterizes the overall range for the concentration parameter DM halos hosting the first stars.
1.3 Canonical Values
We will assume a redshift of formation for the first stars, a dark matter halo of , and concentration parameters .
We will take the annihilation cross section to be
| (3) |
where the boost factor varies between and (depending on the particle physics model). The corresponding WIMP mass is taken from the models in Bergstrom et al. (2009) described above and ranges from GeV- TeV.
A key question for DS is the final mass, as the DS accretes more and more material. As long as there is a reservoir of DM to heat the DS, the star continues to grow. In the original work of Spolyar et al. (2009), the assumption was made that the initial DM inside the DS annihilates away in years for a spherical DM halo; here the DS grow to . In later work of Freese et al. (2010), this assumption was questioned due to the fact that DM haloes are instead triaxial, so that a variety of DM orbits can keep the central DM density higher for longer periods of time and the DS can grow supermassive . In reality dark stars will form in a variety of dark matter environments and will grow to a variety of masses. For the purpose of illustrating how DS vary due to differences in the halo concentration parameter and also due to enhanced annihilation rates, we will restrict ourselves to the first option for adiabatic contraction, in which the DM originally in the star (due to adiabatic contraction) is the only DM available to the DS; i.e. the DS can grow to .
In addition to this simple adiabatic contraction, we will also consider the effect of captured DM on the first stars (Iocco 2008; Freese, Spolyar, and Aguirre 2008).
In this case, DM passing through the first stars can scatter off the baryons multiple times, lose energy, and become bound to the star (direct detection experiments are based on the same physics: scattering of DM particles off of nuclei). Subsequently, the star builds up a reservoir made up of captured DM, which can power stars. In the ’minimal capture case,’ DM heating from captured DM and fusion powers the star in equal measure once it reaches the main sequence.
2 Equilibrium Structure of the Dark Star
2.1 Initial Conditions and Accretion Rates
The standard picture of Pop. III star formation starts with a protostellar gas cloud that is collapsing and cooling via hydrogen cooling into a protostar (Omukai & Nishi, 1998) at the centre of the halo. However, as was found in Spolyar et al. (2008), DM heating could alter the evolution of the first stars significantly. As soon as the protostellar gas reaches a critical core density, DM heating dominates over all possible cooling mechanisms. The cloud condenses a bit more but then stop collapsing, and becomes a dark star in equilibrium. At this point dark matter annihilation can power the dark star.
As the initial conditions for our simulations we take a DS in which the baryons are fully ionized. This luminous object powered by DM annihilations has a mass of , a radius AU, and a central baryon number density cm-3. We look for equilibrium solutions as described below. From this starting point we follow the evolution of the DS as it accretes baryonic mass from its surroundings. We use the accretion rate of Tan & McKee (2004), which decreases from yr at to yr at . At each stage in the accretion process we again find solutions in hydrostatic and thermal equilibrium. Eventually the accretion is cutoff by feedback effects; as the dark matter runs out due to annihilation, the DS heats up to the point where it emits ionizing photons that shut down further accretion. Feedback turns on once the surface temperature reaches 50,000K and is accounted for by introducing a linear reduction factor which shuts off accretion completely once the stars surface temperature reaches K.
2.2 Basic Equations
We use the numerical code previously developed in a paper involving two of the current authors (Spolyar et al., 2009). Here we review the ingredients in the code before demonstrating the modifications relevant to this paper.
One key requirement is the hydrostatic equilibrium of the star. This is imposed at each time-step during the accretion process:
| (4) |
Above denotes the pressure, is the total density and is the mass enclosed in a spherical shell of radius . We assume that the star can be described as a polytrope with
| (5) |
where the “constant” K is determined once we know the total mass and radius (Chandrasekhar, 1939).
The energy transport is initially convective with polytropic index but as the star approaches the Zero Age Main Sequence (ZAMS) it becomes radiative with . The code interpolates between and to account for the shift in energy transport as the star grows in mass. We can determine the temperature at each point in the radial grid via the equation of state of a gas-radiation mixture,
| (6) |
Here is the Boltzmann constant, is the atomic mass unit and is the mean atomic weight. In all resulting models K except near the surface, so we use the mean atomic weight for fully ionized H and He. We will assume a H mass fraction of and a He mass fraction , and that they will remain constant throughout the simulation.
At each point in the radial grid, and are used to determine the Rosseland mean opacity from a zero metallicity table from OPAL (Iglesias & Rogers, 1996) supplemented at low temperatures by opacities from Lenzuni et al. (1991) for K. The location of the photosphere is determined by the hydrostatic condition:
| (7) |
where is the acceleration due to gravity at that particular location. This corresponds to a point with inward integrated optical depth ; here the local temperature is set to and the stellar radiated luminosity is therefore:
| (8) |
with being the photospheric radius. The thermal equilibrium condition is
| (9) |
where is the total luminosity output from all energy sources as described below in Sec.2.4.
Starting with a mass and an estimate for the outer radius , the code integrates Eqns. (4) and (6) outward from the center.
The total luminosity output is compared to the stellar radiated luminosity, as in Eq.(8) and the radius is adjusted until the condition of thermal equilibrium is met (a convergence of in is reached).
2.3 Dark Matter Densities
2.3.1 Initial Profile and Concentration Parameter
The first stars form inside haloes. Simulations imply that DM halos have a naturally cuspy profile, but there is still some uncertainty about the exact inner slope of a DM halo: Diemand et al. (2007); Springel et al. (2008); Klypin et al. (2010). Luckily, a previous paper (Freese et al., 2009) showed that a dark star results regardless of the details of the initial density profile, even for the extreme case of a cored Burkert profile (such a Burkert profile is completely unrealistic). In this paper, we use a Navarro, Frenk, & White (NFW) profile (Navarro et al., 1996) for concreteness. We assume that initially both the baryons (15% of the mass) and the DM (85% of the mass) can be described with the same NFW profile
| (10) |
where is the ”central” density and is the scale radius. Clearly at any point of the profile, baryons will only make up 15% of the mass. The density scale, can be re-expressed in terms of the critical density of the universe at a given redshift, via
| (11) |
where is the concentration parameter and is the virial radius of the halo. We will assume a flat CDM universe with current matter density and dark energy density .
One of the main points of this paper is to study the dependence of DS properties on the value of the concentration parameter . Hence we will consider a variety of values, ranging from c=2 to c=5.
2.3.2 Adiabatic Contraction
As the baryons start to collapse into a protostellar cloud at the center of the DM halo, the DM responds to the changing gravitational potential well and becomes compressed. As described in our previous work, we will use adiabatic contraction (AC) to calculate the effect of baryons on the DM profile. With an initial DM and gas profile and a final gas profile, we can use the adiabatic invariants to solve for the final DM profile. We use the Blumenthal method (Barnes & White, 1984; Blumenthal et al., 1986; Ryden & Gunn, 1987) to calculate the adiabatic compression of the halo. In this case the simplifying assumption of circular orbits is made. Angular momentum is the only non-zero invariant. Its conservation implies that . In the case of circular orbits is the mass interior to the radius of an orbit and the indices and refer to final and initial orbits respectively. As mass grows inside of the orbit, its radius must shrink and the DM profile steepens.
The validity of this method in this context has been checked in Freese et al. (2009), where a more precise algorithm, developed by Young (Young, 1980), has been used and a difference within at most a factor of has been found. Whereas the Blumenthal method assumes circular orbits, Young’s method only assumes spherical symmetry of the system. Therefore only one of the three conserved actions is identically zero in this case. Namely the plane of each orbit does not change. The other two actions, angular momentum and the radial action respectively are non-zero and conserved. In view of Freese et al. (2009) we are confident that the simple Blumenthal method is sufficiently accurate for our purpose.
In this paper, we assume that all of the DM moves on circular orbits. The DM will become exhausted once all of the DM on orbits interior to the DS have been depleted. The timescale for this to happen is on the order a million years. This is probably an unduly cautious assumption. In a recent paper (Freese et al., 2010) we studied the case of triaxial haloes with large numbers of centrophilic orbits, which provided a much larger DM reservoir than we are considering, leading to supermassive DS. In reality dark stars will form in a variety of dark matter environments and will grow to a variety of masses. In this paper we could have grown the stars to supermassive sizes, but do not consider it necessary for showing the dependence of DS properties on the two effects we are studying.
2.3.3 Dark Matter Capture
Until now we have only discussed the DM inside the DS due to adiabatic contraction. However, dark star’s DM reservoir can be refueled by DM capture. This refueling requires an additional piece of particle physics: scattering of DM off the atomic nuclei inside the star. Some of the WIMPs from far out in the halo have orbits passing through the star. This DM can be captured and sink to the stars center, where they can annihilate efficiently. The capture process is irrelevant during the early evolutionary stage of the DS, since the baryon density is not high enough to efficiently capture DM. However, at the later stages as the DS contracts towards the ZAMS, the baryon densities become high enough for substantial capture to be possible. This mechanism was first noticed simultaneously by (Iocco, 2008) and (Freese et al., 2008b).
The capture rate is sensitive to two uncertain quantities: the scattering cross section of WIMP interactions with the nuclei and the background DM density. In terms of the relevant particle physics, we will consider only spin-dependent (SD) scattering cross sections with
| (12) |
The details of our capture study have previously been presented in Freese et al. (2008b) and will not be repeated here. We do wish to emphasize that we will assume the same case of minimal capture that we previously studied in Spolyar et al. (2009), in which case the heating from fusion and from DM heating are taken to be comparable. The more extreme and interesting case of dominant capture, which could last as long as the DS continues to exist in a high DM density environment, was studied elsewhere (Freese et al., 2010) and can lead to supermassive DS.
2.4 Energy Sources
There are four possible contributions to the DS luminosity:
| (13) |
from DM annihilation, gravitational contraction, nuclear fusion, and captured DM respectively.
2.4.1 DM Annihilation
The heating due to DM annihilation is given in Eqns. (1) and (2) and dominates from the time of DS formation until the adiabatically contracted DM runs out. In order to compute the luminosity generated by DM heating, one needs to know what fraction of the total energy generated by WIMP annihilations is deposited in the star. This quantity, which we name , will be different for various models for DM. In previous work (e.g. in Spolyar et al. (2009)) a fiducial value for of was used as appropriate for many typical WIMPS, under the following assumptions. First, the final products of DM annihilation, after all unstable particles have decayed to the lightest states, are taken to be three types: i) stable charged particles (i.e. ), ii) photons and iii) neutrinos. Second, the energy distribution was assumed to be roughly equal among the three final products listed above. The electrons and photons were taken to thermalize with the star and deposit their energy, whereas the neutrinos escape; hence .
On the other hand, given a specific model for DM, one could compute the precise value for using the energy distribution of all final annihilation products for the model under consideration. While this procedure could be done for the specific models in this paper, still we will use the standard in order to make simple comparisons with our previous work 333For the leptophilic models we are considering in this paper, DM annihilates either directly or via exchange of a light scalar to so that one might more reasonably expect smaller values since the muons decay to electrons and two neutrinos. The actual value will be closer to but will depend on the energy distribution among the various final products; still it will be a number of . . Since the aim of this paper is to understand the effect of the boost factor on the DS properties, we will fix the value of to , the same as in Spolyar et al. (2009). The differences between the boosted and unboosted cases will now be due only to the boost factor itself and the different masses of the WIMP in the two cases (rather than to the detailed values of ). Since appears always multiplied by , any ambiguity we have introduced by fixing the energy deposition factor to can be traded for an ambiguity in the annihilation cross section.
2.4.2 Gravitational energy
Once the DS runs out of DM, it begins to contract; gravity turns on and powers the star. Although relatively short, this Kelvin-Helmholtz (KH) contraction phase has important consequences: it drives up the baryon density and increases the temperature, therefore leading to an environment where nuclear fusion can take place. For a polytrope of index the gravitational contribution to the luminosity was found in Freese et al. (2009) using the virial theorem,
| (14) |
where is the radiation energy.
2.4.3 Nuclear Reactions
Subsequently nuclear reactions become important. We include the following nuclear reactions, which are typical for a zero metallicity star during the pre main sequence evolution: i- burning of primordial deuterium (assumed to have a mass fraction of ) which turns on rapidly once the stars central temperature reaches K, ii- the equilibrium proton-proton cycle for hydrogen burning, and iii- the alpha-alpha reaction for helium burning. Since we track the evolution of the DS only until it reaches ZAMS we do not need to consider the changes in stars atomic abundances. In order to calculate the nuclear luminosity, defined as
| (15) |
we use the methods described in Clayton (1968) to obtain the energy generation rate, . For the proton-proton reaction we use the astrophysical cross section factors from Bahcall (1989) and the He burning parameters from Kippenhahn & Weigert (1990).
2.4.4 Luminosity due to captured DM
As we have seen in Sec.2.3.3, during the later stages of the pre main sequence evolution captured DM can become an important energy source. The luminosity due to DM capture is
| (16) |
where
| (17) |
and the factor of in Eq.(16) reflects the fact that the energy per annihilation is twice the WIMP mass. In all simulations we will consider the case of “minimal capture”, which corresponds to equal contribution to the luminosity from capture and nuclear fusion when the star reaches the main sequence.
3 Results
On the whole, for all the values of boost factor and concentration parameter we have considered in this paper, the results are roughly the same: the final DS is roughly , , and lives yrs. Thus if the excess seen in PAMELA is due to WIMP annihilation, the required leptophilic boosted cross section is certainly compatible with the DS picture. However there are interesting differences between models which we will discuss.
Other than in the subsection immediately following this one, we will consider four WIMP models. As motivated below, we will focus on one boosted model denoted by AH4 with the following set of parameters: , TeV and . As our unboosted models, we will take 100 GeV WIMPs with the canonical cross section of cm3/s , and we will consider three values of the concentration parameter, c = (2, 3.5, 5). For comparison, the ”canonical case” considered in Spolyar et al. (2009) was the unboosted 100 GeV case with c=2. The relative boost factor between the AH4 model and the unboosted models is best described as follows: since Eq.(1) tells us that DM heating scales as , one can see that the AH4 is exactly equivalent to a 100 GeV WIMP mass with Boost Factor . In other words the relative boost factor between the AH4 model and the unboosted cases is actually .
Also, we assume throughout that the boost factor will have the same value for that is required to explain the PAMELA/ Fermi data. Particle physics models written down can certainly allow for larger boost factors in the halos in which the first stars form (the converse does not hold; DM has a lower velocity in a DS halo versus the Milky Way halo, which would act to increase the Sommerfeld enhancement). For clarity, we will fix the boost factor to the values given by Bergstrom et al. (2009).
3.1 ‘Final’ Luminosity for Dark Stars with boosted DM
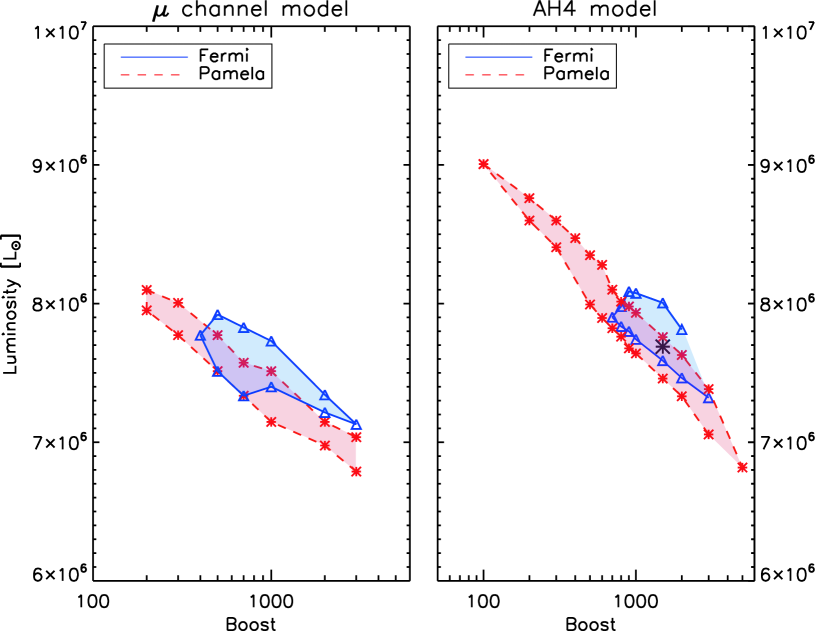
We will investigate the ‘final’ luminosities and masses of Dark Stars as they enter the main sequence. We study a variety of WIMP parameter ranges capable of explaining the PAMELA data; in particular we follow the work of Bergstrom et al. (2009) and take various boosted DM annihilation rates and WIMP masses from fig. 1 or their paper, which gives contours in the enhancement factor - mass plane needed to fit PAMELA and Fermi data. In this section we consider two of the particle physics models they consider: the channel and AH4 type of models.
In Fig. 1 we plot the ‘final’ luminosity at the end of the DS lifetime, when the DS has accreted to its maximum mass: the dark matter has run out and the star is about to enter the zero age main sequence where it will be powered by fusion. We plot the luminosity as a function of the boost factor. The points represent individual simulation outputs. The solid (dashed) lines connect simulation outputs generated with the DM mass and Boost factors from the contours in fig.1 from Bergstrom et al. (2009) corresponding to the Fermi (PAMELA) confidence regions in Bergstrom et al. (2009). We note that even if the boost factors range over more than one order of magnitude, from to ( the corresponding WIMP masses take values in the 1-4 TeV range) the final luminosities in all cases are relatively similar, ranging from to (The variation in luminosity for a fixed boost factor corresponds to the range of allowed in Bergstrom et al. (2009). For instance for a boost factor of 1000, the upper bound of the Fermi contour in left panel of Fig. 1 corresponds to a TeV; the lower bound to TeV ). As the boost factor increases, we note that the final luminosity gets slightly smaller. This is due to the fact that the ratio typically also increases in most cases. This leads to a faster depletion of the adiabatically contracted DM from the star, shortening the time until it reaches the main sequence, therefore reducing the amount of mass accreted and consequently the luminosity at that point.
3.2 Structure and Evolution of DS
In this section, we will analyze the two effects of i) boosting the annihilation cross section and ii) a variety of concentration parameters on the structure of a Dark Star. As mentioned above, for the “boosted” case we choose one sample point from the AH4 type models, which corresponds to the large star shaped point at the center of the right panel of Fig. 1. Henceforth we will denote by AH4 this point which has , TeV and .
3.2.1 Luminosity Evolution
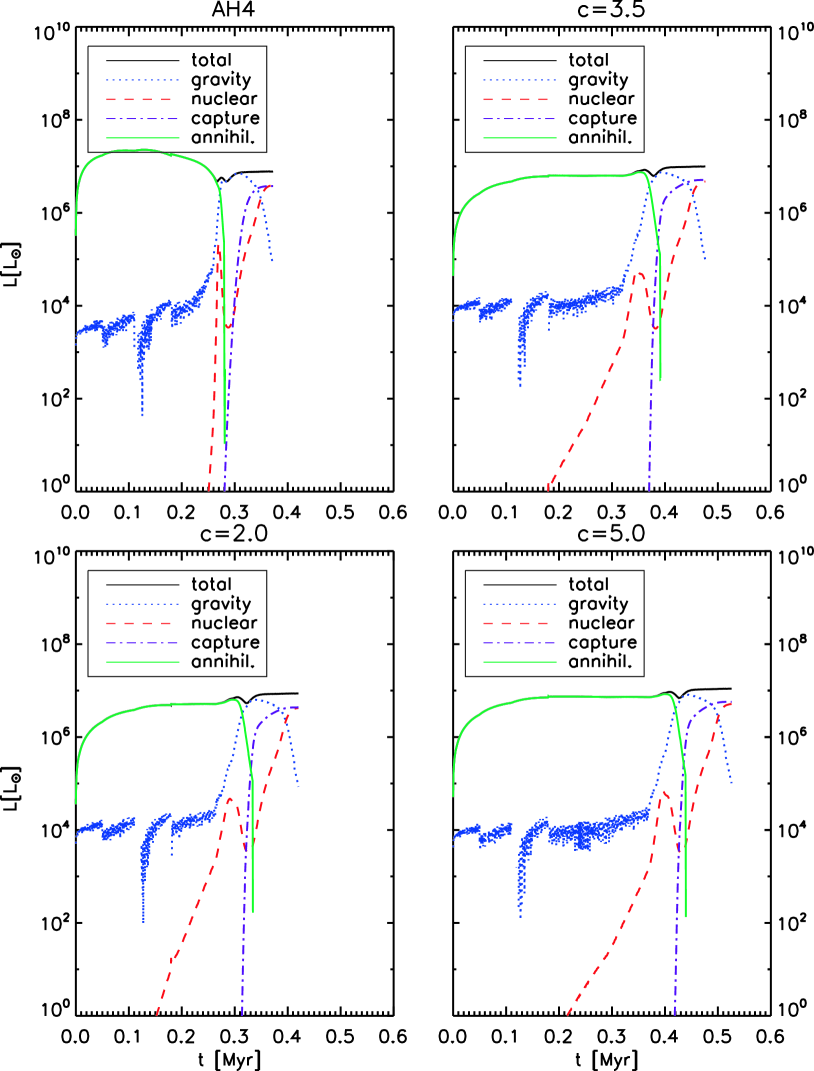
In Fig. 2 we compare the luminosity evolution for the four cases we have just described. In all cases, DM annihilation heating provides the dominant contribution to the DS luminosity until the DM runs out. At this point Kelvin-Helmholtz contraction sets in and briefly provides the dominant heat source, until the star becomes hot and dense enough for fusion to begin. In the cases where we include capture, DM annihilation may again become important at the later stages leading to a new DS phase.
In both upper panels of Fig. 2 we take : the left panel is the boosted AH4 model while the right panel is unboosted (the relative ratio of boost factors is effectively as mentioned before). Due to the ambiguity in the value of the concentration parameter we will also study its implications on the evolution of the Dark Star by running the unboosted GeV case for respectively; the lower two panels are the unboosted case with and 5. The lower left panel is the same as the canonical case studied in Spolyar et al. (2009).
Effects of Boost: The DM heating is the most powerful in the boosted AH4 case, since Eq.(1) indicates that heating scales with cross section. Thus at any given time during the DS phase, this model has the brightest luminosity, as can be seen in Fig. 2. Consequently, the DM is burned up the more quickly in the boosted AH4 case, leading to the shortest DS lifetime.
In order to balance the higher DM heating, a larger radius is required, which leads to a lower central temperature and density. See Fig. 9. As the adiabatically contracted DM runs out the evolution is similar in all cases, the final luminosity being on the order of .
Effects of concentration parameter: When we compare the three different concentration parameter cases, we notice that the nuclear fusion sets in earlier for smaller values of . The higher the concentration parameter the more adiabatically contracted DM available, therefore it takes longer to start the transition to the main sequence. This will lead to slightly higher final masses, which in turn translate to higher final luminosities. Nevertheless, as pointed out before they are all very close to . In all three cases where cms we notice a flash in the luminosity when both the gravitational energy and the energy due to annihilations of the adiabatically contracted DM are relevant. This happens at a time somewhere between 0.31 Myr (for ) and 0.42 Myr (for ). The same flash can be seen for the AH4 panel, but now the true maximum of the luminosity occurs after only 0.1 Myr. The maximum luminosity is .
The main differences between the different WIMP models as regards the luminosity evolution in Fig.2 are in the time the “pure” dark star phase lasts. The higher the boost factor, the shorter this phase. Conversely a larger concentration parameter prolongs the DS phase, since more DM is available.
3.2.2 Pre main sequence evolution, HR diagram
In Fig. 3 we plot Hertzsprung-Russell (H-R) diagrams for the four cases. One can see two distinct phases. First, the DS goes up the Hayashi track with a very steep increase of the luminosity yet relatively cool surface temperature, K. At the end of the Hayashi track the star enters the Henyey track. This path corresponds to an almost constant luminosity while the temperature increases fast, mostly due to the KH contraction phase. As a rule of thumb once a star is on the Heyney track its core should be fully radiative. The graphs end at a temperature of K when the star reaches the main sequence.
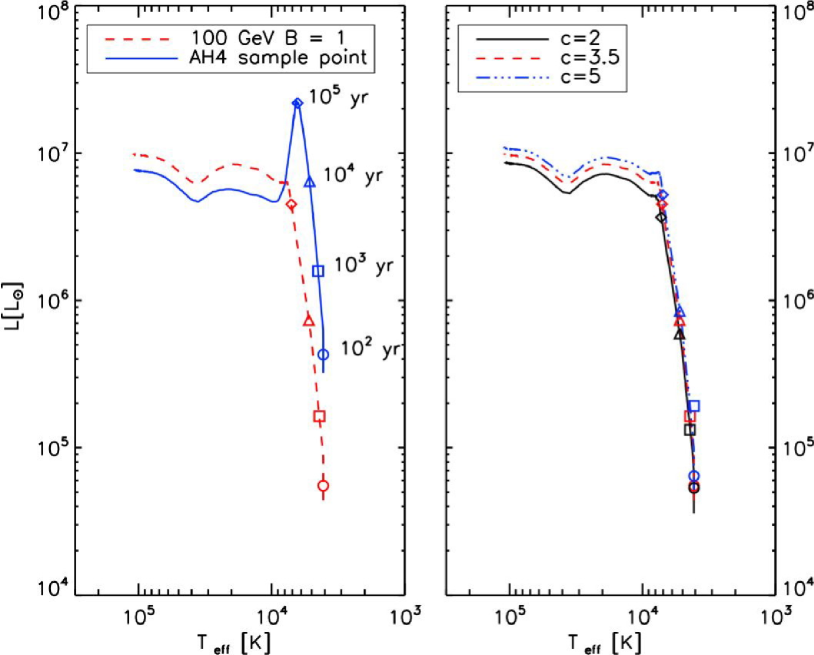
Effects of Boost: From the left panel of Fig. 3 one can see that the boosted AH4 case has the highest luminosity, due to the extremely efficient DM heating forming a luminosity peak. However, as the AH4 case burns up its DM, the its luminosity falls. The boosted and unboosted cases eventually cross over at a temperature of K, and henceforth the unboosted case has a higher luminosity. Consequently, the boosted AH4 case has the lowest luminosity as the star moves onto the main sequence, as discussed above.
Effects of concentration parameter: In the right panel of Fig. 3 the trend is uniform: an increase in the concentration parameter leads to an increase in the luminosity. The difference is relatively small in the early stages of the evolution, at low temperatures. This is due to the fact that the adiabatically contracted DM density profile is not very sensitive to the concentration parameter, therefore about the same amount of DM heating will be generated in each case. However, for a lower value of the concentration parameter, the adiabatically contracted DM runs out faster, as there is less DM available. This leads to a shorter “pure” DS phase, as can also be seen from Fig. 2, and consequently to slightly lower final mass and luminosities.
3.2.3 Radius and Effective Temperature of DS
Effects of Boost on Radii: In the “pure” DS phase the star will be puffier for a higher ratio, as can be seen from the left panel of Fig.4. This is expected due to the much higher DM heating in that case: a larger radius is required to balance the DM energy production and the radiated luminosity, which scales as . For instance, in the boosted AH4 case the maximum radius is at about cm, whereas for the GeV non-boosted WIMP, the DS will have a maximum radius of cm. However, as mentioned before, the KH contraction will set in earlier in the boosted case. This phase corresponds to the sharp decrease in radius in Fig.4. The final radii, as the DS enters the ZAMS are similar in both cases, at around cm.
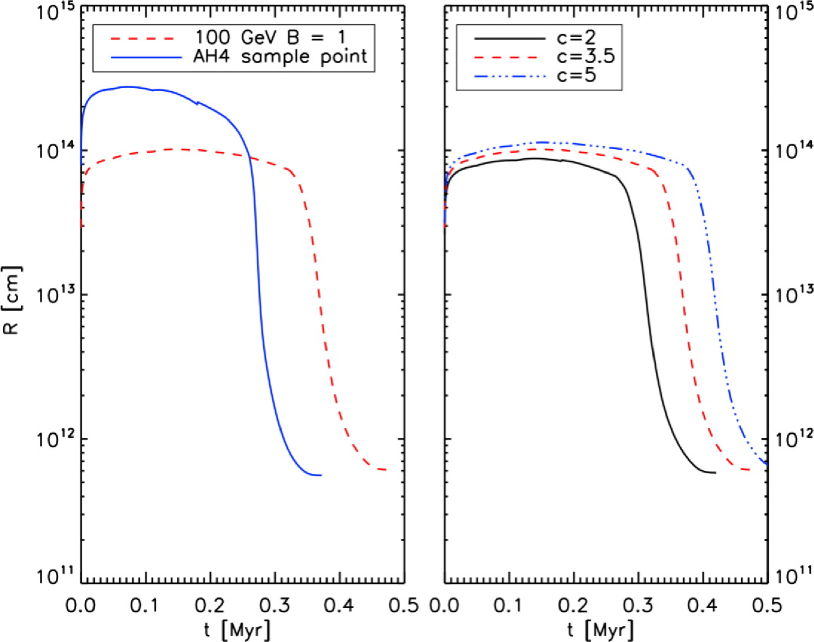
Effects of Concentration Parameter on Radii: From the right panel of Fig.4 we notice an uniform increase in the radius with the concentration parameter. Again, more efficient DM heating leads to a puffier DS. The maximum radii range from cm to cm for . After the KH contraction phase the DS settles to a radius very close to cm as it enters the ZAMS.
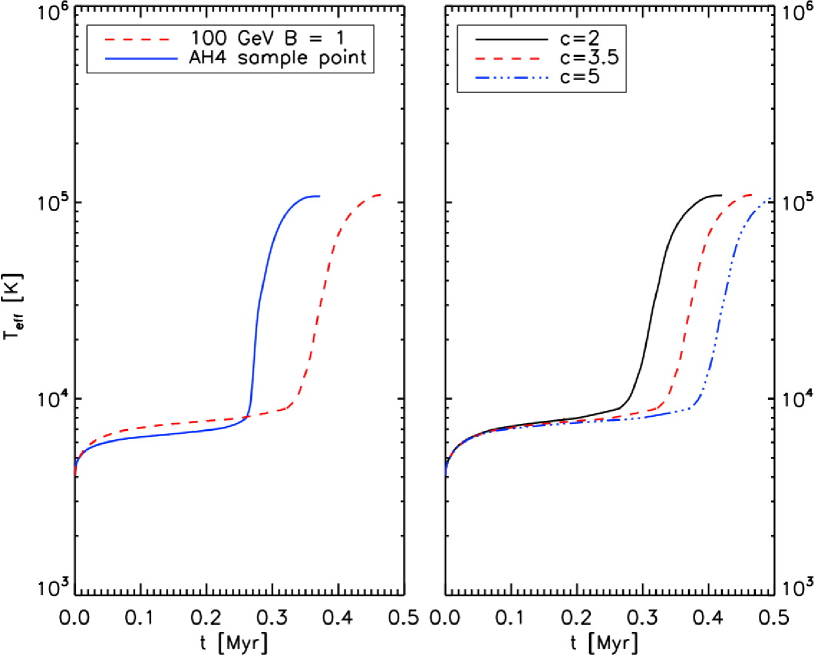
Effective Temperatures: In Fig. 5 we plot the effective surface temperature as a function of time. At first, during the DS phase, is relatively constant below K. Once the DM starts to run out, the star contracts and heats up, leading to a sharp increase in due to the onset of the KH contraction phase. Once nuclear fusion becomes the dominant energy supply and the star ceases to contract, the surface temperature reaches a plateau. The final value of K is always the same for all cases, regardless of value of boost factor or concentration parameter. The AH4 case (left panel in Fig.5) starts as a cooler star, again typical of more efficient DM heating in that case due to the boost factor. In addition, in the AH4 case the DM runs out more quickly, leading to an earlier increase in temperature. Regarding the various concentration parameters: during the DS phase, the surface temperature is roughly the same in all cases, K. The DS phase lasts the longest for the highest value of as this case has the most DM to begin with; thus the temperature starts to rise later for ever larger concentration parameters .
3.2.4 Energy Transport near the Core
The DS starts with a fully convective structure, modeled by a fluid with a polytropic index . Then a radiative core starts to develop, that grows outwards, until most of the star is described by a polytrope of index . In Fig. 6 we plot the radiative gradient in the innermost zone at the center of the DS. The dashed horizontal line illustrates the critical value for convection. Models above the line have a convective core, while models below the line have radiative cores. Models with more efficient DM heating – i.e. the models with higher values of or the AH4 model — transition to radiative energy transport later; stars with more efficient DM heating require a larger radius. At a fixed luminosity with more efficient DM heating, the star must have a larger radius and a lower densities to keep DM heating and the stellar luminosity in balance. With a lower density, the star has a lower central temperatures. At lower temperatures, the number of bound states increases, which increases the number of bound-free transitions. Also, the number of free-free transitions increase. These two effects increase the opacity which produces a larger radiative gradient and delays the transition from convective to radiative transport.
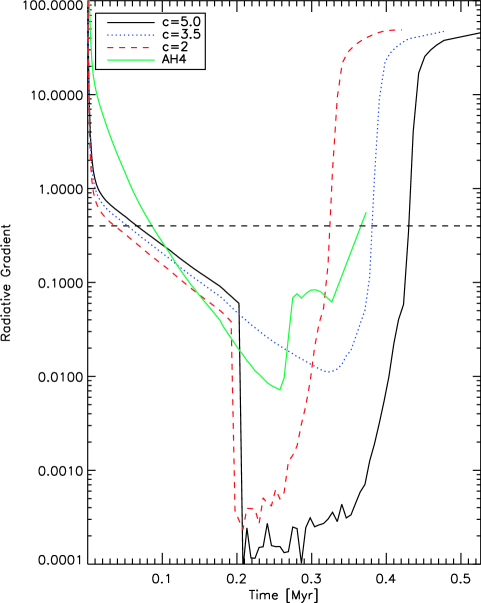
Once the original DM in the star runs out and nuclear fusion begins, a convective core develops in all cases. The central gradient is high due to the fact that nuclear fusion takes place primarily in the core of the star. Similarly, once the star repopulates its DM due to capture, this new DM population is thermalized with the star and its density is also sharply peaked at the center of the star. Thus both nuclear fusion and captured DM lead to a large radiative gradient in the core and therefore favor convection.
Again, the transition happens later for higher values of . The time when the convective core develops corresponds almost precisely to the time when the captured DM heating becomes significant, as can be seen by comparing with Fig. 2: Myr, Myr and Myr for and respectively.
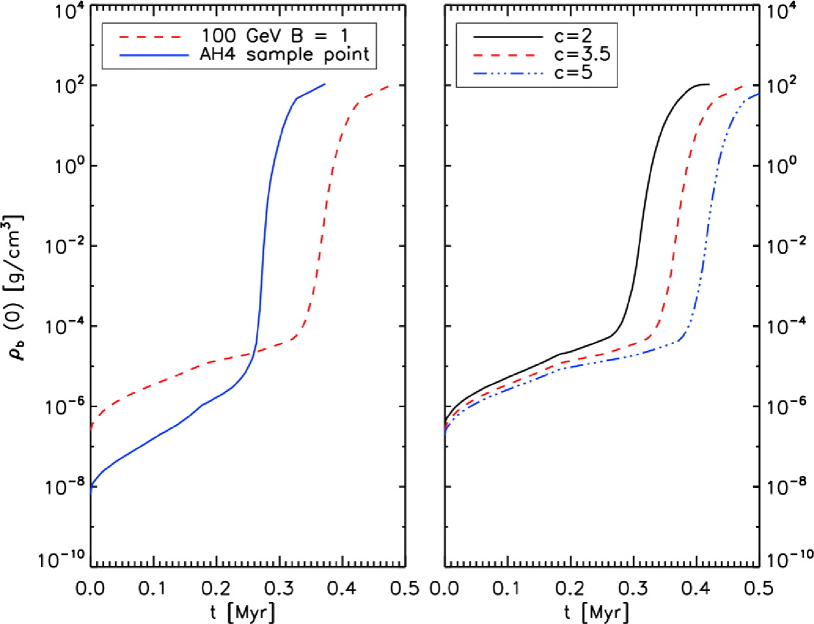
3.2.5 Baryonic Central Density
The baryon central density is plotted in Fig. 7 for the four cases we considered.
The higher cross section of the AH4 case at first leads to a puffier star (larger radius to keep the radiated luminosity at a level to balance the higher DM heating); thus it is not surprising that the AH4 case initially has a relatively lower central density. However, the initial DM in the DS runs out earlier in the AH4 case due to more efficient burning; hence in the left panel the two lines cross due to the earlier onset of the KH contraction (marked in the plot by the sharp increase of the densities) in the AH4 case.
The central density scales inversely with the concentration parameter, as can be seen from the right panel of the same plot. Again, more DM heating (higher ) will lead to larger radii, therefore smaller densities. However, as opposed to the situation depicted in the left panel, In the right panel, the curves do not cross since the models with a larger concentration parameter have more DM, which delays the onset Helmholtz contraction. We will come back to this in Sec.3.2.7. In all cases considered here once the star goes onto the main sequence, the central density is close to 100g/cm3.
3.2.6 Mass as DS enters the ZAMS
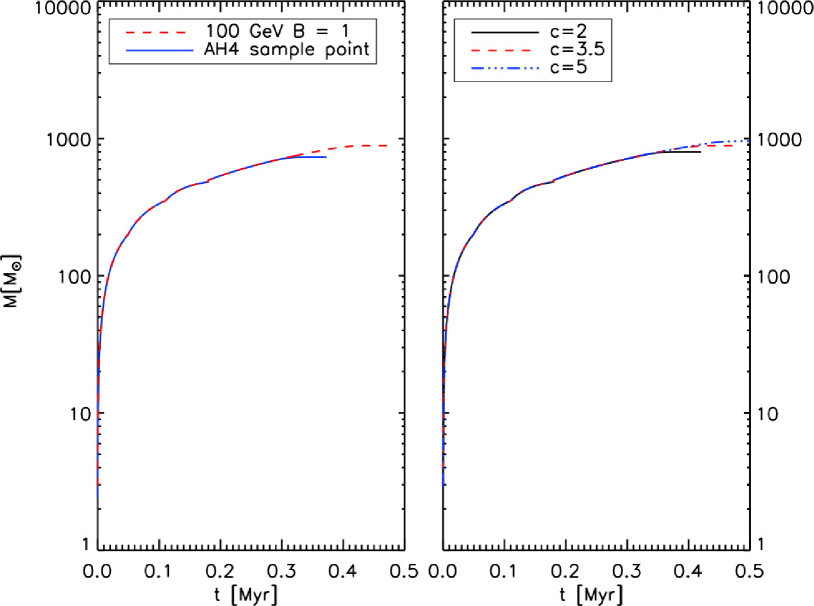
In Fig. 8, we have plotted the DS mass as a function of time. In all cases, the final mass when the DS enters the main sequence is ; however, there are slight differences for different models. The models with more effective DM heating – i.e. the AH4 model compared to the GeV unboosted case – burn up their original adiabatically contracted DM the most quickly and enter the KH contraction phase the soonest. This in turn leads to a smaller final mass, as feedback effects will shut off accretion sooner. When comparing the cases with different concentration parameter we notice that the DS final mass is an increasing function of . As previously explained an increase in the concentration parameter leads to a longer DS phase, and hence to more mass accreted. For the case of the unboosted GeV WIMP with the final mass is around , whereas for the case it is close to . For ranging from the DS will have a mass in the as it reaches the main sequence.
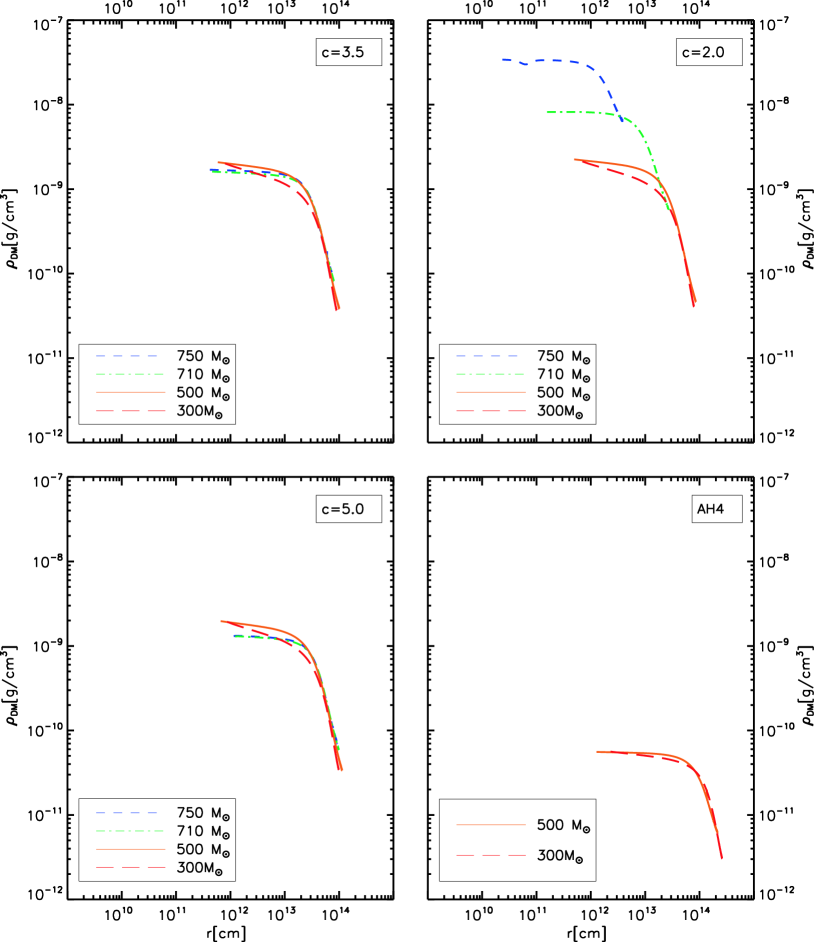
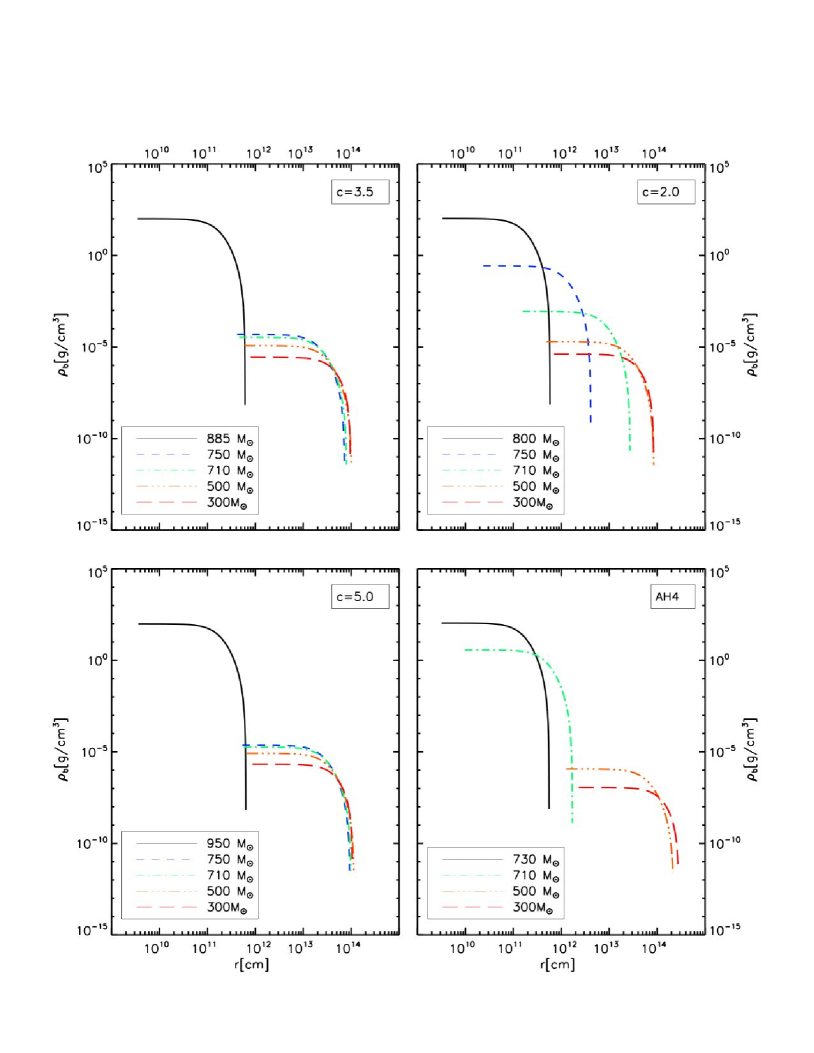
3.2.7 Density Profiles for DM and Baryons inside the DS; amount of adiabatically contracted DM
In Fig. 9 and Fig.10, we have plotted the density profiles of the adiabatically contracted DM and baryons respectively. The AH4 model for the same stellar mass has a lower DM density than the canonical unboosted GeV case by roughly an order of magnitude, and also has a more extended profile. For instance, in the case of a DS of the values are g/cm3 (AH4) and g/cm3 (canonical) respectively. This effect can be attributed to the fact that at a higher annihilation cross sections or a lower particle masses444 A similar effect was noticed in Spolyar et al. (2009), where it was found that “the average DM density in the star is an increasing function of ”; n.b. the higher annihilation cross section of the AH4 case can be traded for a lower WIMP mass since heating scales as . , a larger radius and a lower density are needed to balance the DM heating and the stellar luminosity (which scales as ).
During the early stages of the DS evolution the dependence of the adiabatically contracted DM density on the concentration parameter is very small at least for the range we have considered here. As it can be seen from Fig.7, prior to the onset of the KH contraction phase, the central baryon densities for models with different values of the concentration parameter have similar baryon density and DM density as well. Models with a larger concentration parameter have slightly more dark matter, have slightly lower central DM densities, and are also more extended. Before the contraction phase, the central DM density of the case’s density is 10% lower than the case. The radius is 20% larger. Models with different concentration parameters only begin to dramatically diverge once the star begins to contract and enters its Kelvin-Helmholz contraction phase. At this point, the star begins to shrink, which cause the DM densities to increase dramatically.
DS in halos with a larger concentration parameter have more DM and thus delay the onset of the KH phase. For , the contraction phase begins at Myr; See Fig.4. At this time, the stellar mass has reached . For and 5, the contraction phase begins later. In the case of , the star has a mass of . Thus the contraction begins once the star is more massive.
At a fixed stellar mass, the DM densities will differ dramatically between models which are in the contraction phase compared to those which are not contacting . For instance, let us consider a DS. In the case of , the star has entered the contraction phase. While the cases with a larger concentration parameter (3.5,5) have yet to begin their contraction phase. Hence the stars with a larger concentration, have a lower DM density and are more extended, which can be seen in Fig. 9.
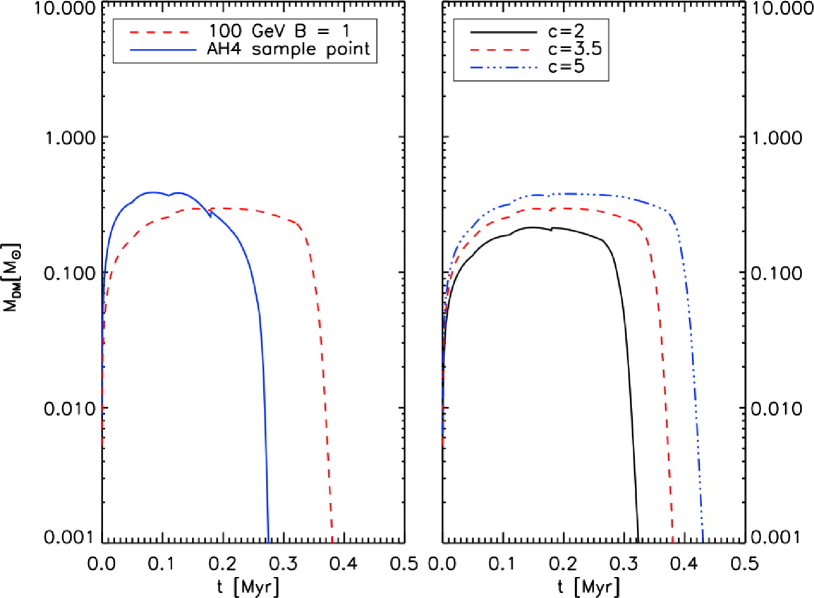
Finally, in Fig. 11 we have plotted the amount of adiabatically contracted DM inside the DS as a function of time. One can also see that DM densities are many orders of magnitude lower than their baryonic counterparts at all times. Although the amount of DM never exceeds , yet this is sufficient to power the DS all the way up to (where most of the mass is baryons) and . Indeed DM heating is a very powerful energy source.
4 Summary and Conclusions
In this paper we have considered the effect on DS of leptophilic boosted DM annihilation cross sections, as would typically be required to explain PAMELA data. Second, we have varied the concentration parameter in a host of DS models. We have restricted our study to include the following two sources of DM: i) the DM originally contained in the star due to adiabatic contraction and ii) the minimal capture scenario. We have not included the additional DM due to extended adiabatic contraction or to maximal capture models discussed in Freese et al. (2010). Nonetheless, the dependence of DS properties on boost factor and concentration parameter can easily be seen in this paper. As our prototypical boosted case, we have focused on the AH4 model with the following parameters: , TeV and . In the unboosted cases, we have taken GeV and three values of the concentration parameter, and .
We have found that, if the positron excess observed by PAMELA is indeed due to leptophilic boosted DM, then there would be an early DS phase of stellar evolution powered by DM heating, lasting long enough to bring the star to substantially higher mass and luminosity than predicted for regular Pop.III zero metallicity stars. Our basic results are that the final stellar properties, after the DS runs out of or its original adiabatically contracted DM fuel, undergoes Kelvin Helmholtz contraction and enters the main sequence, are always roughly the same: , , lifetime yrs. Similarly, these same DS properties are also the basic result independent of the value of the concentration parameter in the range between c=2 and c=5.
We reiterate that these values are only for the case of simple adiabatic contraction and minimal capture; if we were to include the additional DM due to extended AC or maximal capture, then these values would be different by many orders of magnitude. However, the basic dependence on the parameters of interest in this paper would generalize. In particular, the result that the final mass, luminosity, and lifetime are relatively independent of boosted cross section or value of would still hold up. In addition, the slight differences from model to model, discussed in the next paragraph, would also hold up.
We have found that the lifetime, final mass, and final luminosity of the DS, though roughly similar in all cases, do show some dependence on boost factor and concentration parameter. We have found that the DS lifetime is shorter in the boosted case, since the DM is exhausted sooner. On the other hand, the lifetime is longer for higher concentration parameter since there is more DM to begin with. Thus nuclear burning starts earlier in the case of unboosted cross section or low concentration parameter. The DS accretes matter continuously while it remains powered by DM heating. Hence the largest final stellar mass results for the longest living DS, i.e. the unboosted case with the highest values of . In all cases, the final mass is . We have shown the H-R diagram for all cases, studying both the Hayashi track and the approach to fusion power. We have showed that the ‘final’ luminosity at the end of the DS lifetime is in all cases, with the luminosity decreasing slightly as a function of increasing boost factor or decreasing , again because of the more rapidly depleted pool of DM. We have also examined the luminosity evolution of the DS as a function of time. During the DS phase itself, the luminosity is higher/lower for boosted/unboosted cross sections. The reduced luminosity during the DS evolution in the unboosted case is a consequence of the reduced energy production, since DM heating is proportional to annihilation cross section and the square of the DM density. Then at lower cross section (unboosted), a smaller radius is needed to balance the DM energy production and the radiated luminosity. Consequently the unboosted case has higher central densities (both for baryons and DM). Similarly, lower values of have lower luminosity during the DS phase, smaller radii, and higher central density. In all cases the DM density is a minute fraction of the total density, with baryons dominating the gravitational potential; we have shown the density profiles of both components. Again in all cases, the amount of DM inside the star never amounts to more than 0.4, a tiny fraction of a star that grows to ; yet this DM is sufficient to power the star. This is ”the power of darkness.”
Acknowledgements
We acknowledge support from: the DOE and the Michigan Center for Theoretical Physics at the University of MI (C.I. and K.F.); DOE at Fermilab (D.S.). We thank Pearl Sandick for helpful conversations.
References
- Abazajian et al. (2010) Abazajian, K. N., Agrawal, P., Chacko, Z., & Kilic, C. 2010, arXiv:1002.3820
- Abdo et al. (2009a) Abdo, A. A., et al. 2009a, Phys. Rev. Lett., 103, 251101
- Abdo et al. (2009b) —. 2009b, Phys. Rev. Lett., 102, 181101
- Abdo et al. (2010) —. 2010, JCAP, 1004, 014
- Adriani et al. (2009a) Adriani, O., et al. 2009a, Phys. Rev. Lett., 102, 051101
- Adriani et al. (2009b) —. 2009b, Nature, 458, 607
- Adriani et al. (2010) —. 2010, arXiv:1001.3522
- Ahlers et al. (2009) Ahlers, M., Mertsch, P., & Sarkar, S. 2009, Phys. Rev., D80, 123017
- Arkani-Hamed et al. (2009) Arkani-Hamed, N., Finkbeiner, D. P., Slatyer, T. R., & Weiner, N. 2009, Phys. Rev., D79, 015014
- Bahcall (1989) Bahcall, J. N. 1989, Neutrino astrophysics (Cambridge and New York, Cambridge University Press, 1989, 584 p.)
- Bai et al. (2009) Bai, Y., Carena, M., & Lykken, J. 2009, Phys. Rev., D80, 055004
- Bajc et al. (2010) Bajc, B., Enkhbat, T., Ghosh, D. K., Senjanovic, G., & Zhang, Y. 2010, JHEP, 05, 048
- Baltz et al. (2002) Baltz, E. A., Edsjo, J., Freese, K., & Gondolo, P. 2002, Phys. Rev., D65, 063511
- Barger et al. (2009a) Barger, V., Gao, Y., Keung, W. Y., Marfatia, D., & Shaughnessy, G. 2009a, Phys. Lett., B678, 283
- Barger et al. (2009b) Barger, V., Keung, W. Y., Marfatia, D., & Shaughnessy, G. 2009b, Phys. Lett., B672, 141
- Barkana & Loeb (2001) Barkana, R., & Loeb, A. 2001, Phys. Rept., 349, 125
- Barnes & White (1984) Barnes, J., & White, S. D. M. 1984, MNRAS, 211, 753
- Barwick et al. (1997) Barwick, S. W., et al. 1997, Astrophys. J., 482, L191
- Bergstrom et al. (2009) Bergstrom, L., Edsjo, J., & Zaharijas, G. 2009, Phys. Rev. Lett., 103, 031103
- Bertone & Fairbairn (2008) Bertone, G., & Fairbairn, M. 2008, Phys. Rev., D77, 043515
- Bi et al. (2009) Bi, X.-J., et al. 2009, Phys. Rev., D80, 103502
- Blasi (2009) Blasi, P. 2009, Phys. Rev. Lett., 103, 051104
- Blumenthal et al. (1986) Blumenthal, G. R., Faber, S. M., Flores, R., & Primack, J. R. 1986, Astrophys. J., 301, 27
- Boulares (1989) Boulares, A. 1989, Astrophys. J., 342, 807
- Bouquet & Salati (1989) Bouquet, A., & Salati, P. 1989, ApJ, 346, 284
- Bromm & Larson (2004) Bromm, V., & Larson, R. B. 2004, Ann. Rev. Astron. Astrophys., 42, 79
- Catena et al. (2009) Catena, R., Fornengo, N., Pato, M., Pieri, L., & Masiero, A. 2009, arXiv:0912.4421
- Chandrasekhar (1939) Chandrasekhar, S. 1939, An introduction to the study of stellar structure (Chicago, Ill., The University of Chicago press [1939])
- Chang et al. (2008) Chang, J., et al. 2008, Nature, 456, 362
- Chen et al. (2010) Chen, C.-R., Mandal, S. K., & Takahashi, F. 2010, JCAP, 1001, 023
- Chen et al. (2009a) Chen, C.-R., Nojiri, M. M., Takahashi, F., & Yanagida, T. T. 2009a, Prog. Theor. Phys., 122, 553
- Chen & Takahashi (2009) Chen, C.-R., & Takahashi, F. 2009, JCAP, 0902, 004
- Chen et al. (2009b) Chen, C.-R., Takahashi, F., & Yanagida, T. T. 2009b, Phys. Lett., B671, 71
- Cholis et al. (2009a) Cholis, I., Dobler, G., Finkbeiner, D. P., Goodenough, L., & Weiner, N. 2009a, Phys. Rev., D80, 123518
- Cholis et al. (2009b) Cholis, I., Finkbeiner, D. P., Goodenough, L., & Weiner, N. 2009b, JCAP, 0912, 007
- Cholis et al. (2009c) Cholis, I., Goodenough, L., Hooper, D., Simet, M., & Weiner, N. 2009c, Phys. Rev., D80, 123511
- Cirelli et al. (2008) Cirelli, M., Franceschini, R., & Strumia, A. 2008, Nucl. Phys., B800, 204
- Cirelli et al. (2009) Cirelli, M., Kadastik, M., Raidal, M., & Strumia, A. 2009, Nucl. Phys., B813, 1
- Cirelli & Strumia (2008) Cirelli, M., & Strumia, A. 2008, arXiv:0808.3867
- Clayton (1968) Clayton, D. D. 1968, Principles of stellar evolution and nucleosynthesis (New York: McGraw-Hill, 1968)
- de Boer et al. (2002) de Boer, W., Sander, C., Horn, M., & Kazakov, D. 2002, Nucl. Phys. Proc. Suppl., 113, 221
- Delahaye et al. (2009) Delahaye, T., et al. 2009, arXiv:0905.2144
- Di Bernardo et al. (2009) Di Bernardo, G., Gaggero, D., Grasso, D., & collaboration, f. t. F.-L. 2009, arXiv:0912.3887
- Diemand et al. (2007) Diemand, J., Kuhlen, M., & Madau, P. 2007, Astrophys. J., 667, 859
- Diemand et al. (2008) Diemand, J., et al. 2008, Nature, 454, 735
- Feldman et al. (2009) Feldman, D., Liu, Z., & Nath, P. 2009, Phys. Rev., D79, 063509
- Fox & Poppitz (2009) Fox, P. J., & Poppitz, E. 2009, Phys. Rev., D79, 083528
- Freese et al. (2008a) Freese, K., Bodenheimer, P., Spolyar, D., & Gondolo, P. 2008a, Astrophys. J., 685, L101
- Freese et al. (2009) Freese, K., Gondolo, P., Sellwood, J. A., & Spolyar, D. 2009, Astrophys. J., 693, 1563
- Freese et al. (2010) Freese, K., Ilie, C., Spolyar, D., Valluri, M., & Bodenheimer, P. 2010, arXiv:1002.2233
- Freese et al. (2008b) Freese, K., Spolyar, D., & Aguirre, A. 2008b, JCAP, 0811, 014
- Fujita et al. (2009) Fujita, Y., et al. 2009, Phys. Rev., D80, 063003
- Gelmini & Gondolo (2008) Gelmini, G. B., & Gondolo, P. 2008, JCAP, 0810, 002
- Gondolo et al. (2010) Gondolo, P., Huh, J.-H., Kim, H. D., & Scopel, S. 2010, arXiv:1004.1258
- Grajek et al. (2009) Grajek, P., Kane, G., Phalen, D., Pierce, A., & Watson, S. 2009, Phys. Rev., D79, 043506
- Grasso et al. (2009) Grasso, D., et al. 2009, Astropart. Phys., 32, 140
- Guo & Wu (2009) Guo, W.-L., & Wu, Y.-L. 2009, Phys. Rev., D79, 055012
- He (2009) He, X.-G. 2009, Mod. Phys. Lett., A52, 2139
- Hisano et al. (2004) Hisano, J., Matsumoto, S., & Nojiri, M. M. 2004, Phys. Rev. Lett., 92, 031303
- Hooper et al. (2009a) Hooper, D., Blasi, P., & Serpico, P. D. 2009a, JCAP, 0901, 025
- Hooper & Silk (2005) Hooper, D., & Silk, J. 2005, Phys. Rev., D71, 083503
- Hooper et al. (2010) Hooper, D., Spolyar, D., Vallinotto, A., & Gnedin, N. Y. 2010, arXiv:1002.0005
- Hooper et al. (2009b) Hooper, D., Stebbins, A., & Zurek, K. M. 2009b, Phys. Rev., D79, 103513
- Hooper et al. (2004) Hooper, D., Taylor, J. E., & Silk, J. 2004, Phys. Rev., D69, 103509
- Hooper & Zurek (2009) Hooper, D., & Zurek, K. M. 2009, Phys. Rev., D79, 103529
- Ibarra et al. (2009) Ibarra, A., Ringwald, A., Tran, D., & Weniger, C. 2009, JCAP, 0908, 017
- Ibarra & Tran (2009) Ibarra, A., & Tran, D. 2009, JCAP, 0902, 021
- Ibe et al. (2009a) Ibe, M., Murayama, H., Shirai, S., & Yanagida, T. T. 2009a, JHEP, 11, 120
- Ibe et al. (2009b) Ibe, M., Murayama, H., & Yanagida, T. T. 2009b, Phys. Rev., D79, 095009
- Iglesias & Rogers (1996) Iglesias, C. A., & Rogers, F. J. 1996, Astrophys. J., 464, 943
- Iocco (2008) Iocco, F. 2008, Astrophys. J., 677, L1
- Iocco et al. (2008) Iocco, F., et al. 2008, Mon. Not. Roy. Astron. Soc., 390, 1655
- Ishiwata et al. (2009) Ishiwata, K., Matsumoto, S., & Moroi, T. 2009, Phys. Lett., B675, 446
- Kadota et al. (2010) Kadota, K., Freese, K., & Gondolo, P. 2010, arXiv:1003.4442
- Kamionkowski et al. (2010) Kamionkowski, M., Koushiappas, S. M., & Kuhlen, M. 2010, Phys. Rev., D81, 043532
- Kane et al. (2002) Kane, G. L., Wang, L.-T., & Wells, J. D. 2002, Phys. Rev., D65, 057701
- Kippenhahn & Weigert (1990) Kippenhahn, R., & Weigert, A. 1990, Stellar Structure and Evolution (Springer-Verlag)
- Klypin et al. (2010) Klypin, A., Trujillo-Gomez, S., & Primack, J. 2010, arXiv:1002.3660
- Krauss et al. (1985) Krauss, L. M., Freese, K., Press, W., & Spergel, D. 1985, Astrophys. J., 299, 1001
- Lattanzi & Silk (2009) Lattanzi, M., & Silk, J. I. 2009, Phys. Rev., D79, 083523
- Lenzuni et al. (1991) Lenzuni, P., Chernoff, D. F., & Salpeter, E. E. 1991, ApJS, 76, 759
- Malyshev et al. (2009) Malyshev, D., Cholis, I., & Gelfand, J. 2009, Phys. Rev., D80, 063005
- March-Russell et al. (2008) March-Russell, J., West, S. M., Cumberbatch, D., & Hooper, D. 2008, JHEP, 07, 058
- McKee & Tan (2008) McKee, C. F., & Tan, J. C. 2008, ApJ, 681, 771
- Meade et al. (2010) Meade, P., Papucci, M., Strumia, A., & Volansky, T. 2010, Nucl. Phys., B831, 178
- Meade et al. (2009) Meade, P., Papucci, M., & Volansky, T. 2009, JHEP, 12, 052
- Mertsch & Sarkar (2009) Mertsch, P., & Sarkar, S. 2009, Phys. Rev. Lett., 103, 081104
- Moskalenko & Wai (2007) Moskalenko, I. V., & Wai, L. L. 2007, Astrophys. J., 659, L29
- Navarro et al. (1996) Navarro, J. F., Frenk, C. S., & White, S. D. M. 1996, Astrophys. J., 462, 563
- Nelson & Spitzer (2008) Nelson, A. E., & Spitzer, C. 2008, arXiv:0810.5167
- Nomura & Thaler (2009) Nomura, Y., & Thaler, J. 2009, Phys. Rev., D79, 075008
- Omukai & Nishi (1998) Omukai, K., & Nishi, R. 1998, Astrophys. J., 508, 141
- Pallis (2010) Pallis, C. 2010, Nucl. Phys., B831, 217
- Profumo (2005) Profumo, S. 2005, Phys. Rev., D72, 103521
- Profumo (2008) —. 2008, arXiv:0812.4457
- Ripamonti & Abel (2005) Ripamonti, E., & Abel, T. 2005, arXiv:astro-ph/0507130
- Ripamonti et al. (2009) Ripamonti, E., et al. 2009, PoS, IDM2008, 075
- Ripamonti et al. (2010) —. 2010, arXiv:1003.0676
- Ryden & Gunn (1987) Ryden, B. S., & Gunn, J. E. 1987, ApJ, 318, 15
- Salati & Silk (1989) Salati, P., & Silk, J. 1989, ApJ, 338, 24
- Scott et al. (2007) Scott, P., Edsjö, J., & Fairbairn, M. 2007, arXiv:0711.0991
- Scott et al. (2008) Scott, P., Fairbairn, M., & Edsjo, J. 2008, Mon. Not. Roy. Astron. Soc., 394, 82
- Shaviv et al. (2009) Shaviv, N. J., Nakar, E., & Piran, T. 2009, Phys. Rev. Lett., 103, 111302
- Shirai et al. (2009) Shirai, S., Takahashi, F., & Yanagida, T. T. 2009, Physics Letters B, 675, 73
- Sivertsson & Gondolo (2010) Sivertsson, S., & Gondolo, P. 2010, arXiv:1006.0025
- Sommerfeld (1931) Sommerfeld, A. 1931, Annalen der Physik, 403, 257
- Spolyar et al. (2009) Spolyar, D., Bodenheimer, P., Freese, K., & Gondolo, P. 2009, Astrophys. J., 705, 1031
- Spolyar et al. (2008) Spolyar, D., Freese, K., & Gondolo, P. 2008, Phys. Rev. Lett., 100, 051101
- Springel et al. (2008) Springel, V., et al. 2008, Mon. Not. Roy. Astron. Soc., 391, 1685
- Tan & McKee (2004) Tan, J. C., & McKee, C. F. 2004, Astrophys. J., 603, 383
- Taoso et al. (2008) Taoso, M., Bertone, G., Meynet, G., & Ekstrom, S. 2008, Phys. Rev., D78, 123510
- Tinker et al. (2010) Tinker, J. L., et al. 2010, arXiv:1001.3162
- Yin et al. (2009) Yin, P.-f., et al. 2009, Phys. Rev., D79, 023512
- Yoon et al. (2008) Yoon, S.-C., Iocco, F., & Akiyama, S. 2008, Astrophys. J., 688, L1
- Yoshida et al. (2003) Yoshida, N., Abel, T., Hernquist, L., & Sugiyama, N. 2003, Astrophys. J., 592, 645
- Yoshida et al. (2006) Yoshida, N., Omukai, K., Hernquist, L., & Abel, T. 2006, Astrophys. J., 652, 6
- Young (1980) Young, P. 1980, ApJ, 242, 1232
- Zackrisson et al. (2010a) Zackrisson, E., et al. 2010a, arXiv:1002.3368
- Zackrisson et al. (2010b) —. 2010b, arXiv:1006.0481
- Zhao et al. (2009) Zhao, D. H., Jing, Y. P., Mo, H. J., & Boerner, G. 2009, Astrophys. J., 707, 354
- Zhao et al. (2003) Zhao, D.-H., Jing, Y. P., Mo, H. J., & Borner, G. 2003, Astrophys. J., 597, L9
- Zurek (2009) Zurek, K. M. 2009, Phys. Rev., D79, 115002