AN EXTREMELY CARBON-RICH, EXTREMELY METAL-POOR STAR IN THE SEGUE 1 SYSTEM111Observations obtained for ESO program P383.B-0038, using VLT-UT2/UVES
Abstract
We report the analysis of high-resolution, high- spectra of an extremely metal-poor, extremely C-rich red giant, Seg 1–7, in the Segue 1 system – described in the literature alternatively as an unusually extended globular cluster or an ultra-faint dwarf galaxy. The radial velocity of Seg 1–7 coincides precisely with the systemic velocity of Segue 1, and its chemical abundance signature of [Fe/H] = –3.52, [C/Fe] = +2.3, [N/Fe] = +0.8, [Na/Fe] = +0.53, [Mg/Fe] = +0.94, [Al/Fe] = +0.23 and [Ba/Fe] –1.0 is similar to that of the rare and enigmatic class of Galactic halo objects designated CEMP-no (Carbon-rich, Extremely Metal-Poor and with no enhancement (over solar ratios) of heavy neutron-capture elements). This is the first star in a Milky Way “satellite” that unambiguously lies on the metal-poor, C-rich branch of the Aoki et al. (2007) bimodal distribution defined by field halo stars in the ([C/Fe], [Fe/H])–plane. Available data permit us only to identify Seg 1–7 as a member of an ultra-faint dwarf galaxy or as debris from the Sgr dwarf spheroidal galaxy. In either case, this demonstrates that at extremely low abundance, [Fe/H ] , star formation and associated chemical evolution proceeded similarly in the progenitors of both the field halo and satellite systems. By extension, this is consistent with other recent suggestions the most metal-poor dwarf spheroidal and ultra-faint dwarf satellites were the building blocks of the Milky Way’s outer halo.
1 INTRODUCTION
Studies of the Milky Way’s dwarf spheroidal and ultra-faint satellite galaxies are placing important constraints on the role these systems have played in the formation of its halo populations. Early work on stars in the classical dwarf spheroidal galaxies (dSph), concerning the abundance of the elements Mg and Ca (relative to Fe) in the range –2.0 [Fe/H] –1.0, established that their [/Fe] values are significantly lower than in the bulk of Galactic halo stars in the solar neighborhood at the same [Fe/H] – suggesting that there is a fundamental difference between the halo and its dwarf galaxies (see e.g. Tolstoy, Hill & Tosi 2009, and references therein). These lower values of [/Fe] reflect the extended star-formation histories of the host systems (see Gilmore & Wyse 1991; Unavane, Wyse & Gilmore 1996). Recently, however, work by Nissen & Schuster (2010) on field halo stars, testing the suggestion of Carollo et al. (2007, 2010) that the Galaxy’s halo comprises inner and outer components having distinct chemical abundance distributions and kinematics, clearly established there are two distinct components in the ([/Fe], [Fe/H])-plane at –1.6 [Fe/H] –0.8, in the sense that stars in retrograde Galactic orbits (which Carollo et al. identify as characteristic of the outer halo) have lower [/Fe] than those on prograde orbits (predominantly the inner halo). Another relevant result is that at [Fe/H] –3.7 in these dwarf galaxies the relative abundances of a large number of elements are quite similar to those found in the majority of Galactic halo red giants (Frebel, Kirby, & Simon 2010a (Sculptor: 8 elements); Norris et al. 2010a (Boötes I: 15 elements)).
Parallel investigations on the relative abundances of carbon ([C/Fe]) below [Fe/H] = –3.0 by Frebel et al. (2010b) and Norris et al. (2008, 2010b) demonstrate a large range in [C/Fe] in the ultra-faint dwarf galaxies, with similar [C/Fe] patterns in the ultra-faint systems and in the Galactic halo. The purpose of the present Letter is to investigate further the result of Norris et al. (2010b), based on intermediate resolution spectroscopy, that in the extreme ultra-faint Segue 1 system (M –1.5, baryonic mass 1000M⊙; Belokurov et al. 2007, Martin et al. 2008) there is an extremely metal-poor giant, Seg 1–7, ([Fe/H] –3.5) which is also extremely carbon rich ([C/Fe] +2.3). Further, Seg 1–7 lies almost 4 nominal half-light radii from the center of Segue 1 and its membership has important implications for the structure and nature of the system.
2 OBSERVATIONS
Seg 1–7 has coordinates h m s and . data are available from Data Release 7 of the Sloan Digital Sky Survey (Abazajian et al. 2009). Adopting E(B–V) = 0.032 (Geha et al. 2009) and following Schlegel, Finkbeiner, & Davis (1998), we obtain (g–r)0 = 0.596 0.009 and (r–z)0 = 0.354 0.012 for Seg 1–7.
2.1 High-resolution Spectroscopy
Seg 1–7 was observed in Service Mode at the Very Large Telescope (VLT) Unit Telescope 2 (UT2) with the Ultraviolet-Visual Echelle Spectrograph (UVES) (Dekker et al. 2000) on five nights during the period 2010 January 27 through March 12, during which 11 individual exposures were obtained, each having integration time of 46 min. The instrumental setup was as described in our investigation of Boo1137, a red giant member of Boötes I (Norris et al. 2010a, hereafter NYGW), and will not be repeated here. Suffice it to say that spectra were obtained over the wavelength ranges 3300–4520 Å, 4620–5600 Å, and 5680–6650 Å. The 11 pipeline-reduced spectra were co-added to produce the final spectra which have per Å pixel increasing from 25 to 50 over 3700–4500 Å, roughly constant at 65 over 4620–5600 Å, and increasing from 70 to 100 over 5680–6650 Å.
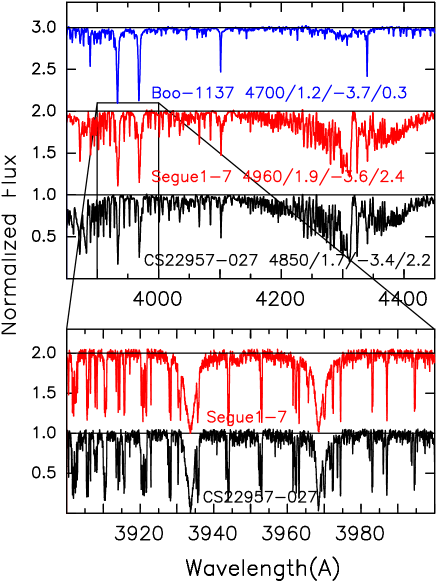
The spectra of Seg 1–7 have weak metal lines and absorption dominated by features of the CH molecule, bearing a strong resemblance to the extremely metal-poor, C-rich, CEMP-no star222 CEMP-no stars are metal-poor objects having [C/Fe] 1.0 and [Ba/Fe] 0.0, the “no” referring to the lack of enhancement in neutron-capture elements (Beers & Christlieb 2005, their Table 2). CS22957–027, first analyzed at high resolution and high by Norris, Ryan & Beers (1997). The nature of the spectra is shown in Figure 1, where in the upper panel Seg 1–7 is compared with CS22957–027 and the “normal” extremely metal-poor red giant Boo1137, all of which have very similar , log , and [Fe/H] as shown in the figure. For heuristic purposes, these spectra have been broadened with a Gaussian having FWHM = 1.0 Å. The important point of the panel is the enormous CH blanketing present in Seg 1–7 and CS22957–027, and its absence from Boo1137. As colleague S.G. Ryan wrote upon first observing CS22957–027 at high resolution in this wavelength region: “Actually, it’s hard to see anything except CH.” The lower panel in Figure 1 presents the original, unbroadened, spectra over the wavelength range 3900–4000 Å. We make three comments on these spectra. First, the similarity in the strength of the broad Ca II H & K lines at 3933.6 Å and 3968.4 Å, suggests the two stars have similar heavy element abundances. Second, most of the other lines are due to CH. Third, several of the features appear double in CS22957–027 but not in Seg 1–7. We shall return to this point in Section 3, but note here that the extra features in CS22957–027 are 13CH lines and result from the lower 12C/13C ratio of CS22957–027 compared with that of Seg 1–7.
2.2 Line Strength Measurements
Line strengths for atomic species were measured by J.E.N., as described in some detail in NYGW. Results are presented in Table 1, where columns (1) and (2) give identification, and (3)–(5) contain lower excitation potential, log , and equivalent widths. The atomic data are from Cayrel et al. (2004), except for one line as indicated in the table. There was one essential difference between the present and earlier work: because the blue part of the Seg 1–7 spectrum is heavily contaminated by CH lines we followed our earlier procedure for CS22957–027 (see Norris et al. 1997) and used spectrum synthesis techniques to determine when one might expect blending of CH lines with atomic features to contaminate the latter. We did not measure atomic features when such contamination was possibly present.
2.3 Radial Velocity
We measured the radial velocity for each of our 11 observations using cross correlation techniques against a model synthetic spectrum as described by NYGW. The resulting heliocentric radial velocity is 204.3 0.1 km s-1 (internal error), while the range in velocities was 203.7–204.6 km s-1, suggesting that the velocity of Seg 1–7 was essentially constant over the six week period covered by the observations. The external error in the velocity is 0.5 km s-1. According to Simon et al. (2010) the systemic velocity of Segue 1 is 208.5 0.9 km s-1, with dispersion 3.7 km s-1. Our radial velocity data are thus consistent with Seg 1–7 being a member of the system.
3 ABUNDANCE ANALYSIS
The effective temperature and surface gravity of Seg 1–7, based on photometry, the synthetic colors of Castelli333http://wwwuser.oat.ts.astro.it/castelli/colors/sloan.html, and the Yale–Yonsei (YY) Isochrones (Demarque et al. 2004) are = 4960 140 K and log = 1.9 0.4 (Norris et al. 2010b). Adopting procedures described in NYGW, we analyzed the equivalent widths in Table 1444Our abundance for Si is based on Si I 4102.94 Å (slightly contaminated by the wing of H) for which we adopted spectrum synthesis techniques., together with the (0,0) and (1,1) bands of the electronic transition of the CH molecule in the interval 4250–4330 Å, and the (0,0) and (1,1) bands of the electronic transition of the NH molecule in the range 3340–3400 Å using a 2009 version of the LTE stellar line analysis program MOOG (Sneden 1973), modified to include a proper treatment of continuum scattering (Sobeck et al. 2010 in prep.), together with the 1D, LTE model atmosphere atmospheres of Castelli & Kurucz (2003) to determine abundances for 14 elements, together with limits for a further three. (In our earlier work we established that these techniques produce abundances for atomic species in excellent agreement with those of Cayrel et al. (2004), when applied to their data set (see NYGW, Section 3.2)). For Seg 1–7, our analysis yielded a microturbulent velocity = 1.3 km s-1 and the abundances presented in Table 2555While this microturbulence is somewhat lower than expected, we note that of the 35 extremely metal-poor red giants analyzed by Cayrel et al (2004, their Table 5) six have 1.5 km s-1., where columns (1)–(5) contain species, number of lines measured (or, alternatively, that synthetic spectrum techniques were adopted), log((X) (= log(N(X)/N(H))star + 12.00), its error, and the relative abundance [X/Fe], respectively. The final column in the table contains the total error in relative abundance, determined by quadratic addition of the internal error in column (5) and the systematic errors caused by errors in atmospheric parameters – () = 140 K, (log ) = 0.4, ([Fe/H]) = 0.3, and () = 0.3 km s-1 – following NYGW. Inspection of Table 2 confirms that, with [Fe/H] = –3.52, [C/Fe] = +2.3 and [Ba/Fe] –1.0, Seg 1–7 is indeed a CEMP-no star.
Finally, as noted in Section 2.1, the features of 13CH are not seen in Seg 1–7, in contrast to their clear presence in CS22957–027, which has 12C/13C = 10 5 (Norris et al. 1997). For Seg 1–7 we estimate a lower limit for 12C/13C of 50 10 from the CH features at 4019 and 4237 Å.
4 DISCUSSION
4.1 Relative Abundances of Seg 1–7 and the Galactic halo C-rich stars
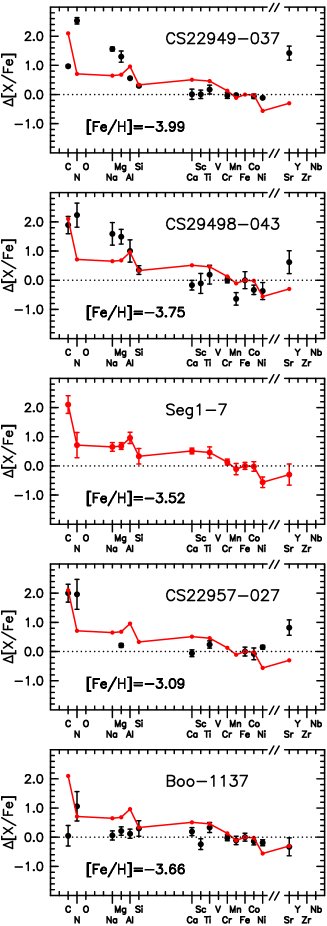
Figure 2 presents the difference in relative abundances, [X/Fe], between Seg 1–7, Galactic halo CEMP-no red giants having –4.0 [Fe/H] –3.0, and the C-normal Boo1137, on the one hand, and the “unmixed” Galactic halo red giant branch (RGB) stars of Spite et al. (2005)666We adopt the average values of [X/Fe] for the 12 “unmixed” RGB stars in Table 3 of Spite et al. (2005) that have –4.0 [Fe/H] –3.0, excluding the CEMP-r star CS22892-052. These objects are chosen to minimize the effect of internal mixing that occurs above the so-called “RGB bump” in the color magnitude diagram of metal-poor red giants (Gratton et al. 2000; Spite et al. 2005)., on the other, as a function of elemental species. Boo1137 is included to contrast the abundance patterns of the CEMP-no class with that of a “normal” extremely metal-poor RGB star in the ultra-faint dwarf galaxy Boötes I. One sees very little difference between Boo1137 and the “unmixed” red giants of the Galactic halo (see NYGW for a more detailed discussion). In the middle panel of the figure, the data for Seg 1–7 have been connected by a continuous line, which has been copied to the other panels to facilitate comparison between Seg 1–7 and the other objects. The top four panels show that CEMP-no stars comprise a somewhat heterogeneous group. First, [C/N] varies considerably among the Galactic halo objects in the figure, from –1.4 in CS22949–037 to +0.2 in CS22957–027, accompanied by a range in 12C/13C from 4 to 10, respectively, both of which suggest that the CN(O) cycle(s) have been more vigorous in the former than in the latter. We note that Seg 1–7 has [C/N] = +1.5 and 12C/13C 50, presumably having experienced less extreme CN(O) processing. Second, while enhancement of Na, Mg, Al is frequently present in the CEMP-no class (as first demonstrated for Mg and Al by Aoki et al. (2002)) and seen here in Seg 1–7, no enhancement of [Mg/Fe] is evident in CS22957–027.
These differences notwithstanding, the relative abundances of Seg 1–7, taken as a whole, are consistent with its classification as a CEMP-no star. What is the origin of this peculiar class of objects? While binarity has provided a most likely explanation for the CEMP-s subclass (enhanced s-process neutron-capture elements; see e.g. Lucatello et al. 2005), no such case has yet been generally demonstrated for CEMP-no objects, and to the authors’ knowledge only CS22957–027 among the CEMP-no class exhibits direct evidence for duplicity (Preston & Sneden 2001). A stronger argument against binarity is that it offers no insight into the enhancements of Na, Mg, and Al seen in a large fraction of the class. A considerably more successful, but somewhat ad hoc, explanation of the CEMP-no phenomenon is the “mixing-and-fallback” model of Nomoto and co-workers (see Nomoto et al. 2008, and references therein) which postulates low energy supernova explosions at the earliest times, with preferential expulsion of outer layers accompanied by fallback of inner ones, resulting in the light elements C–Mg being relatively more enhanced than the heavier ones.
That said, enrichment/mixing processes in star forming regions that produce stars at [Fe/H] = –3.5 with [C/Fe] 1.5 and stars at [Fe/H] = –2.0 with [C/Fe] = 0.0 (see Norris et al. 2010b) remain obscure. Segue 1 provides the first opportunity to quantify the evolution of element ratios in a single system over the metallicity range from extremely metal-poor with extreme carbon enhancement, through extremely metal-poor with no carbon enhancement, to metal-poor.
4.2 Membership of Segue 1
The Segue 1 system was discovered by Belokurov et al. (2007), who identified it as “an unusually extended globular cluster”, possibly associated with the Sagittarius dSph. Niederste-Ostholt et al. (2009) argued that determination of Segue 1 membership is fraught with difficulty by contamination of debris from the Sgr dSph. Geha et al. (2009) and Simon et al. (2010), on the other hand, having obtained accurate radial velocities for some 70 putative Segue 1 members within 3.0rh (half-light radii), inferred a total mass within rh of 5.8 105M⊙ together with M/LV = 3400M⊙/L⊙, and concluded that it is a dark-matter-dominated dwarf galaxy. They also reported two members with [Fe/H] –3.3, together with stars as metal-rich at [Fe/H] = –1.6, consistent with the abundance range found by Norris et al. (2010b).
Here we center our attention on whether Seg 1–7 is a member of the Segue 1 system. First, we recall from Section 2.3 that its heliocentric radial velocity of 204.3 0.5 km s-1 is clearly consistent with membership. Second, it lies 16.9′ from the center of the system, corresponding to 3.8 half-light radii (rh = 4.4′, Martin et al. 2008). If one adopts the surface brightness distribution of Martin et al., the probability of membership of Seg 1–7 is 0.03 times that of an object lying at half-light radius – a moderately small likelihood. Third, we recall that in the range –4.0 [Fe/H] –3.0 CEMP-no red giants are extremely rare in the Milky Way halo. For example, in the Beers, Preston, & Shectman (1992) survey for metal-poor stars there are some 14 red giants in this abundance range with 14.5 and 0.60, only two of which (CS22949–037 and CS22957–027) are known to be CEMP-no stars777We derive this from the high-resolution abundance compilation of Frebel (2010, https://www.cfa.harvard.edu/afrebel/abundances/abund.html)., over an area of 2300 deg2.
4.3 Fraction of CEMP stars as a Function of [Fe/H]
It is well known that the fraction of CEMP stars in the Galactic halo increases as [Fe/H] decreases, as summarized, for example, by Norris et al. (2007, their Figure 1). For stars having [Fe/H] –3.0 and high-resolution, high-, abundances, the fraction increases from 0.1 at [Fe/H] = –3.0, to 1.0 below [Fe/H] –4.2. It is then of interest that while the number of stars in Segue 1 having the necessary observational data is small, the fraction of CEMP stars at [Fe/H] –3.5 is 0.3. We also note in passing that almost all C-rich stars currently known with [Fe/H] –3.3, and for which [Ba/Fe] has been detected, belong to the CEMP-no subclass. (Of particular interest are the three stars with [Fe/H] –4.5, all of which are C-rich: HE0557–4840 ([Fe/H] = –4.8) is CEMP-no (Norris et al. 2007); HE0107–5240 ([Fe/H] = –5.4) has only an upper limit for Ba of [Ba/Fe] +0.82 (Christlieb et al. 2002, 2004); and HE1327–2326 ([Fe/H] = –5.6) has [Ba/Fe] +1.5, but [Sr/Fe] 1.0 (Frebel et al. 2005; Aoki et al. 2006.)
Before concluding, we comment here on the CEMP classification. As clearly demonstrated by Aoki et al. (2007, their Figure 3), over the range –4.0 [Fe/H] –1.0 the distribution of stars in the ([C/Fe], [Fe/H])–plane is bimodal, with a separation between C-rich and C-normal subgroups at [C/Fe] –0.52[Fe/H] –0.23. We shall refer here to the C-rich subgroup as extremely carbon-rich, noting that not all CEMP stars fall within this category – at [Fe/H] = –3.5, for example, an extremely C-rich star has [C/Fe] +1.6. Insofar as we consider that Figure 3 of Aoki et al. (2007) provides a strong constraint on the nature of carbon richness in metal-poor stars we find this preferable to the somewhat arbitrary use of [C/Fe] +1.0 as a definition of C-rich stars. With this background, we note that some red giants with [Fe/H] –3.0 in other ultra-faint dwarf galaxies are known to contain moderate carbon enhancements: in the range 0.5 [C/Fe] 0.8, Frebel et al. (2010b) find a C-rich fraction of 2/3 for UMa II, while Norris et al. (2010b) report 1/3 for Boötes I. We do not regard these as extremely C-rich (i.e. above the Aoki et al. (2007) threshold).
4.4 Conclusion
What may one conclude? First, Seg 1–7 has a radial velocity consistent with membership of the kinematic system defined by Simon et al. (2010), which, taken together with the extreme rarity of CEMP-no red giants, suggests it is not a member of the Galactic halo field. Seg 1–7 is thus associated with either the central concentration of Segue 1, or with the more widely spread debris of Sgr advocated by Niederste-Ostholt et al. (2009) to be a contaminant of the system. Possibly inconsistent with membership of the central concentration is the somewhat low probability that it is associated with the Segue 1 spatial distribution defined by Martin et al. (2008). An interpretation one might consider is that the Martin et al. radial brightness profile is not an adequate description of the baryonic mass distribution within the Segue 1 system, which is instead better described by the Niederste-Ostholt et al. (2009) photometric map, with significant east-west extension. That said, we consider it safe to conclude that Seg 1–7 originated in a dwarf galaxy system – either Segue 1 or Sgr – that contained extremely metal-poor material ([Fe/H] –3.0).
Seg 1–7 is the first extremely metal-poor, extremely C-rich star to be associated with a dwarf galaxy satellite of the Milky Way, as opposed to the general field of its halo. Thus not only are there extremely metal-poor, “C-normal” stars in the Galaxy’s dwarf satellites with abundance signatures similar to those of the Galaxy’s halo, but also objects with extreme carbon enhancements, [C/Fe] = +2.3, similar to those found in the halo. Such C-rich stars are extremely rare, and membership (or past membership) of Seg 1–7 in a dwarf galaxy now located within the outer Milky Way shows that at extremely low abundance, [Fe/H ] –3.0, chemical evolution proceeded similarly in both the progenitors of the field halo and dwarf satellite systems, consistent with the view that the latter played a role in the formation of the Milky Way’s outer halo.
Facilities: VLT:Kueyen(UVES)
References
- (1)
- (2) Abazajian, K.N. et al. 2009, ApJS, 182, 543
- (3)
- (4) Aoki, W., Beers, T.C., Christlieb, N., Norris, J.E., Ryan, S.G., & Tsangarides, S. 2007, ApJ, 655, 492
- (5)
- (6) Aoki, W. et al. 2006, ApJ, 639, 897
- (7)
- (8) Aoki, W., Norris, J.E., Ryan, S.G., Beers, T.C., & Ando, H. 2002, ApJ, 576, L141
- (9)
- (10) Aoki, W., Norris, J.E., Ryan, S.G., Beers, T.C., Christlieb, N., Tsangarides, S., & Ando, H. 2004, ApJ, 608, 971
- (11)
- (12) Beers, T.C. & Christlieb, N. 2005, ARA&A, 43, 531
- (13)
- (14) Beers, T.C., Preston, G.W., & Shectman, S.A. 1992, AJ, 103, 1987
- (15)
- (16) Belokurov, V. et al. 2007, ApJ, 654, 897
- (17)
- (18) Carollo, D., Beers, T.C., Chiba, M., Norris, J.E., Freeman, K.C., Lee, Y.S., Ĭvezić, Z., Rockosi, C.M., & Yanny, B. 2010, ApJ, 712, 692
- (19)
- (20) Carollo, D. et al. 2007, Nature, 450, 1020
- (21)
- (22) Castelli, F. & Kurucz, R.L. 2003, in IAU Symposium 210 “Modelling of Stellar Atmospheres”, eds. N. Piskunov, W.W. Weiss, & D.F. Gray (San Francisco: ASP) p.A20 (astro-ph/0405087)
- (23)
- (24) Cayrel, R. et al. 2004, A&A, 416, 1117
- (25)
- (26) Christlieb, N., Bessell, M.S., Beers, T.C., Gustafsson, B., Korn, A., Barklem, P.S., Karlsson, T., Mizuno-Wiedner, M., & Rossi, S. 2002, Nature, 419, 904
- (27)
- (28) Christlieb, N., Gustafsson, B., Korn, A.J., Barklem, P.S., Beers, T.C., Bessell, M.S., Karlsson, T., & Mizuno-Wiedner, M. 2004, ApJ, 603, 708
- (29)
- (30) Dekker, H., D’Odorico, S., Kaufer, A., Delabre, B., & Kotzlowski, H. 2000, Proc.SPIE, 4008, 534
- (31)
- (32) Demarque, P., Woo, J.-H., Kim, Y.-C., & Yi, S.K. 2004, ApJS, 155, 667
- (33)
- (34) Depagne, E. et al. 2002, A&A, 390, 187
- (35)
- (36) Frebel, A. 2010, Astronomische Nachrichten, 331, 474
- (37)
- (38) Frebel, A. et al. 2005, Nature, 434, 871
- (39)
- (40) Frebel, A., Kirby, E.N., & Simon, J.D. 2010a, Nature, 464, 72
- (41)
- (42) Frebel, A., Simon, J.D., Geha, M., & Willman, B. 2010b, ApJ, 708, 560
- (43)
- (44) Geha, M., Willman, B., Simon, J.D., Strigari, L.E., Kirby, E.N., Law, D.R., & Strader, J. 2009, ApJ, 692, 1464
- (45)
- (46) Gilmore, G. & Wyse, R.F.G. 1991, ApJ, 367, L55
- (47)
- (48) Gratton, R.G., Sneden, C., Carretta, E., & Bragaglia, A. 2000, A&A, 354, 169
- (49)
- (50) Kupka, F., Piskunov, N., Ryabchikova, T.A., Stempels, H.C., & Weiss, W.W. 1999, A&AS, 138, 119
- (51)
- (52) Lucatello, S., Tsangarides, S., Beers, T.C., Carretta, E., Gratton, R.G., & Ryan, S.G. 2005, ApJ, 625, 825
- (53)
- (54) Martin, N.F., de Jong, J.T.A., & Rix, H.-W. 2008, ApJ, 684, 1075
- (55)
- (56) Niederste-Ostholt, M., Belokurov, V., Evans, N.W., Gilmore, G., Wyse, R.F.G., & Norris, J.E. 2009, MNRAS, 398, 1771
- (57)
- (58) Nissen, P.E. & Schuster, W.J. 2010, A&A, 511, L10
- (59)
- (60) Nomoto, K., Tominaga, N., Tanaka, M., Maeda, K., & Umeda, H. 2008, in IAU Symposium 250 “Massive Stars as Cosmic Engines”, eds. F. Bresolin, P.A. Crowther, & J. Puls (Cambridge: CUP) p. 463
- (61)
- (62) Norris, J.E., Christlieb, N., Korn, A.J., Eriksson, K., Bessell, M.S., Beers, T.C., Wisotzki, L., Reimers, D. 2007, ApJ, 670, 774
- (63)
- (64) Norris, J.E., Gilmore, G., Wyse, R.F.G., Wilkinson, M.I., Belokurov, V., Evans, N.W., & Zucker, D.B. 2008, ApJ, 689, L113
- (65)
- (66) Norris, J.E., Ryan, S.G., & Beers, T.C. 1997, ApJ, 489, L169
- (67)
- (68) Norris, J.E., Wyse, R.F.G., Gilmore, G., Yong, D., Frebel, A., Wilkinson, M.I., Belokurov, V., & Zucker, D.B. 2010b, ApJ, submitted (astro-ph/1008.0137)
- (69)
- (70) Norris, J.E., Yong, D., Gilmore, G., & Wyse, R.F.G. 2010a, ApJ, 711, 350 (NYGW)
- (71)
- (72) Preston, G.W. & Sneden, C. 2001, AJ, 122, 1545
- (73)
- (74) Schlegel, D.J., Finkbeiner, D.P., & Davis, M. 1998, ApJ, 500, 525
- (75)
- (76) Simon, J.D. et al. 2010, ApJ, submitted (astro-ph/1007.4198)
- (77)
- (78) Sneden. C. 1973, ApJ, 184, 839
- (79)
- (80) Spite, M. et al. 2005, A&A, 430, 655
- (81)
- (82) Tolstoy, E., Hill, V., & Tosi, M. 2009, ARA&A, 47, 371
- (83)
- (84) Unavane, M., Wyse, R.F.G. & Gilmore, G. 1996, MNRAS, 278, 727
- (85)
| Species | (Å) | (eV) | (dex) | (mÅ) | (dex) |
|---|---|---|---|---|---|
| (1) | (2) | (3) | (4) | (5) | (6) |
| O I | 6300.304 | 0.00 | 9.78 | 10 | 7.35 |
| Na I | 5889.951 | 0.00 | 0.11 | 104 | 3.17 |
| Na I | 5895.924 | 0.00 | 0.19 | 92 | 3.20 |
| Mg I | 3829.355 | 2.71 | 0.21 | 148 | 5.07 |
| Mg I | 3832.304 | 2.71 | 0.15 | 166 | 4.89 |
| Mg I | 5172.684 | 2.71 | 0.38 | 149 | 5.07 |
| Mg I | 5183.604 | 2.72 | 0.16 | 157 | 4.96 |
| Mg I | 5528.405 | 4.34 | 0.34 | 40 | 4.76 |
| Al I | 3961.520 | 0.01 | 0.34 | 102 | 3.08 |
| Ca I | 4226.728 | 0.00 | 0.24 | 163 | 3.78 |
| Ca I | 4318.652 | 1.90 | 0.21 | 34 | 3.64 |
| Ca I | 5265.556 | 2.52 | 0.26 | 11 | 3.67 |
| Ca I | 5588.749 | 2.52 | 0.21 | 24 | 3.62 |
| Ca I | 5857.451 | 2.93 | 0.23 | 12 | 3.66 |
| Ca I | 6102.723 | 1.88 | 0.79 | 13 | 3.54 |
| Ca I | 6122.217 | 1.89 | 0.32 | 32 | 3.60 |
| Ca I | 6162.173 | 1.90 | 0.09 | 44 | 3.63 |
| Ca I | 6439.075 | 2.52 | 0.47 | 34 | 3.56 |
| Ti I | 3998.636 | 0.05 | 0.06 | 30 | 1.91 |
| Ti II | 3759.296 | 0.61 | 0.27 | 113 | 1.96 |
| Ti II | 3761.323 | 0.57 | 0.17 | 108 | 1.91 |
| Ti II | 3913.468 | 1.12 | 0.41 | 73 | 2.00 |
| Ti II | 4012.385 | 0.57 | 1.75 | 41 | 1.80 |
| Ti II | 4443.794 | 1.08 | 0.70 | 68 | 1.94 |
| Ti II | 4464.450 | 1.16 | 1.81 | 31 | 2.27 |
| Ti II | 4468.507 | 1.13 | 0.60 | 91 | 2.59 |
| Ti II | 4501.273 | 1.12 | 0.76 | 55 | 1.70 |
| Ti II | 5188.680 | 1.58 | 1.05 | 31 | 1.94 |
| Ti II | 5226.543 | 1.57 | 1.23 | 26 | 1.99 |
| Ti II | 5336.771 | 1.58 | 1.63 | 18 | 2.18 |
| Cr I | 4254.332 | 0.00 | 0.11 | 64 | 1.91 |
| Cr I | 5206.038 | 0.94 | 0.02 | 27 | 1.87 |
| Cr I | 5208.419 | 0.94 | 0.16 | 30 | 1.80 |
| Mn I | 4033.062 | 0.00 | 0.62 | 32 | 1.31aaValue has been increased by 0.40 following Cayrel et al. (2004) |
| Fe I | 3758.233 | 0.96 | 0.03 | 96 | 3.61 |
| Fe I | 3763.789 | 0.99 | 0.24 | 91 | 3.72 |
| Fe I | 3765.539 | 3.24 | 0.48 | 22 | 3.51 |
| Fe I | 3787.880 | 1.01 | 0.86 | 75 | 3.84 |
| Fe I | 3815.840 | 1.48 | 0.24 | 97 | 3.90 |
| Fe I | 3827.823 | 1.56 | 0.06 | 95 | 4.11 |
| Fe I | 3865.523 | 1.01 | 0.98 | 63 | 3.52 |
| Fe I | 3899.707 | 0.09 | 1.53 | 94 | 4.05 |
| Fe I | 3922.912 | 0.05 | 1.65 | 87 | 3.90 |
| Fe I | 4005.242 | 1.56 | 0.61 | 70 | 3.97 |
| Fe I | 4045.812 | 1.48 | 0.28 | 102 | 3.90 |
| Fe I | 4063.594 | 1.56 | 0.07 | 90 | 3.89 |
| Fe I | 4071.738 | 1.61 | 0.02 | 97 | 4.22 |
| Fe I | 4132.058 | 1.61 | 0.67 | 73 | 4.14 |
| Fe I | 4143.868 | 1.56 | 0.46 | 67 | 3.68 |
| Fe I | 4233.603 | 2.48 | 0.60 | 20 | 3.64 |
| Fe I | 4260.474 | 2.40 | 0.02 | 66 | 4.13 |
| Fe I | 5171.596 | 1.49 | 1.79 | 34 | 3.97 |
| Fe I | 5191.455 | 3.04 | 0.55 | 15 | 4.00 |
| Fe I | 5194.942 | 1.56 | 2.09 | 12 | 3.73 |
| Fe I | 5216.274 | 1.61 | 2.15 | 16 | 4.00 |
| Fe I | 5232.940 | 2.94 | 0.06 | 26 | 3.71 |
| Fe I | 5266.555 | 3.00 | 0.39 | 18 | 3.89 |
| Fe I | 5269.537 | 0.86 | 1.32 | 94 | 4.34 |
| Fe I | 5324.179 | 3.21 | 0.24 | 16 | 3.91 |
| Fe I | 5328.039 | 0.92 | 1.47 | 80 | 4.14 |
| Fe I | 5328.532 | 1.56 | 1.85 | 30 | 4.01 |
| Fe I | 5371.490 | 0.96 | 1.65 | 69 | 4.04 |
| Fe I | 5397.128 | 0.92 | 1.99 | 53 | 3.91 |
| Fe I | 5405.775 | 0.99 | 1.84 | 60 | 4.02 |
| Fe I | 5429.697 | 0.96 | 1.88 | 57 | 3.95 |
| Fe I | 5434.524 | 1.01 | 2.12 | 44 | 3.94 |
| Fe I | 5446.917 | 0.99 | 1.91 | 47 | 3.78 |
| Fe I | 5455.609 | 1.01 | 2.09 | 47 | 3.98 |
| Fe I | 5497.516 | 1.01 | 2.85 | 19 | 4.08 |
| Fe I | 6137.692 | 2.59 | 1.40 | 15 | 4.29 |
| Fe I | 6393.601 | 2.43 | 1.58 | 11 | 4.11 |
| Fe II | 4233.172 | 2.58 | 1.90 | 25 | 3.79 |
| Fe II | 4923.927 | 2.89 | 1.50bbFrom VALD; Kupka et al. 1999 (http://www.astro.uu.se/vald/) | 40 | 4.04 |
| Co I | 3845.461 | 0.92 | 0.01 | 61 | 2.12 |
| Co I | 3995.302 | 0.92 | 0.22 | 27 | 1.51 |
| Co I | 4118.767 | 1.05 | 0.49 | 25 | 1.90 |
| Co I | 4121.311 | 0.92 | 0.32 | 23 | 1.54 |
| Ni I | 3858.292 | 0.42 | 0.97 | 50 | 2.16 |
| Sr II | 4077.710 | 0.00 | 0.16 | 37 | 2.18 |
| Sr II | 4215.520 | 0.00 | 0.16 | 40 | 1.81 |
| Ba II | 4934.076 | 0.00 | 0.15 | 10 | 2.31 |
| Eu II | 4129.725 | 0.00 | 0.20 | 10 | 2.20 |
| Species | N | s.e.logϵaaUncertainty of the fit in the case of spectrum synthesis; standard error of the mean for species having at least two line strength measurements | [X/Fe] | ||
|---|---|---|---|---|---|
| (1) | (2) | (3) | (4) | (5) | (6) |
| C(CH) | synbbDetermined using spectrum synthesis | 0.30 | |||
| N(NH) | synbbDetermined using spectrum synthesis | 0.42 | |||
| O I | 1 | … | |||
| Na I | 2 | 0.13 | |||
| Mg I | 5 | 0.11 | |||
| Al I | 1 | 0.19 | |||
| Si I | synbbDetermined using spectrum synthesis | 0.26 | |||
| Ca I | 9 | 0.09 | |||
| Ti I | 1 | 0.18 | |||
| Ti II | 11 | 0.19 | |||
| Cr I | 3 | 0.10 | |||
| Mn I | 1 | 0.19 | |||
| Fe I | 37 | 0.09 | |||
| Fe II | 2 | 0.25 | |||
| Co I | 4 | 0.16 | |||
| Ni I | 1 | 0.18 | |||
| Sr II | 2 | 0.27 | |||
| Ba II | 1 | … | |||
| Eu II | 1 | … |