High-Pressure Electrical Resistivity Measurements of EuFe2As2 Single Crystals
Abstract
High-pressure electrical resistivity measurements up to 3.0 GPa have been performed on EuFe2As2 single crystals with residual resistivity ratios = 7 and 15. At ambient pressure, a magnetic / structural transition related to FeAs-layers is observed at = 190 K and 194 K for samples with = 7 and 15, respectively. Application of hydrostatic pressure suppresses , and then induces similar superconducting behavior in the samples with different values. However, the critical pressure 2.7 GPa, where 0, for the samples with = 15 is slightly but distinctly larger than 2.5 GPa for the samples with = 7.
1 Introduction
Since the discovery of superconductivity in LaFeAs(O,F) with = 26 K [1], a family of Fe-pnictide superconductors has attracted much attention. In particular, Fe2As2 ( = Ca, Sr, Ba, Eu, etc.) with a tetragonal ThCr2Si2-type structure has been intensively studied because of the availability of stoichiometric single crystals with high quality. It turned out that, in Fe-pnictide compounds, the superconducting (SC) ground state could appear in accordance with the suppression of a magnetic/structural transition by doping [2]. In the phase diagrams, it is argued that the superconductivity could coexist and/or compete with the antiferromagnetism [3, 4]. However, a random potential introduced by doping could smear the intrinsic SC properties. For understanding the origin of the high- superconductivity with up to 55 K [5], it is of considerable importance to probe the systematic change of ground states using high-quality single crystals. An alternative way to tune the ground state is to apply hydrostatic pressure (). For instance, recent high- ac-susceptibility and resistivity measurements have revealed that Fe2As2 ( = Sr, Eu) exhibits -induced bulk superconductivity by suppressing the magnetic/structural transition [610]. Meanwhile, superconductivity under hydrostatic is absent in CaFe2As2 [1114], and remains a controversial issue in BaFe2As2 [8, 1517]
Among the Fe2As2 series, EuFe2As2 is quite unique because the localized Eu2+ moments order antiferromagnetically at 20 K, in addition to the magnetic/structural transition related to FeAs-layers at 190 K [1821]. Interestingly, the magnetic order of Eu2+ moments can be detected even in the SC state induced by doping or application of pressure, which could be a main reason for the novel reentrant-SC-like behavior [9, 10, 2225].
Here, we report the results of high- electrical resistivity measurements in EuFe2As2 using newly grown single crystals with a residual resistivity ratio () as high as 15. At ambient , the magnetic/structural transition occurs at a higher temperature of = 194 K, compared with 190 K for single crystals with = 7. Consequently, it is found that the higher quality single crystal requires higher- to suppress , and to induce the SC ground state in EuFe2As2.
2 Experimental Details
Single crystals of EuFe2As2 were grown by Bridgman method from a stoichiometric mixture of the constituent elements. In this study, we examined several crystals from two different batches with residual resistivity ratios = 7 and 15, where is defined as . Single crystals measured in Ref [10] were taken from a batch with = 7. High-pressure resistivity measurements of samples with = 7 and 15 have been performed simultaneously up to 3.0 GPa using a hybrid-type piston cylinder pressure device [26]. The resistivity was measured by the four-probe method with an ac current = 0.3 mA in the - plane. To generate hydrostatic pressure, Daphne 7474 (Idemitsu Kosan) oil, which remains in a liquid state up to 3.7 GPa at room temperature [27], was used as a pressure-transmitting medium. Samples were cooled down in Oxford 4He system, slowly with an average rate of 0.5 K/min. Applied pressure was estimated at 4.2 K from the resistance change of a calibrated Manganin wire [28].
3 Results and Discussions
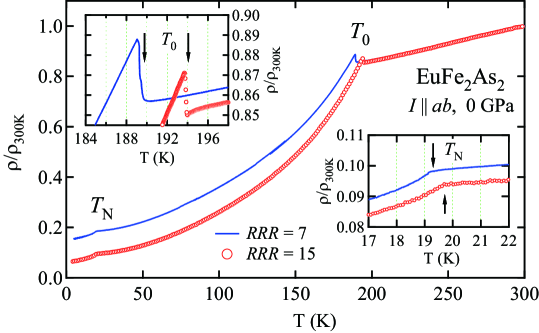
Figure 1 shows the temperature () dependence of electrical resistivity scaled at 300 K () in EuFe2As2 single crystals with = 7 and 15, where is determined as . The measurement was performed in zero field at ambient pressure outside a pressure device with current direction . To our knowledge, = 15 is the largest value in EuFe2As2 single crystals [9, 21, 29]. Overall -variations of the resistivity in the samples with = 7 and 15 are qualitatively similar to each other, and are consistent with previous results [9, 20, 21, 29]. It is worthwhile to mention that, as shown in the upper left inset, a magnetic/structural transition temperature = 194 K for the sample with = 15 is higher than = 190 K for the sample with = 7. This would be the reason why samples with = 15 needs higher pressure () to suppress , as will be discussed below. The Néel temperature of the localized Eu2+ moments for the sample with = 15 is slightly higher than the value for the sample with = 7, as can be seen in the lower right inset.
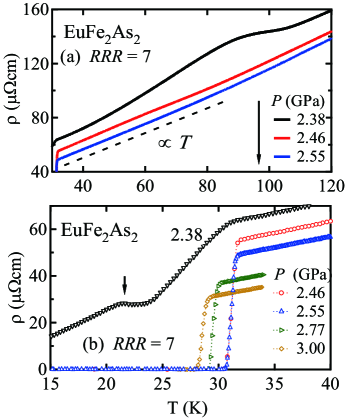
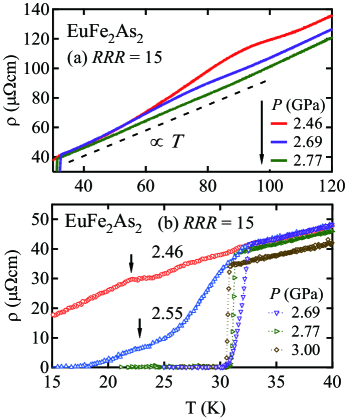
Next, we turn to the pressure effect on the electrical resistivity for the samples with = 7 (Fig. 3) and 15 (Fig. 3), which are simultaneously measured in the same pressure device. With increasing , the resistivity peak related to the magnetic/structural transition is suppressed to a lower temperature in both samples as shown in Figs. 3(a) and 3(a). For the sample with = 7, a reminiscence of the peak is clearly recognized at 2.38 GPa around 100 K, and faintly visible at 2.46 GPa around 70 K as shown in Fig. 3(a). At 2.55 GPa, there is no detectable anomaly, which implies that the critical pressure , where 0, may be about 2.5 GPa. For the sample with = 15, would be 2.7 GPa since the resistivity hump is slightly recognized at 2.69 GPa, but undetectable at 2.77 GPa as shown in Fig. 3(a). It is of interest that the resistivity follows nearly -linear behavior above at 2.55 and 2.77 GPa ( ) for samples with = 7 and 15, respectively, as guided by a dashed line. A similar -variation of resistivity was also reported in several optimally-doped Fe-pnictide superconductors [4, 3032]. For the sample with = 7, a resistivity upturn and a small maximum, as indicated by an arrow in Figs. 3(b), in the broad SC transition below 31 K are observed at = 2.38 GPa ( ). It suggests that the superconductivity is suppressed by the magnetic order of the Eu2+ moments; consequently, reentrant-SC-like behavior appears. A similar behavior is also slightly seen for the sample with = 15 (Figs. 3(b)), but more smeared out. At , resistivity exhibits sharp SC transitions to zero-resistivity with 30 K for both samples. With increasing , the SC transitions persist up to 3.00 GPa although the continuously decreases. Thus, the -variation of the resistive behavior between the samples with different quality is qualitatively similar to each other, and is consistent with the previous result [10]. However, 2.7 GPa for the sample with = 15 is slightly but distinctly larger than 2.5 GPa for the sample with = 7, which may be as a consequence of the larger value of for the higher-quality sample at ambient-. We have repeated similar high- resistivity measurements using several single crystals, and confirmed that the observed difference in the magnitude of and between the samples with = 7 and 15 is beyond the error of the pressure estimation ( 2 - 3 10-2 GPa) [28]. Another meaningful issue, which probably relates to the sample quality, is the width of a SC transition . The minimum values of are 1 K and 0.8 K for samples with = 7 and 15, respectively. These facts suggest that the higher-quality single crystals have larger values of and as well as a sharper SC transition in EuFe2As2.
Until now, there has been no report concerning the quantum oscillation in EuFe2As2, despite the importance for understanding the Fermi surface topology and mass renormalization. In fact, we have already tried de Haas-van Alphen (dHvA) measurements of EuFe2As2 using the samples with = 7 at 0.6 K with fields up to 35 T, but could not detect any dHvA oscillation. Given that quantum oscillations were successfully detected in SrFe2As2 ( 8) [33] and BaFe2As2( 10) [34], it is worthwhile to perform the dHvA measurement of EuFe2As2 using the newly grown single crystals with = 15.
4 Conclusions
We have performed high-pressure electrical resistivity measurements up to 3.0 GPa in EuFe2As2 single crystals with = 7 and 15. At ambient pressure, a magnetic/structural transition occurred at = 190 K and 194 K for the samples with = 7 and 15, respectively. Although -induced superconductivity was confirmed in the samples with different values, the critical pressure 2.7 GPa for the samples with = 15 was slightly but distinctly larger than 2.5 GPa for the samples with = 7.
References
References
- [1] Kamihara Y, Watanabe T, Hirano M and Hosono H 2008 J. Am. Chem. Soc. 130 3296
- [2] Ishida K, Nakai Y and Hosono H 2009 J. Phys. Soc. Jpn. 78 062001 and references therein.
- [3] Chen H, Ren Y, Qiu Y, Bao W, Liu R H, Wu G, Wu T, Xie Y L, Wang X F, Huang Q and Chen X H 2009 Europhys. Lett. 85 17006
- [4] Wang X F, Wu T, Wu G, Liu R H, Chen H, Xie Y L and Chen X H 2009 New J. Phys. 11 045003
- [5] Ren Z A, Lu W, Yang J, Yi W, Shen X L, Li Z C, Che G C, Dong X L, Sun L L, Zhou F and Zhou Z X 2008 Chin. Phys. Lett. 25 2215
- [6] Alireza P L, Ko Y T C, Gillett J, Petrone C M, Cole J M, Lonzarich G G and Sebastian S E 2009 J. Phys.: Condens. Matter 21 012208
- [7] Kotegawa H, Sugawara H and Tou H 2009 J. Phys. Soc. Jpn. 78 013709
- [8] Matsubayashi K, Katayama N, Ohgushi K, Yamada A, Munakata K, Matsumoto T and Uwatoko Y 2009 J. Phys. Soc. Jpn. 78 073706
- [9] Miclea C F, Nicklas M, Jeevan H S, Kasinathan D, Hossain Z, Rosner H, Gegenwart P, Geibel C and Steglich F 2009 Phys. Rev. B 79 212509
- [10] Terashima T, Kimata M, Satsukawa H, Harada A, Hazama K, Uji S, Suzuki H S, Matsumoto T and Murata K 2009 J. Phys. Soc. Jpn. 78 083701
- [11] Torikachvili M S, Bud’ko S L, Ni N and Canfield P C 2008 Phys. Rev. Lett. 101 057006.
- [12] Park T, Park E, Lee H, Klimczuk T, Bauer E D, Ronning F and Thompson J D 2009 J. Phys.: Condens. Matter 20 322204
- [13] Lee H, Park E, Park T, Sidorov V A, Ronning F, Bauer E D and Thompson J D 2009 Phys. Rev. B 80 024519
- [14] Yu W, Aczel A A, Williams T J, Bud’ko S L, Ni N, Canfield P C and Luke G M 2009 Phys. Rev. B 79 020511
- [15] Ishikawa F, Eguchi N, Kodama M, Fujimaki K, Einaga M, Ohmura A, Nakayama A, Mitsuda A and Yamada Y 2009 Phys. Rev. B 79 172506
- [16] Colombier E, Bud’ko S L, Ni N and Canfield P C 2009 Phys. Rev. B 80 224518
- [17] Yamazaki T, Takeshita N, Kobayashi R, Fukazawa H, Kohori Y, Kihou K, Lee C.-H., Kito H, Iyo A and Eisaki H 2010 Phys. Rev. B 81 224511
- [18] Raffius H, Mörsen E, Mosel B D, Müller Warmuth W, Jeitschko W, Terbüchte L and Vomhof T 1993 J. Phys. Chem. Solids 54 135
- [19] Tegel M, Rotter M, Weiss V, Schappacher F M, Pottgen R and Johrendt D 2008 J. Phys.: Condens. Matter 20 452201
- [20] Ren Z, Zhu Z W, Jiang S, Xu X F, Tao Q, Wang C, Feng C M, Cao G H and Xu Z A 2008 Phys. Rev. B 78 052501
- [21] Jeevan H S, Hossain Z, Kasinathan D, Rosner H, Geibel C and Gegenwart P 2008 Phys. Rev. B 78 052502
- [22] Ren Z, Lin X, Tao Q, Jiang S, Zhu Z, Wang C, Cao G and Xu Z 2008 Phys. Rev. B 78 092406.
- [23] Jiang S, Xing H, Xuan G, Ren Z, Wang C, Xu Z and Cao G 2009 Phys. Rev. B 80 184514.
- [24] Ren Z, Tao Q, Jiang S, Feng C, Wang C, Dai J, Cao G and Xu Z 2009 Phys. Rev. Lett. 102 137002.
- [25] Zheng Q J, He Y, Wu T, Wu G, Chen H, Ying J J, Liu R H, Wang X F, Xie Y L, Yan Y J, Li Q J and Chen X H 2009 arXiv:0907.5547v1
- [26] Uwatoko Y, Hedo M, Kurita N, Koeda M, Abliz M and Matsumoto T 2003 Physica C 329-333 1658
- [27] Murata K, Yokogawa K, Yoshino H, Klotz S, Munsch P, Irizawa A, Nishiyama M, Iizuka K, Nanba T, Okada T, Shiraga Y and Aoyama S 2008 Rev. Sci. Instrum. 79 085101
- [28] Terashima T, Tomita M Kimata M, Satsukawa H, Harada A, Hazama K, Uji S, Suzuki H S, Matsumoto T and Murata K 2009 J. Phys. Soc. Jpn. 78 118001
- [29] Mitsuda A, Matoba T, Wada H, Ishikawa F and Yamada Y 2010 J. Phys. Soc. Jpn. 79 073704
- [30] Liu R H, Wu G, Wu T, Fang D F, Chen H, Li S Y, Liu K, Xie Y L, Wang X F, Yang R L, Ding L, He C, Feng D L and Chen X H 2008 Phys. Rev. Lett. 101 087001
- [31] Gooch M, Bing L, Lorenz B, Guloy A M and Chu C W 2009 Phys. Rev. B 79 104504
- [32] Jiang S, Xing H, Xuan G, Wang C, Ren Z, Feng C, Dai J, Xu Z and Cao G 2009 J. Phys.: Condens. Matter 21 382203
- [33] Sebastian S E, Gillett J, Harrison N, Lau P H C, Singh D J, Mielke C H and Lonzarich G G 2008 J. Phys.: Condens. Matter 20 422203
- [34] Analytis J G, McDonald R D, Chu J -H, Riggs S C, Bangura A F, Kucharczyk C, Johannes M and Fisher I R 2009 Phys. Rev. B 80 064507