Dynamic Surface Tension of Aqueous Solutions of Ionic Surfactants: Role of Electrostatics
Abstract
The adsorption kinetics of the cationic surfactant dodecyltrimethylammonium bromide at the air-water interface has been studied by the maximum bubble pressure method at concentrations below the critical micellar concentration. At short times, the adsorption is diffusion-limited. At longer times, the surface tension shows an intermediate plateau and can no longer be accounted for by a diffusion limited process. Instead, adsorption appears kinetically controlled and slowed down by an adsorption barrier. A Poisson-Boltzmann theory for the electrostatic repulsion from the surface does not fully account for the observed potential barrier. The possibility of a surface phase transition is expected from the fitted isotherms but has not been observed by Brewster angle microscopy.
1 Introduction
Over the last decades, the adsorption kinetics of surfactants at fluid interfaces has been the subject of many studies due to its prime importance in numerous applications such as wetting, detergency, foaming and emulsification1. Adsorption kinetics is commonly studied by creating a freshly exposed surface in contact with a bulk surfactant solution and measuring the temporal dependence of its surface tension. This dynamic surface tension2, 3 has been shown to correlate much better than the equilibrium surface tension with properties crucial for applications, such as foaming ability of surfactant solutions and the spreading velocity of fluid films on top of solid substrates4, 5.
Experimental work on dynamic surface tension stimulated over the years theoretical modeling. In their pioneering model from the 1940s, Ward and Tordai6 assumed that the adsorption is limited by diffusion (DLA), resulting in an asymptotic decay as the inverse square root of time. The Ward-Tordai model is still widely used nowadays to analyze dynamic surface tension data. Yet, the improved accuracy achieved in recent years has revealed important deviations from the DLA behavior in several systems7. These deviations have been attributed to a number of factors such as the existence of kinetic adsorption barriers, especially for charged systems2; the role of surface-active impurities8; lateral relaxation modes in the monolayer plane9; and the formation of surface crystals10. We note that the effect of electrostatic barriers on the kinetics of surfactant aggregation was analyzed also in the different context of ionic micelles 11.
For example, an anomalous long time decay with an intermediate plateau has been observed for the ionic solutions of sodium dodecylsulfate (SDS) with no added salt. Since surfactant hydrolysis produces trace amounts of dodecanol that slowly adsorb at the water-air interface, some authors attributed the peculiar surface tension kinetics to these surface-active impurities8. A similar anomalous behavior was reported for aqueous solutions of aerosol OT4, 12, as well as for SDS at the alkane-water interface.13 In the latter case, dodecanol impurities are not expected to accumulate at the interface and to affect the adsorption dynamics because they are soluble in the alkane phase13.
While the origin of non-DLA-like behavior is not well understood for all systems, there is strong evidence that the adsorption of pure nonionic surfactants is usually diffusion-limited15, 16. For ionic surfactant solutions, however, an electrostatic surface potential is progressively created as the adsorption proceeds. This surface potential acts as an adsorption barrier for additional surfactant molecules as they migrate from the bulk toward the surface, thus potentially giving rise to a non-DLA behavior. The dynamic surface tension of ionic surfactants (SDS) at the oil-water interface was previously shown to be different from DLA behavior17, but when salt was added to the ionic surfactant solution, the process returned to a DLA-like behavior. This can be explained by electrostatic screening of the surface potential in the presence of added electrolyte.
In the present work we extend the results of Ref 17 to the adsorption of ionic surfactants at the air-water interface. We have studied aqueous solutions of the cationic surfactant dodecyltrimethylammonium bromide (DTAB) at various concentrations below the critical micellar concentration (cmc) using the maximal bubble pressure (MBP) method. At short times the kinetic behavior is found to be DLA-like, while at longer times the kinetics appears to be slowed down by an adsorption barrier. The experimental results are analyzed and compared with the theoretical predictions of Ref 15. The influence of the adsorption barrier is better seen just before the critical micellar concentration (cmc) and working below the cmc has the advantage that the theoretical interpretation is more straightforward as it does not have to take into account the presence of micelles. In the SDS case, hydrolysis produces dodecanol, which is very surface active at these concentrations (at oil-water interfaces it is less a problem, because dodecanol is solubilised in the oil phase). We have chosen here to work with DTAB instead of SDS, because DTAB is much more stable chemically.
2 Materials and Methods
Dodecyltrimethylammonium bromide (DTAB) was supplied by Sigma ( purity) and used without further purification. De-ionized water was obtained from a DEIONEX MS 160 equipment, with a resistivity of 12 M. All the measurements were performed at C, and the solutions were prepared by dilution of concentrated stock solutions. The equilibrium surface tension measurements were conducted using a circular Teflon trough (capacity 5 ml), housed in a Plexiglas box with an open-frame version of the Wilhelmy plate. We used a rectangular open frame ( mm), made of a platinum wire and attached to a force transducer mounted on a motor, allowing it to be drawn away from the surface at a controlled constant rate19.
The dynamic surface tension was measured by a maximum bubble pressure (MBP) method. This in-house-made instrument (described in Ref 20) is used to measure the maximum pressure necessary to detach a bubble from a capillary. The surface tension is then obtained from the Young-Laplace equation, , where is the maximum pressure difference between the gas in the bubble and the surrounding liquid, and is the internal radius of the capillary. We have used a glass capillary with an inner diameter of 200 m, hydrophobized with hexamethyldisilazane (Sigma). The advantage of such a device over methods based on analysis of the bubble (or drop) shape, is that it allows access to short adsorption times, down to about 10 ms, whereas the shape methods are limited to times longer than 1 or 2 s. The MBP instrument was tested with the non-ionic surfactant Triton X100, and the results were found to be compatible with DLA kinetics, indicating that uncontrolled convection effects were negligible even at times down to s.
With the MBP instrument, the bubble surface age is usually associated with the time interval between consecutive detachments of two bubbles. However, there is a dead time (delay) between the detachment of a bubble and the formation of the next bubble. In a recent paper, Christov et al.21 showed that the effective aging time of the interface, , is smaller than and proportional to the time actually measured between consecutive detachments, : , where is an apparatus constant described in more details in Ref 20. From the experiments with Triton X-100 and its diffusion constant ( cm2/s) the apparatus constant, , is obtained. In the following, all the curves are represented as a function of the corrected time, .
Since it is known that different MBP experimental setups give different dynamic surface tension curves 18, experiments were also performed with a commercial MBP instrument (MPT2 from Lauda) for comparison with the in-house made apparatus. We also employed a Brewster angle microscope (Mini-BAM from NFT) together with a Langmuir trough (NIMA 601BAM) to image the surface monolayer and visualize any of its possible surface heterogeneities.
3 Results
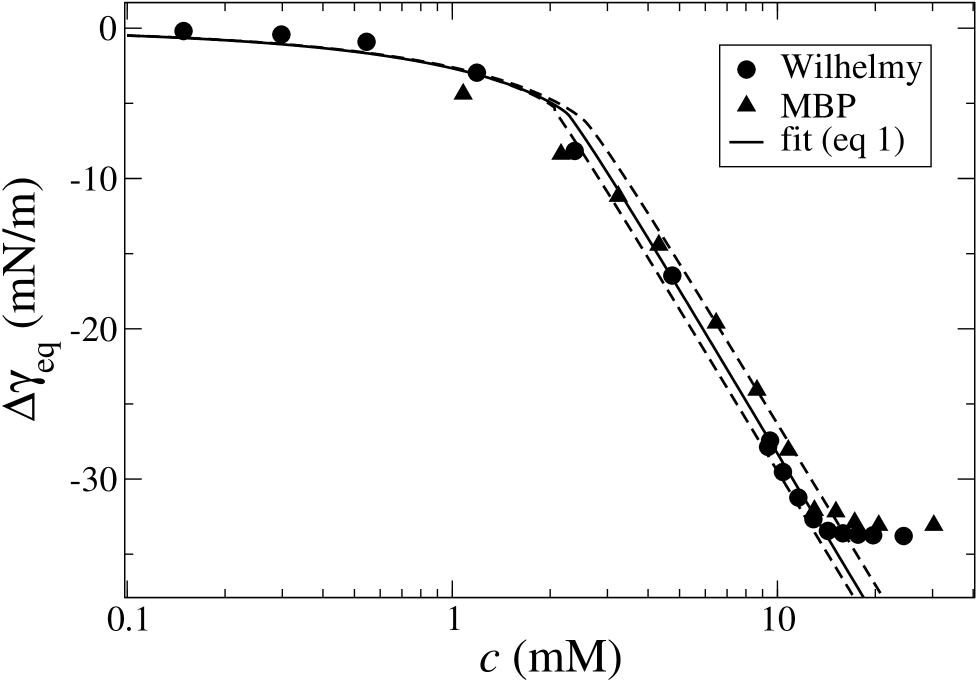
1 shows the reduction in the equilibrium surface tension, , for salt-free DTAB solutions as a function of the DTAB concentration , where is the bare air-water surface tension. The data obtained by the two methods — the Wilhelmy plate and the MBP at long times (all measurements reach the equilibrium values for s) — are in good agreement. For concentrations above the cmc ( mM), the surface tension saturates to a constant value, mN/m.
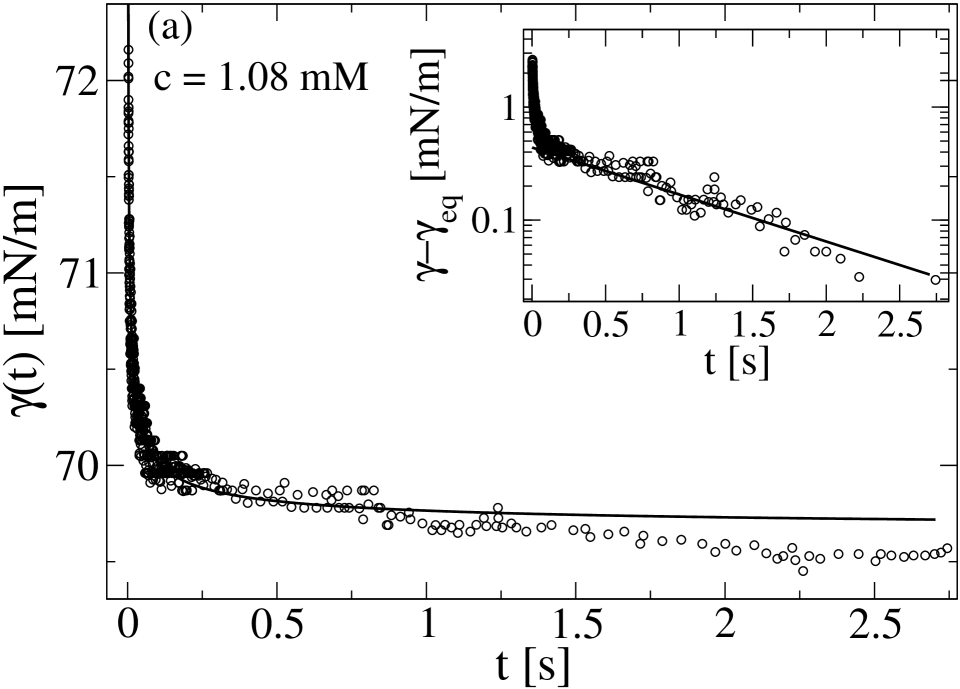
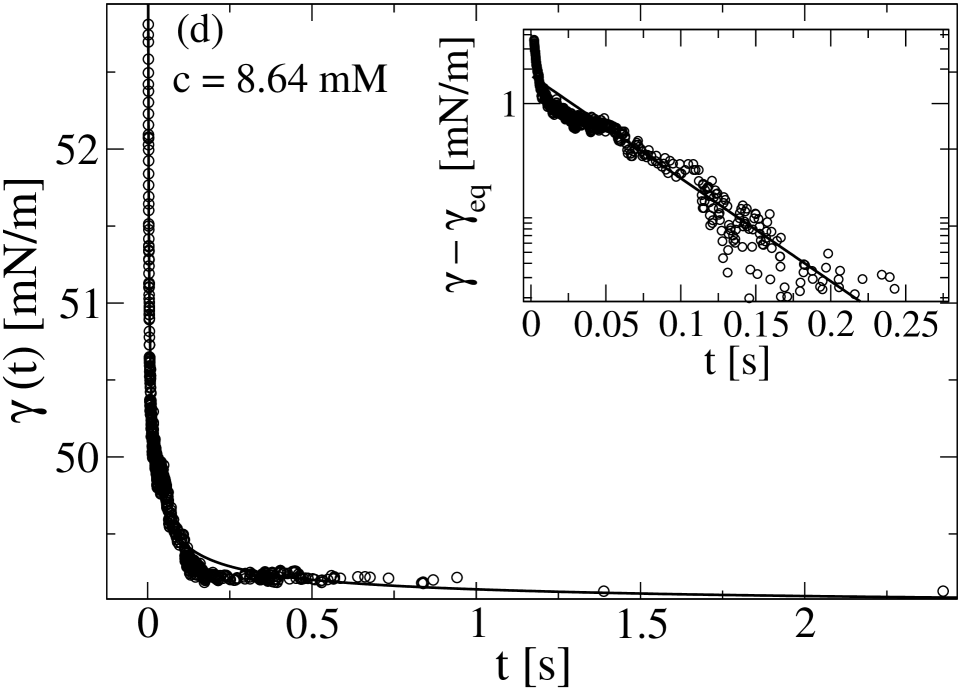
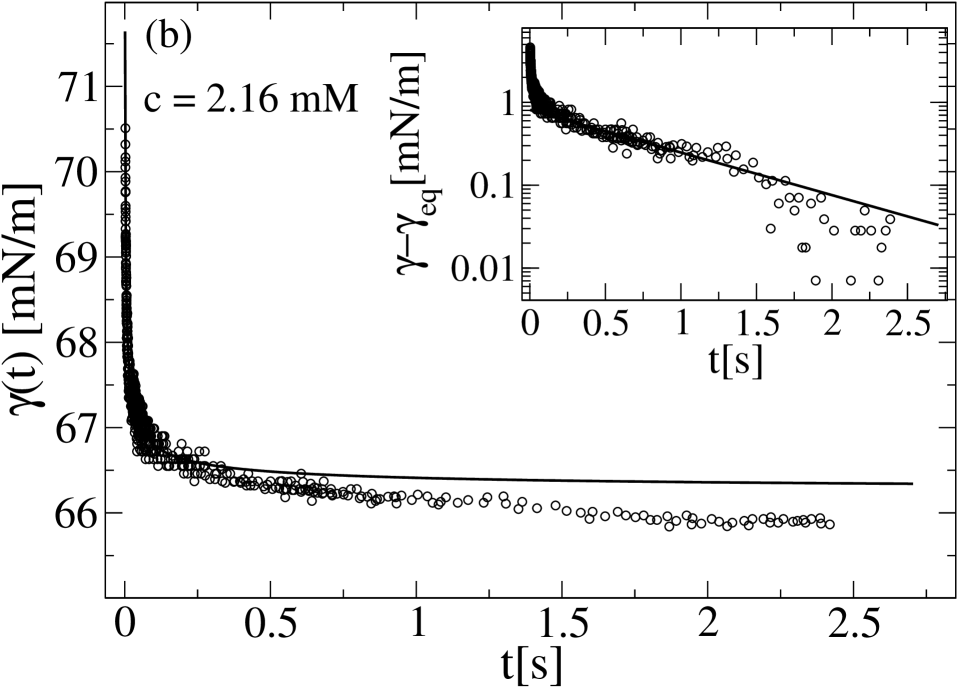
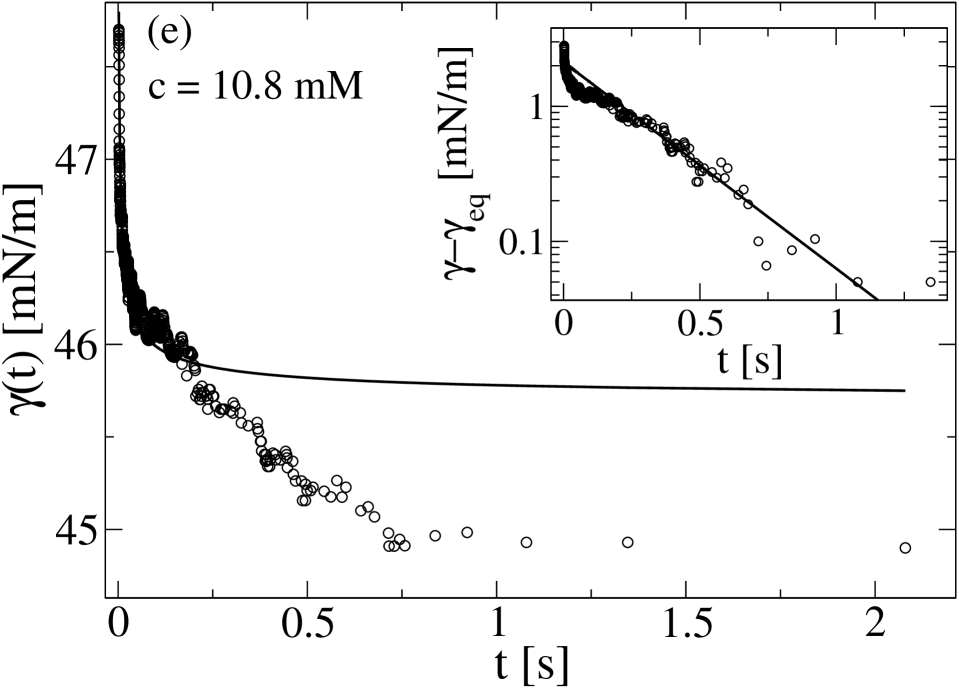
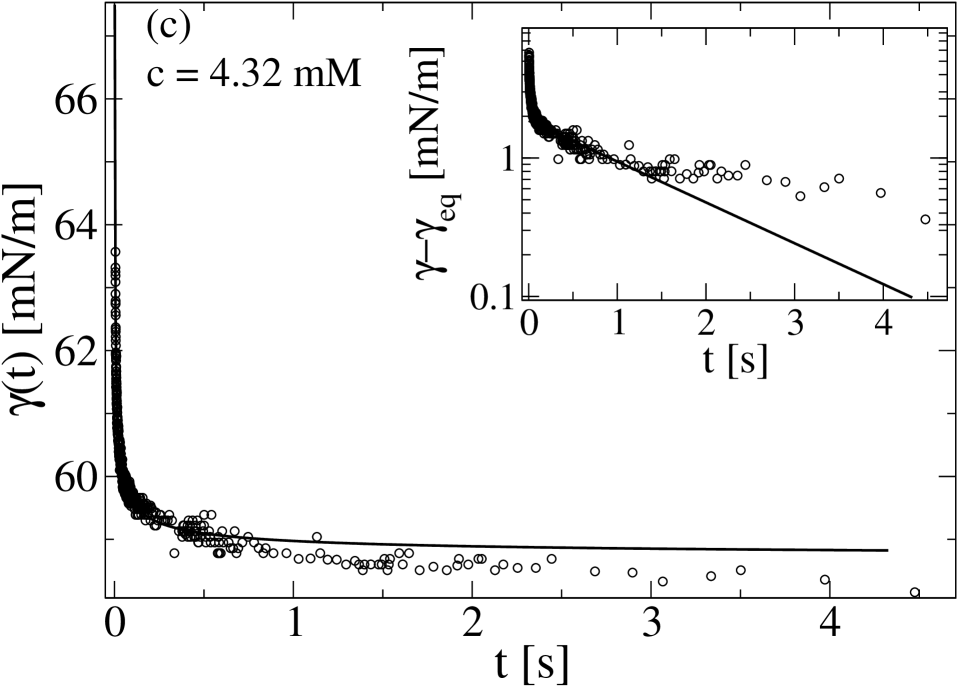
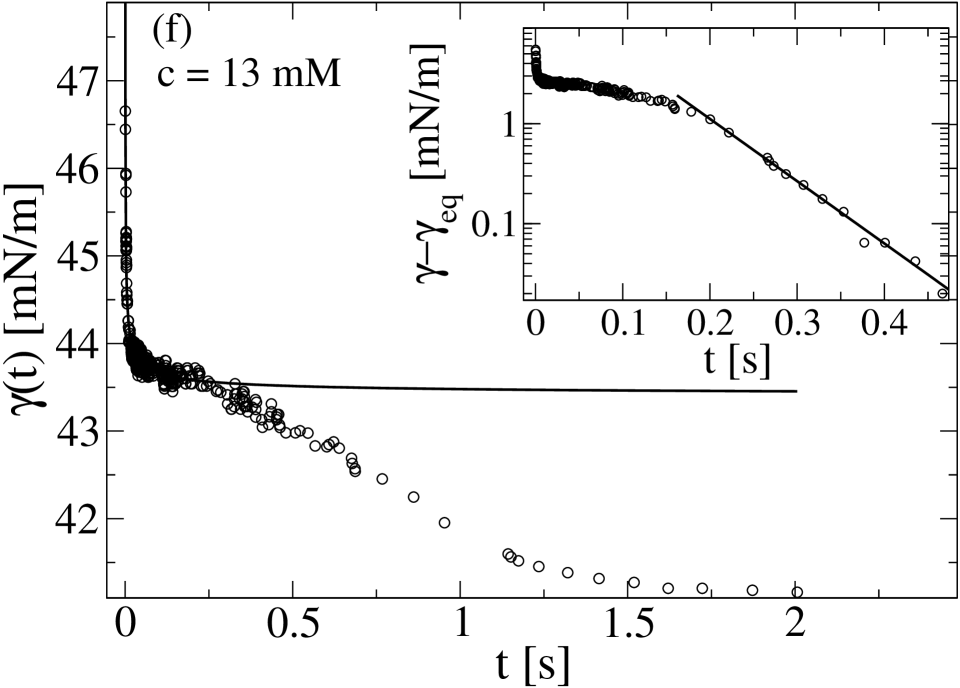
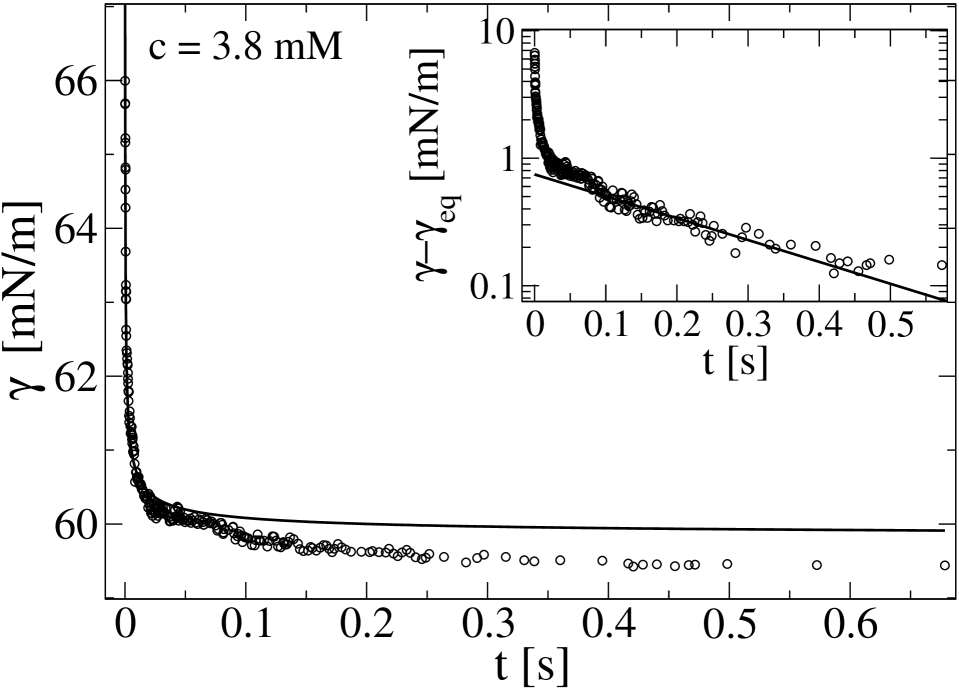
2 shows dynamic surface tension curves for DTAB concentrations below the cmc. At the higher concentrations (panels d–f) the curves manifest an intermediate plateau indicating a double-relaxation process. The behavior observed for high DTAB concentrations at the air-water interface is qualitatively similar to that found for SDS at oil-water interfaces at lower SDS concentrations (the cmc is smaller for SDS)17. In the latter case, however, the characteristic times were longer (because the concentrations were smaller) and accessible by the drop shape method.
The plateaus seen could correspond to the occurrence of a phase transition in the surface layer during which surface pressure remains constant23. In order to check for this possibility, we imaged, using a BAM apparatus, the surface at surfactant concentrations close (below and above) the “knee” ( mM) in 1, but no monolayer heterogeneities were observed (images not included). Note, however, that this does not exclude the presence of domains with sizes below the optical resolution ( m).
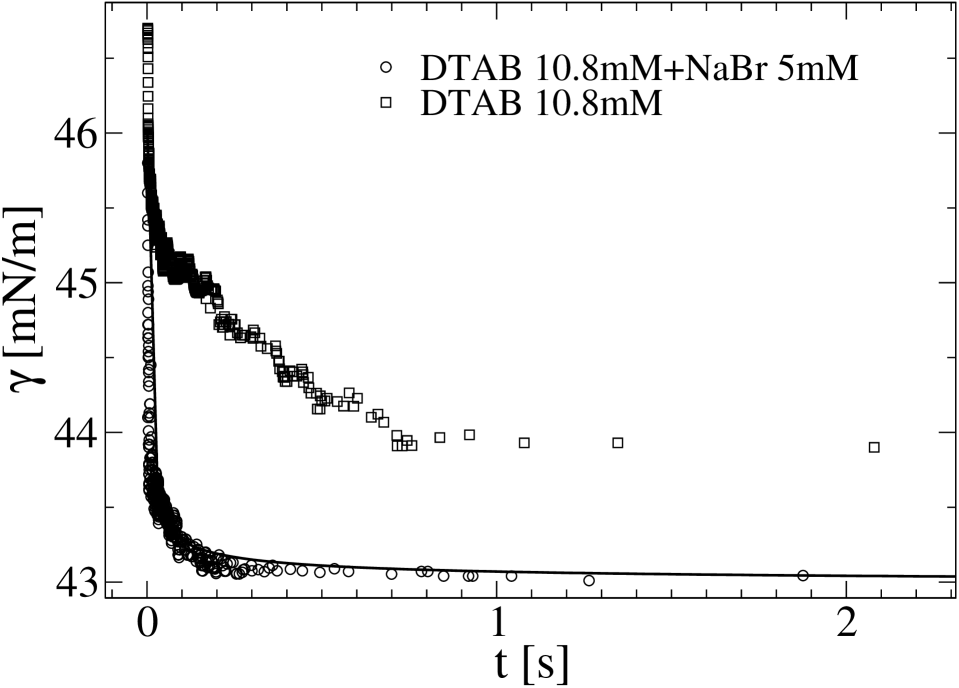
3 shows a comparison of the dynamic surface tension of solutions containing mM DTAB without salt (same as 2f) and in the presence of 5 mM NaBr. Placing the two curves on the same figure shows that the small amount of added salt has almost suppressed the plateau. In fact, the line in that figure represents a fitting to a DLA process using eq \plainrefdiff. From this fitting and eq \plainrefa4D we obtain a diffusion coefficient cm2/s, which is rather close to the previously measured one, 22 cm2/s. The difference between these two values of is compatible with uncertainties in the apparatus constant, .
In 4 we show the dynamic surface tension for mM obtained with the commercial MBP apparatus (MPT2). The results are in qualitative agreement with our in-house apparatus. Note that the plateau can equally be observed, but the characteristic times are much shorter (as compared with 2). For this commercial MBP the apparatus constant seems to be lower than 1 (probably due to some uncontrolled convection). Therefore, we did not analyze quantitatively these results.
4 Data Analysis
4.1 Equilibrium Data
The equilibrium adsorption isotherm and equation of state for ionic surfactant solutions were previously derived15, 16. They are given by
| (1) |
In eq \plainrefgamma_eq, is the bulk surfactant volume fraction ( being the average size of a surfactant molecule), is the surfactant area fraction (surface coverage) at equilibrium, and the thermal energy. The parameters and are the Langmuir adsorption parameter and the Frumkin lateral interaction parameter, respectively (both given in units of ). Finally, the parameter , where the Bjerrum length, Å, characterizes the strength of electrostatic interactions, and is the water dielectric constant.
We numerically solve the isotherm of eq \plainrefgamma_eq for and substitute the result in the equation of state to calculate . 1 shows the fit of , thus obtained, to the equilibrium data (up to the cmc). There are three parameters in the fit: , and . The theoretical curve shown in 1 corresponds to a fitting with , , and Å. In 1 we also demonstrate the sensitivity of the fit to the value of the Frumkin lateral interaction parameter, . The key point is that a relatively large value of is required to reproduce the “knee” in at intermediate concentrations. The need for such a strong surfactant–surfactant attraction at the interface for ionic surfactants was recognized before15, where it was suggested that it may be related to the adsorption of a small amount of counterions, which reduces the electrostatic repulsion, permitting the interaction of the non-polar parts of the surfactant chains.
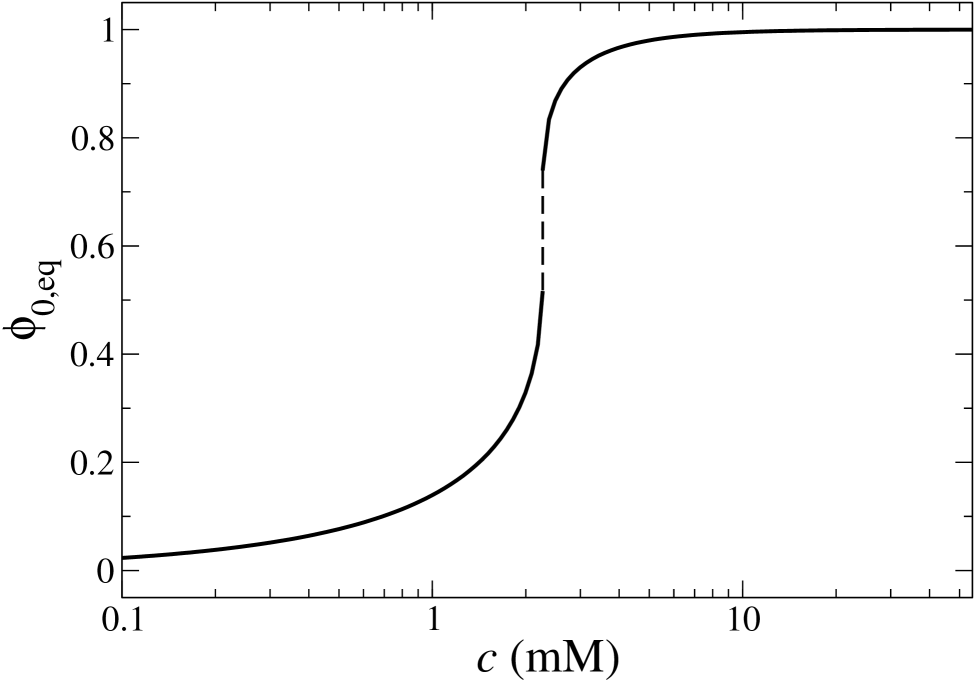
When the fit of the model with the equilibrium data predicts a surface phase transition above a certain critical surface coverage. Since the surfactant molecules are soluble in the bulk solution, the surfactants at the surface can be treated as in a grand-canonical ensemble, and at equilibrium there cannot be a coexistence region between dilute and dense domains. At a certain value of the chemical potential (or equivalently of ) should jump discontinuously without a change in . Kinetically, however, this increase in the coverage should proceed via nucleation and growth of domains of the denser phase. For the above-mentioned values of parameters , and , the transition is between (dilute) and (dense) and occurs at concentration mM, which is consistent with the “knee” observed in the equilibrium surface tension (1). This is also close to the concentration at which the dynamic surface tension curves deviate more clearly from DLA behavior. 5 shows the theoretical equilibrium coverage as a function of concentration, as calculated by numerically solving eq \plainrefgamma_eq for the same parameter values used in the fit of 1. The range of surface coverage and bulk concentrations corresponding to the transition is rather small, and, furthermore, sensitive to the fitted value of . (See dashed lines in 1.) This can possibly explain why a transition has not been detected in the BAM experiments.
4.2 Kinetics at short times
At short times (s) but yet larger than , and for low surfactant concentrations, as is demonstrated in 2, the dynamic surface tension curves fit quite well the asymptotic time dependence of a DLA process15, 16.
| (2) |
The fitted values for and are given in 1.
| (mM) | (ms) | (mN/m) | cm2 s-1 |
|---|---|---|---|
| (MPT2) |
According to the theory16 , which characterizes the relaxation of in a DLA process, is given by
| (3) |
where is the bulk diffusion coefficient of the surfactant molecule. From the known value of the surfactant concentration, its molar weight and density , we can estimate the volume fraction, . At sufficiently high concentration, after the diffusion step, the surface tension reaches values corresponding to an almost saturated monolayer (constant slope region of the experimental as a function of in 1). Therefore, for mM we will assume that . This leads to
| (4) |
The value of the molecular size, Å was obtained in the previous section from the fit to the equilibrium isotherm and is about equal to the value estimated from the molecular volume, , where Å. The calculated values are listed in 1 for values between 2 and 4 mM. These values are a bit lower than the known value for DTAB diffusivity in solution22, cm2/s. This may indicate that the diffusion into the sub-surface region is slightly slower than the diffusion in the bulk. All the curves in 2 clearly show that the adsorption kinetics is not controlled by diffusion at times larger than s as will be discussed in the following section.
4.3 Kinetics at longer times
As is evident from 2, the dynamic surface tension curves at longer times deviate substantially from the DLA behavior and cannot be well fitted with an inverse-square-root temporal decay. This becomes more pronounced as the concentration increases. In the insets of 2 we re-plot the data on a semi-logarithmic scale, demonstrating that the final relaxation to equilibrium is exponential,
| (5) |
This relaxation is consistent with a kinetically limited adsorption (KLA), where the process is hindered by adsorption barriers. 2 lists the fitted values of the relaxation time . These values are 2–3 orders of magnitude larger than the diffusion times listed in 1.
| (mM) | (s) |
|---|---|
| (6) |
where has been defined in eq \plainreftaud, and is the average of the equilibrium electrostatic potentials at the surface and sub-surface layers. From eqs \plainreftaud and \plainreftauk with we get . Using the fitted values of (2), cm2/s, and the fitted equilibrium values , and Å, we obtain for the four higher bulk concentrations, respectively, four rather similar values for the average surface potential: , and .
On the other hand, the Poisson-Boltzmann theory15 yields
| (7) |
where has been defined below eq \plainrefgamma_eq. Taking and Å, we get for the four higher bulk concentrations, respectively,9, 10 , and . Since the potential at the subsurface layer must be smaller than the surface one, , we should expect to find . The values found for , based on the equilibrium Poisson-Boltzmann (PB) theory, are comparable, but smaller than the aforementioned potential barriers inferred from the dynamic surface tension measurements. This may reflect some inadequacies of the PB theory to account for all the experimental results as reported here.
5 Conclusions
In the present work we have analyzed the equilibrium and dynamic surface tension of DTAB at the water-air interface for several concentrations, all below the critical micellar concentration (cmc).
At short times DTAB adsorbs in a diffusion-limited process (DLA) with a temporal relaxation and a diffusion coefficient cm2/s. At longer times, the DLA behavior is followed by a kinetically limited adsorption (KLA) with an exponential relaxation, as predicted by the theory of Ref 15 for salt-free surfactant solutions. For the higher concentrations, the dynamic surface tension exhibits an intermediate plateau, followed by a final, exponential relaxation occurring over time scales of several seconds. This behavior is similar to the one reported earlier for the adsorption of SDS at a water-oil interface in the absence of salt17.
The experiments indicate that the adsorption of DTAB at the water-air interface undergoes a qualitative change in behavior in the concentration range, mM. We could not detect the predicted phase transition using Brewster angle microscopy (BAM), but this could arise either because the surface domains are smaller than the optical resolution or because the transition occurs at concentrations other than those investigated (the predicted concentration range is very narrow, see 4).
The kinetically limited relaxation is related to an electrostatic barrier created by the charged surface. The relevance of electrostatics is supported by the observed strong effect of added salt on the adsorption kinetics. Our analysis indicates, however, that the Poisson-Boltzmann theory does not fully account for the observed potential barriers. The discrepancy might originate from effects related to the finite size of ions concentrated close to the surface 24. We note that such effects were included in previous studies 25, 26, where equilibrium measurements were well fitted by a van der Waals isotherm with a Stern layer of bound counterions 27. Similar modifications of the current theory may also affect predictions concerning the occurrence of a surface phase transition during the adsorption process.
Another mechanism that might be invoked in principle involves the possible formation of pre-micellar aggregates at concentrations closer to (but below) the bulk solution cmc. In a previous theoretical study28, it has been shown that the adsorption kinetics in the presence of micelles exhibits an exponential relaxation, with a relaxation time that is related to the exchange of surfactants between aggregates and the surface. However, the exchange time for small chain surfactants is of the order of a microsecond29, 30, and is too fast to be seen in our experiments. Furthermore, one expects added salt to promote aggregate stability and, thus, to push the system toward KLA, in disagreement with our measurements.
In conclusion, the current work brings further insight into possible mechanisms of ionic surfactant adsorption at fluid interfaces. Further theoretical and experimental work is necessary to fully understand this important phenomenon that controls the dynamic behavior of the interfaces.
Acknowledgement: Support from Centre National de Recherche Spatiale (CNES) and European Space Agency (ESA) under MAP projects AO-99-075 and 108, the Israel Science Foundation (ISF) under grant no. 231/08 and the US–Israel Binational Science Foundation (BSF) under grant no. 2006/055 is gratefully acknowledged. The experiments with the in-house made MBP instrument has been performed in the Facultad de Ingenieria of Buenos Aires and we thank Prof. D. Kurlat for his support. The experiments with the commercial MBP instrument has been performed in the Universidad Complutense and we thank Prof. R. Rubio and Prof. F. Ortega for their support as well. HR thanks the MICIN for a RyC contract and DA thanks the Triangle de la Physique, France (POMICO project No. 2008-027T) for a travel grant.
References
- 1 Duckhin, S. S.; Kretzschmar, G.; Miller, R. Dynamics of Adsorption at Liquid Interfaces, Studies in Interface Science Series, Ed. Moebius, D.; Miller, R. (Elsevier, 1995).
- 2 Bleys, G.; Joos, P. J. Phys. Chem. 1985, 89,1027.
- 3 Van Hunsel, J.; Joos, P. Colloid Polym. Sci. 1989, 267, 1026.
- 4 Hua, X. Y.; Rosen, M. J. J. Colloid Interface Sci. 1988, 124, 652.
- 5 Rosen, M. J.; Hua, X. Y. J. Colloid Interface Sci. 1990, 139, 397.
- 6 Ward, A. F. H.; Tordai, L. J. Chem. Phys. 1946, 14, 453.
- 7 Hua, X. Y.; Rosen, M. J. J. Colloid Interface Sci. 1991, 141, 180.
- 8 Mysels, K. J.; Stafford, R. E. Colloids and Surfaces 1990, 51, 105.
- 9 Serrien, G.; Geeraerts, G.; Ghosh, L.; Joos, P. Colloids and Surfaces 1992, 68, 219.
- 10 Lucassen, J.; Drew, M. G. B. J. Chem. Soc. - Faraday Trans. I 1987, 83, 3093.
- 11 Aniansson, E. A. G.; Wall, S. N.; Almgren, M.; Hoffmann, H.; Kielmann, I.; Ulbricht, W.; Zana, R.; Lang, J.; Tondre, C. J. Phys. Chem. 1976, 80, 905.
- 12 Serrien, G.; Joos, P. J. Colloid Interface Sci. 1990 139, 149.
- 13 Bonfillon, A.; Langevin, D. Langmuir 1993, 9, 2172.
- 14 Bonfillon, A.; Langevin, D. Langmuir 1994, 10, 2965.
- 15 Diamant, H.; Andelman, D. J. Phys. Chem. 1996, 100, 13732.
- 16 Diamant, H.; Ariel, G.; Andelman, D. Colloid Surf. A 2001, 183–185, 259.
- 17 Bonfillon, A.; Sicoli, F.; Langevin, D. J. Colloid Interface Sci. 1994, 168, 497.
- 18 Fainerman, V.B.; Miller, R.Adv. Colloid Interface Sci. 2004, 108-109, 287.
- 19 Asnacios, A.; Langevin, D.; Argillier, J. F. Macromolecules 1996, 29, 7412.
- 20 Ritacco, H.; Kurlat D.; Langevin, D. J. Phys. Chem. B 2003, 107, 9146.
- 21 Christov, N. C.; Danov, K. D.; Kralchevsky, P. A.; Ananthapadmanabhan, K. P.; Lips, A. Langmuir 2006, 22, 7528.
- 22 Lindman, B.; Puyal, M. C.; Kamenka, N.; Rymden, R.; Stilbs, P. J. Phys. Chem. 1984, 88, 5048. We used the diffusion constant as measured for SDS in our present study of DTAB surfactant because for small polar heads the diffusion constant mainly depends on the chain length and should be similar for the two surfactants.
- 23 Melzer V.; Vollhardt, D. Phys. Rev. Lett. 1996, 76, 3770.
- 24 Borukhov, I.; Andelman, D.; Orland, H. Phys. Rev. Lett. 1997, 79, 435.
- 25 Battal, T.; Shearman, G. C.; Valkovska, D.; Bain, C. D. Langmuir 2003, 19, 1244.
- 26 Valkovska, D. S.; Shearman, G. C.; Bain, C. D.; Darton, R. C.; Eastoe J. Langmuir 2004, 20, 4436.
- 27 Kralchevsky, P. A.; Danov, K. D.; Broze, G.; Mehreteab, A. Langmuir 1999, 15, 2351.
- 28 Mohrbach, H. J. Chem. Phys. 2005, 123, 126101.
- 29 Lang, J.; Zana, R. in “Surfactant Solutions”, ed. Zana, R., Surfactant Sciences Series, 1987, 22, p. 433. We used the exchange time previously meassured for SDS in the present study of DTAB because this exchange time (just like the diffusion constant) merely depends on the chain length.
- 30 Dynamics of Surfactant Self-Assemblies; Zana, R., Ed.; CRC Press: Boca Raton, FL, 2005.