R CrA SMM 1A: Fragmentation in A Prestellar Core
Abstract
We report the discovery of multiple condensations in the prestellar core candidate SMM 1A in the R CrA cloud, which may represent the earliest phase of core fragmentation observed thus far. The separation between the condensations is between 1000 and 2100 AU, and their masses range from about 0.1 to 0.2 . We find that the three condensations have extremely low bolometric luminosities ( ) and temperatures ( K), indicating that these are young sources that have yet to form protostars. We suggest that these sources were formed through the fragmentation of an elongated prestellar core. Our results, in concert with other observed protostellar binary systems with separations in the scale of 1000 AU, support the scenario that prompt fragmentation in the isothermal collapse phase is an efficient mechanism for wide binary star formation, while the fragmentation in the subsequent adiabatic phase may be an additional mechanism for close ( 100 AU) binary star formation.
1 INTRODUCTION
The origin of binary stars is still a puzzle in our understanding of star formation. Numerous theoretical simulations support the hypothesis that the fragmentation of collapsing molecular cloud cores, promoted by either rotation or turbulence, is the main mechanism for the formation of binary/multiple stellar systems (see reviews by Bodenheimer et al. 2000, Tohline 2002, and Goodwin et al. 2007). Nevertheless, many key questions concerning this fragmentation process, e.g., when exactly does the fragmentation start, are still under debate (see Tohline 2002). Although it is generally assumed that cloud cores do not fragment during the free-fall collapse phase, several groups (e.g., Bate & Burkert 1997; Tsuribe & Inutsuka 1999; Boss et al. 2000) found that fragmentation can occur at the end of the isothermal phase (generally referred to as prompt fragmentation), while others (e.g., Truelove et al. 1997, 1998; Machida et al. 2005, 2008) argue that the isothermal gas is stable against fragmentation and found that fragmentation only occurs during/after the adiabatic phase (see Figure 9 in André et al. 2009 for a discussion of the different evolutionary phases of core collapse).
On the observational side, a handful of young protostellar (i.e., Class 0) binary systems have been found (e.g., Looney et al. 2000; Launhardt 2004), and there are increasing kinematics studies of binarity in the protostellar phase (e.g., Chen et al. 2007, 2008, 2009; Volgenau et al. 2006; Maury et al. 2010). However, the number of observed and well-studied protostellar binary (protobinary) systems is still small, and these systems have already gone through the fragmentation process. The observational link between the initial conditions in a fragmenting cloud core and the final stellar systems formed therein is still missing. It is therefore critical to observe, at high angular resolution, more dense cores in nearby molecular clouds to search for the earliest phase of fragmentation and study in detail their properties, in order to put direct constraints on fragmentation models.
In this Letter, we present Submillimeter Array111The Submillimeter Array is a joint project between the Smithsonian Astrophysical Observatory and the Academia Sinica Institute of Astronomy and Astrophysics and is funded by the Smithsonian Institution and the Academia Sinica. (SMA; Ho et al. 2004) dust continuum observations toward the R Corona Australis (R CrA) region. At a distance of 170 pc (Knude & Høg 1998), the CrA dark cloud is one of the nearest star-forming regions. As the most active star formation site in this cloud, the R CrA region has been extensively observed in the past two decades (see review by Neuhuser & Forbrich 2008, and references therein). Using SCUBA on the James Clerk Maxwell Telescope (JCMT), Nutter et al. (2005) found a prestellar core candidate termed SMM 1A in the R CrA region, which is elongated in the east-west direction and has a gas mass of 10 , and an effective radius of 3000 AU. With a maximum velocity dispersion of about 0.8 km s-1 (Harju et al. 1993), the SMM 1A core is gravitationally bound. Infall motions in this region of the cloud further confirm that this is a prestellar core (Groppi et al. 2004). In this Letter, we report the discovery of a multiple system within the SMM 1A core, based on high angular resolution millimeter observations. This may represent the earliest phase of core fragmentation observed thus far.
2 OBSERVATIONS AND DATA REDUCTION
The R CrA region was observed with the SMA on 2006 August 20 in the compact configuration. Six antennas were used in the array, providing baselines from 5 k to 52 k at 220 GHz. The SMA primary beam is about 55′′ at this frequency. Two positions next to each other at (R.A., decl.)J2000 =( 19:01:53.3, 36:57:21.0) and (R.A., decl.)J2000 =( 19:01:56.4, 36:57:27.0) were observed. The digital correlator was set up to cover the frequency ranging 216.6218.8 GHz and 226.6228.8 GHz in the lower and upper sidebands, respectively. The 1.3 mm dust continuum emission was recorded with a total bandwidth of 3.3 GHz ( 1.8 GHz USB and 1.5 GHz LSB). System temperatures for R CrA ranged from 100 to 280 K (depending on elevation), with a typical value of 200 K.
The visibility data were calibrated with the MIR package (Qi 2005), with quasars 3c454.3 and 1924-292 as the bandpass and gain calibrators, respectively. Uranus was used for absolute flux calibration, from which we estimate a flux accuracy of 20%, by comparing the measured quasar fluxes with those listed in the SMA calibration database. The calibrated visibility data were imaged using the Miriad toolbox (Sault et al. 1995). The SMA synthesized beam size at 1.3 mm dust continuum, with robust uv weighting 0, is 5.7′′ 2.3′′.
3 RESULTS
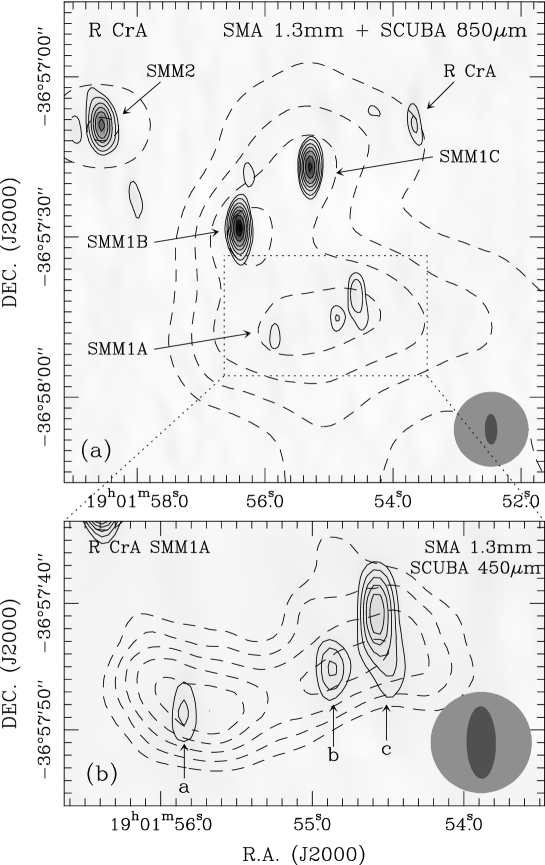
Figure 1a shows the SMA 1.3 mm dust continuum image of R CrA, overlaid with the SCUBA 850 m dust continuum contours (from Groppi et al. 2007). The northern part of this image shows clear detection of the dust continuum emission associated with the Herbig-Ae star R CrA and protostellar cores SMM 2, SMM 1B and SMM 1C — these last two are also referred to as SMA1 and SMA2 in Groppi et al. (2007; see also Choi et al. 2008). To the south, the SCUBA 850 m image shows the SMM 1A core, which is elongated in the east-west direction (see Fig. 1a). At higher angular resolution, the SCUBA 450 m image in Figure 1b shows that the SMM 1A core is clearly resolved into two sub-cores (see also van den Ancker 1999). At even higher resolution, the SMA 1.3 mm continuum observations reveal that the SMM 1A core is divided into three condensations, aligning roughly from east to west, which we refer to here as SMM 1A-a, SMM 1A-b, and SMM 1A-c (Fig. 1b). All are detected with signal-to-noise ratio of 4 or more. Source SMM 1A-a coincides with the eastern sub-core observed in the SCUBA 450 m image, while SMM 1A-b and SMM 1A-c are coincident with the western sub-core (Fig. 1b). The single-dish and interferometer observations are in general agreement with each other, which indicates that the three continuum sources detected with the SMA are neither artifacts nor are due to noise in the interferometer image222The three sources in SMM 1A were not detected in the SMA 1.1 mm observations in Groppi et al. (2007), probably due to the reasons: (1) the three sources lie near the edge of their primary beam ( 46′′ at 270 GHz); (2) more flux was resolved out in their extended configuration observations; and (3) the 1.1 mm observations lack the sensitivity to detect these weak sources.. Also note that the SiO (5–4) line and several other molecular lines, e.g., DCN (3–2), were included in this SMA correlator setup, but no line emission was detected from the three condensations.
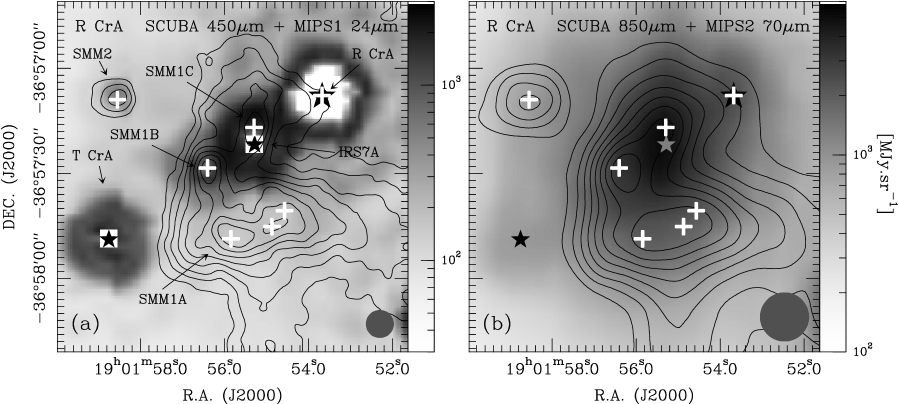
Figure 2 shows the mid-infrared images of the R CrA region, taken by the Spitzer Space Telescope. The MIPS 1 band image at 24 m (Fig. 2a) clearly shows infrared emission at the position of cores SMM 1B (associated with the infrared source IRS 7B, see Wilking et al. 1997), SMM 2, and the Herbig stars R CrA and T CrA. There is also 24 m emission from the SMM 1C core, which may be associated with the radio source B9 centered on the core (see Choi et al. 2008), and the infrared source IRS 7A located 5′′ to the south. The MIPS 2 band image at 70 m (Fig. 2b) has a lower angular resolution and is dominated by the emission from the SMM 1C/IRS 7A region. The MIPS 3 (160 m) image of R CrA is extremely saturated, and is thus not shown here. None of the images at bands from 3.6 to 70 m shows compact infrared emission in the SMM 1A core, which suggests that the core is extremely cold.
From the SMA 1.3 mm images, we derived the positions, fluxes, and (deconvolved) FWHM sizes of the three sources in R CrA SMM 1A using a multi-component Gaussian fitting routine (see Table 1). Angular separations between sources SMM 1A-a and -b and SMM 1A-b and -c are 122 03 and 58 03, corresponding to projected separations of 2100 AU and 1000 AU (at a distance of 170 pc), respectively. Assuming that the 1.3 mm dust continuum emission is optically thin, the total gas mass () of the three sources is calculated with the same method as described in Launhardt & Henning (1997). In the calculations, we adopt a dust opacity of (Ossenkopf & Henning 1994), a typical value for dense and cold molecular cloud cores, and a mass-averaged dust temperature of 18 K (see below). The gas masses of the three sources, derived from the SMA 1.3 mm dust continuum observations, range from 0.10 to 0.23 (see Table 1). With these mass and the FWHM size of the condensations, we estimate their average densities to be in the order of to cm-3. Note that these are average densities and the local peak densities in these sources may be orders of magnitude higher. These high densities, as well as the infall motions detected in this region (see Groppi et al. 2004), suggest that the three condensations in the SMM 1A are on their way to form low-mass stars. Considering that the SMM 1A core has a mass of approximately 10 , and assuming a core-to-star efficiency of % (Evans et al. 2009), it is probable that a multiple stellar system with a total mass of 3 will eventually form in SMM 1A.
4 DISCUSSION
4.1 The Earliest Phase of Binary/Multiple Star Formation
Table 1 lists the 450 m and 850 m fluxes estimated from the SCUBA images, and the 800 m fluxes adopted from van den Ancker (1999). Since sources SMM 1A-b and SMM 1A-c are not resolved in the JCMT observations, we treat them as one sub-core here. The SCUBA 450 m fluxes are derived by fitting two-dimensional Gaussians toward the two sub-cores (SMM 1A-a and SMM 1A-b+c), while the 850 m fluxes are estimated from the fluxes enclosed within roughly one beam around each sub-core. Based on the SMA 1.3 mm and JCMT submm data points, as well as the 3 upper limits in the MIPS images, we construct the spectral energy distributions (SEDs) of the two sub-cores (see Figure 3). In order to derive luminosities and temperatures, we first interpolate and then integrate the SEDs, always assuming spherical symmetry. Interpolation between the flux densities is done by a 2 single-temperature grey-body fitting to all points (including the upper limits). The resulting bolometric luminosities are 0.08 for SMM 1A-a and 0.09 for SMM 1A-b+c. The dust and bolometric temperatures are between 17 and 19 K for the sources.
The low luminosities and temperatures, as well as the fact that no compact infrared emission is detected from these sources in the images, resemble the typical properties of prestellar cores (see review by André et al. 2009). In the VLA survey of the R CrA region, no radio source is detected at the positions of the three condensations presented here (Choi et al. 2008). In contrast, the protostars SMM 1B (Class 0/I) and SMM 1C (Class 0) to the north of SMM 1A are bright and centrally peaked at millimeter wavelengths (Fig. 1a), and are associated with hard X-ray (Forbrich & Preibisch 2007), infrared (Fig. 2a), and centimeter radio counterparts (Choi et al. 2008). Therefore, although the chemical and kinematic properties of SMM 1A are still poorly known, the observations thus far suggest that the three sources in SMM 1A are in an earlier evolutionary stage than that of Class 0 protostars. As predicted by theoretical studies, there are different phases in the evolution from an initial isothermal (10 K) prestellar core to a Class 0 protostar (André et al. 2009). The low luminosities ( 0.1 ) and temperatures (close to 20 K) of the three sources in SMM 1A are similar to the predicted properties of so-called first hydrostatic (adiabatic) cores, which are formed after the isothermal collapse of prestellar cores (e.g., Masunaga et al. 1998; Chen et al. 2010). However, it must be noted that large uncertainties remain in our estimates due to the limited observations available. Further high angular resolution observations at different wavelengths are needed to constrain the SEDs of the three sources in order to address more precisely their evolutionary statuses. Regardless of this, it is fair to say that the R CrA SMM 1A multiple system represents the earliest phase of core fragmentation observed thus far.
4.2 Prompt (Isothermal) Fragmentation vs. Adiabatic Fragmentation
Prompt fragmentation of rotationally flattened cloud cores with initially flat density profiles, immediately after a phase of free-fall collapse, has long been suggested as one of the most efficient mechanisms for binary star formation (Tohline 2002). Since this fragmentation is expected to occur at the end of the isothermal collapse phase, it is also referred to as isothermal fragmentation. The separation of the fragments formed via prompt fragmentation has a scale of 102104 AU, which corresponds to the Jeans length in this phase. In contrast, other groups found that isothermal gas is stable against fragmentation and that core fragmentation can only occur during (and after) the adiabatic phase (e.g., Truelove et al. 1998; Machida et al. 2008). Because this fragmentation occurs after the formation of the first adiabatic core, it is also called the first core fragmentation (Machida et al. 2005). Here, the separation of the fragments formed generally has a scale of 3300 AU (Machida et al. 2008). Clearly, observing the earliest phase of core fragmentation is the most effective way to discriminate between prompt (isothermal) and adiabatic fragmentation scenarios. If prompt fragmentation does occur in the isothermal phase, we may expect to find a binary/multiple system consisting of adiabatic cores with the separation of 1000 AU.
As shown in the SCUBA images (see Figure 1b), the R CrA SMM 1A core is highly elongated with an aspect ration of roughly 3, showing a morphology similar to the bars or filaments seen in the simulations of prompt (isothermal) fragmentation (see, e.g., Bate & Burkert 1997; Tsuribe & Inutsuka 1999; Boss et al. 2000). From the mass and radius of the SMM 1A core (see Nutter et al. 2005), the average volume density is calculated to be 12 107 cm-3. The corresponding Jeans length is 1000 AU for a temperature of 10 K. The separations among the three sources found in the SMM 1A core are also consistent with this estimated Jeans length. Moreover, our results from the SED fitting (see above) suggest that the three sources are at an evolutionary stage earlier than that of Class 0 protostars, perhaps in the first (adiabatic) core stage. All these results appear to support the view that the three sources are formed through the prompt fragmentation of an elongated collapsing core during the isothermal phase. In this scenario, we would expect the rotational axis of SMM 1A to be perpendicular to the direction of the core’s major axis, which would be roughly perpendicular to the large scale rotation observed in the R CrA region by Groppi et al. (2004). This is not necessarily inconsistent with our picture as other cores show drastic differences in the rotation axes measured at different scales (e.g., Ohashi et al. 1997). We also note that so far most observed protostellar binary/multiple systems (e.g., L 723, Launhardt 2004; or NGC 2264 D-MM1, Teixeira et al. 2007) have separations in the scale of 1000 AU, which also supports the scenario of prompt fragmentation, although these protostellar systems have had at least a few 104 yrs to evolve from their prestellar stage and thus their separations may not represent real initial conditions.
On the other hand, as introduced above, prompt (isothermal) fragmentation has trouble accounting for the close binary systems with separations 100 AU. The fragmentation of cores at the adiabatic phase is still an attractive mechanism for close binary star formation. Considering that the binary separation distribution in (pre-) main sequence stars peaks at 30 AU, we actually would expect to find frequently close protobinary systems with separations of 100 AU to support the adiabatic fragmentation scenario. In practice, however, the number of this kind of systems is very small. This observational result can be understood by the fact that current large millimeter interferometers (e.g., SMA and IRAM-PdBI) normally reach 1–2′′ angular resolution under general conditions, and thus mostly resolve wide protobinary systems with separations of 200 AU or more in nearby star-forming clouds. We believe that routine observations at angular resolution better than 0.5′′ will reveal more close protobinary systems, which will then allow us to study in detail a statistically significant number of protostellar binary/multipe systems with a wide range of separations (from 10 AU to 104 AU).
5 SUMMARY
We present SMA 1.3 mm dust continuum observations toward the R CrA region. The 1.3 mm dust continuum emission is detected from dense cores SMM 1B, SMM 1C, and SMM 2, and the Herbig-Ae star R CrA in this region. We discover within the prestellar core candidate SMM 1A a multiple system made up of three condensations with masses in the range of 0.1 to 0.2 . The angular separations between the three new sources are 12.2′′ and 5.8′′, corresponding to the projected separations of 2100 AU and 1000 AU, respectively. Based on SMA observations and complementary data from the JCMT and telescopes, we construct their spectral energy distributions (SEDs) and find that all three sources have extremely low bolometric luminosities ( 0.1 ) and temperatures ( 20 K). We suggest that the three condensations in SMM 1A resulted from the fragmentation of an elongated core in the isothermal phase. The R CrA SMM 1A system appear to be the earliest phase of low-mass core fragmentation observed thus far.
References
- Andre et al. (2009) André, P., Basu, S., & Inutsuka, S.-I. 2009, in Structure Formation in Astrophysics, ed. G. Chabrier (Cambridge: Cambridge University Press), 254
- Bate & Burkert (1997) Bate, M. R., & Burkert, A. 1997, MNRAS, 288, 1060
- Bodenheimer et al. (2000) Bodenheimer, P., Burkert, A., Klein, R. I., & Boss, A. P. 2000, in Protostars and Planets IV, ed. V. Mannings, A. P. Boss, & S. R. Russell (Tucson: Univ. Arizona Press), 675
- Boss et al. (2000) Boss, A. P., Fisher, R. T., Klein, R. I., & McKee, C. F. 2000, ApJ, 528, 325
- Chen et al. (2010) Chen, X., Arce, H. G., & Zhang, Q., et al. 2010, ApJ, 715, 1344
- Chen et al. (2008) Chen, X., Launhardt, R., & Bourke, T. L., Henning, Th., & Barnes, P. J. 2008, ApJ, 683, 862
- Chen et al. (2007) Chen, X., Launhardt, R., & Henning, Th. 2007, ApJ, 669, 1058
- Chen et al. (2009) Chen, X., Launhardt, R., & Henning, Th. 2009, ApJ, 691, 1729
- Choi et al. (2008) Choi, M., Hamaguchi, K., Lee, J.-E., & Tatematsu, K. 2008, ApJ, 687, 406
- Evans et al. (2009) Evans II, N. J., Dunham, M. M., Jørgensen, J. K. et al. 2009, ApJS, 181, 321
- Forbrich & Preibisch (2007) Forbrich, J., & Preibisch, T., 2007, A&A, 475, 959
- Goodwin et al. (2007) Goodwin, S., Kroupa, P., Goodman, A., & Burkert A. 2007, in Protostars and Planets V, ed. B. Reipurth, D. Jewitt, & K. Keil (Tucson: Univ. Arizona Press), 133
- Groppi et al. (2007) Groppi, C. E., Hunter, T. R., Blundell, R., & Sandell, G. 2007, ApJ, 670, 489
- Groppi et al. (2004) Groppi, C. E., Kulesa, C., Walker, C., & Martin, C. L. 2004, ApJ, 612, 946
- Harju et al. (1993) Harju, J. ,et al. 1993, A&A, 278, 569
- Ho et al. (2004) Ho, P. T. P., Moran, J. M., & Lo, K. Y. 2004, ApJ, 616, L1
- Knude & Hog (1998) Knude, J., & Høg, E. 1998, A&A, 338, 897
- Launhardt (2004) Launhardt, R. 2004, in IAU Symp. 221, Star Formation at High Angular Resolution, ed. M. G. Burton, R. Jayawardhana, & T. L. Bourke (San Francisco: ASP), 213
- Launhardt & Henning (1997) Launhardt, R., & Henning, Th. 1997, A&A, 326, 329
- Looney et al. (2000) Looney, L. W., Mundy, L. G., & Welch, W. J. 2000, ApJ, 529, 477
- Machida et al. (2005) Machida, M. N., Matsumoto, T., Hanawa, T., & Tomisaka, K. 2005, MNRAS, 362, 382
- Machida et al. (2008) Machida, M. N., Tomisaka, K., Matsumoto, T., & Inutsuka, S.-I. 2008, ApJ, 677, 327
- Masunaga et al. (1998) Masunaga, H., Miyama, S. M., & Inutsuka, S.-I. 1998, ApJ, 495, 346
- Maury et al. (2010) Maury, A. J., André, Ph., & Hennebelle, P., et al. 2010, A&A, 512, 40
- Neuhauser & Forbrich (2008) Neuhuser, R., & Forbrich, J. 2008, in Handbook of Star Forming Regions, Volume II: The Southern Sky, ASP Monograph Publications, Vol. 5. ed, Reipurth, B., 735
- Nutter et al. (2005) Nutter, D. J., Ward-Thompson, D., & André, P. 2005, MNRAS, 357, 975
- Ohashi et al. (1997) Ohashi, N., Hayashi, M., Ho, P. T. P., & Momose, M. 1997, ApJ, 475, 211
- Ossenkopf & Henning (1994) Ossenkopf, V., & Henning, Th. 1994, A&A, 291, 943
- Qi (2005) Qi, C. 2005, MIR Cookbook (Cambridge: Harvard), http://cfa-www.harvard.edu/ cqi/mircook.html
- Sault et al. (1995) Sault, R. J., Teuben, P. J., & Wright, M. C. H. 1995, in ASP Conf. Ser. 77, Astronomical Data Analysis Software and Systems IV, ed. R. A. Shaw, H. E. Payne, & J. J. E. Hayes (San Francisco: ASP), 433
- Teixeira et al. (2007) Teixeira, P. S., Zapata, L. A., & Lada, C. J. 2007, ApJ, 667, L179
- Tohline (2002) Tohline, J. E. 2002, ARA&A, 40, 349
- Truelove et al. (1997) Truelove, J. K., Klein, R. I., & McKee, C. F. et al. 1997, ApJ, 489, L179
- Truelove et al. (1998) Truelove, J. K., Klein, R. I., & McKee, C. F. et al. 1998, ApJ, 495, 821
- Tsuribe & Inutsuka (1999) Tsuribe, T., & Inutsuka, S. 1999, ApJ, 523, L155
- van den Ancker (1999) van den Ancker, M. 1999, Ph.D. thesis, Univ. Amsterdam
- Volgenau et al. (2006) Volgenau, N. H., Mundy, L. G., Looney, L. W., & Welch, W. J. 2006, ApJ, 651, 301
- Wilking et al. (1997) Wilking, B. A., McCaughrean, M. J., & Burton, M. G., et al. 1997, AJ, 114, 2029
| Source | R.A.a | Dec.a | (1.3 mm)a | FWHMa | b | (450 m) | (800 m) | (850 m) |
|---|---|---|---|---|---|---|---|---|
| (J2000) | (J2000) | [mJy] | maj.min. | [] | [Jy] | [Jy] | [Jy] | |
| SMM 1A-a | 19:01:55.86 | 36:57:48.8 | 469 | 5652 | 0.100.02 | 5.02.0 | 1.5 | 1.00.2 |
| SMM 1A-b | 19:01:54.87 | 36:57:45.2 | 6413 | 6863 | 0.130.02 | 4.61.8c | 0.8c | 0.70.2c |
| SMM 1A-c | 19:01:54.56 | 36:57:40.6 | 11020 | 7831 | 0.230.05 | 4.61.8c | 0.8c | 0.70.2c |