Recent Transits of the Super-Earth Exoplanet GJ 1214b
Abstract
We report recent ground-based photometry of the transiting super-Earth exoplanet GJ 1214b at several wavelengths, including the infrared near 1.25 m (J-band). We observed a J-band transit with the FLAMINGOS infrared imager and the 2.1-meter telescope on Kitt Peak, and we observed several optical transits using a 0.5-meter telescope on Kitt Peak and the 0.36-meter Universidad de Monterrey Observatory telescope. Our high-precision J-band observations exploit the brightness of the M-dwarf host star at this infrared wavelength as compared to the optical, as well as being significantly less affected by stellar activity and limb darkening. We fit the J-band transit to obtain an independent determination of the planetary and stellar radii. Our radius for the planet () is in excellent agreement with the discovery value reported by Charbonneau et al. based on optical data. We demonstrate that the planetary radius is insensitive to degeneracies in the fitting process. We use all of our observations to improve the transit ephemeris, finding days, and BJD.
1 Introduction
A current frontier in extrasolar planet research is the detection and atmospheric characterization of super-Earth exoplanets orbiting nearby M-dwarf stars (Charbonneau & Deming, 2007). The recent detection of GJ 1214b (Charbonneau et al., 2009) is a significant step toward this frontier. GJ 1214b was found by the MEarth survey of nearby M-dwarfs (Nutzman & Charbonneau, 2008), and it is the first super-Earth exoplanet discovered by a ground-based photometric method. The radius of GJ 1214b derived from the discovery observations (, see Table 1) indicates that the planet has a low molecular weight composition such as an ocean planet, but alternative compositions remain possible (Miller-Ricci & Fortney, 2010; Rogers & Seager, 2010). Inferences concerning the composition of GJ 1214b depend on a securely measured radius. In this regard it is valuable to measure the transit in the infrared (IR). IR transit observations are less sensitive to stellar activity and limb-darkening, compared with optical wavelengths. Reduced sensitivity to these effects helps establish a more robust planetary radius. GJ 1214 is also the target of several near-term observational programs using both HST and Spitzer, so recent ground-based transit observations can benefit the space-borne programs by improving the precision of the transit ephemeris.
In this Letter we present results from high-precision photometry of a transit of GJ 1214b observed in the J-band (1.25 m), and several less precise transits in the optical. Our IR transit data provide an independent check on the planetary radius derived by Charbonneau et al. (2009) from the optical discovery observations, and the totality of our recent transit data allow us to significantly improve the transit ephemeris.
2 Observations and Photometry
2.1 Observations
We observed transits of GJ1214b using the Universidad de Monterrey Observatory (UDEM) telescope on UT dates April 29, June 6 & 17, 2010. UDEM is a small private college observatory having Minor Planet Center Code 720, and is located at 689 meters altitude in the suburbs of Monterrey, México. The UDEM data were acquired using an -band filter on the 0.36-meter reflector, with a 1280x1024-pixel CCD camera at 1.0 arc-sec per pixel scale. We observed an additional transit on UT May 29, 2010 using two telescopes on Kitt Peak. We used the 2.1-meter reflector with the FLAMINGOS 2048x2048-pixel infrared imager (Elston, 1998), and a J-band (1.25 m) filter, at 0.6 arc-sec per pixel scale. Following the conclusion of nightly public programs, we have access to the 0.5-meter telescope at the Kitt Peak Visitor Center (VCT). Simultaneous with the 2.1-meter J-band observations, we observed the May 29 transit using the VCT and a 3072x2048 CCD camera at 0.45 arcsec per pixel. The VCT observations were planned to use the z-band filter, but due to a filter wheel error these data were actually acquired in a B filter. Observations at all three telescopes used a defocus to improve the photometric precision, and all used off-axis guiding to maintain pointing stability. Exposure times were 30-seconds at the 2.1-meter, 60-seconds at the VCT, and 120-seconds at UDEM. All of the optical CCD exposures were binned 2x2 to facilitate rapid readout.
Flat-field observations were acquired at all three observatories using either twilight sky (UDEM and VCT) or a series of night-sky FLAMINGOS exposures, incorporating pointing offsets to allow removal of stars via a median filter.
2.2 Photometry
Subsequent to dark current subtraction and division by a flat-field frame, we performed aperture photometry on the target star and comparison stars. The 20-arcmin field of FLAMINGOS provided 8 comparison stars of comparable IR brightness to GJ 1214. We used 7-pixel circular aperture radii to measure the stars. We measured the sky background surrounding each star using an annulus with an inner radius of 9-pixels and an outer radius of 44-pixels. Normalizing GJ 1214 to the the comparison stars yielded a transit light curve with an observed scatter that varied from 0.002 to 0.0015 as a function of time, due to the decreasing airmass during the observations. We found that the best results were obtained by averaging the ratios of GJ 1214 to each comparison star. This produced smaller scatter than the method of ratioing GJ 1214 to the sum of all the comparison stars. We estimated an error for each GJ 1214 photometric point as the standard deviation of the ratio to the individual comparison stars, divided by the square root of their number (error of the mean). The scatter in the photometry is approximately 65% greater than these estimates, so we increased our error estimates by this factor to facilitate more accurate analyses (see below).
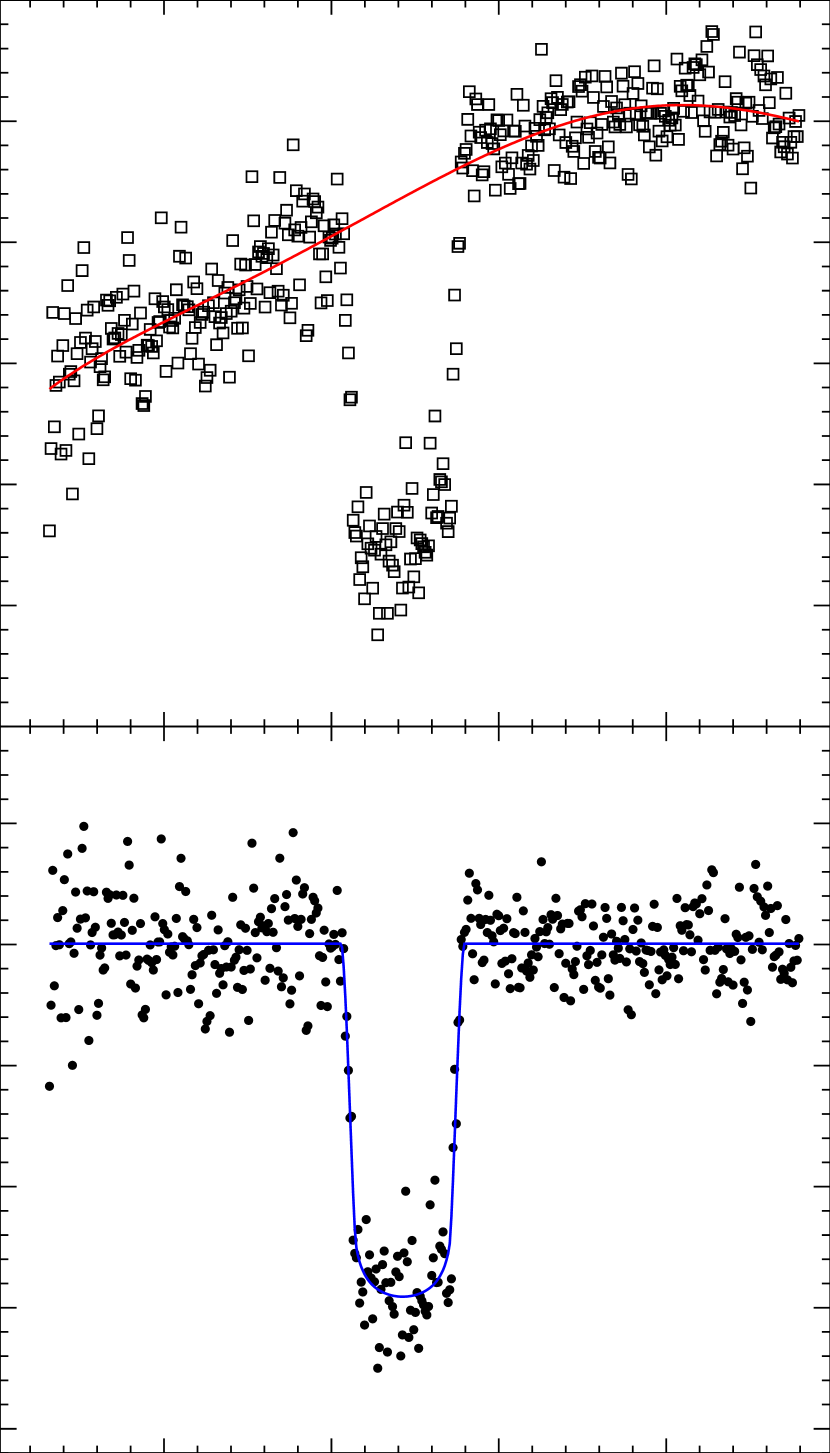
After normalizing to the comparison stars, the GJ 1214 data clearly reveal the transit but with low-order curvature in the out of transit baseline. It is probable that this baseline curvature is caused by differences in the effective wavelengths of the J-bandpass as a function of stellar color, in combination with the wavelength-variation in telluric water vapor absorption. We account for this baseline using a 4th-order polynominal fit, simultaneous with the transit fit (see Sec. 3). Photometry of the UDEM and VCT data used similar procedures as for the FLAMINGOS data, except that the baseline was modeled as a linear function of airmass. Figure 1 shows the 5 transits that we have observed. Figure 2 replots the J-band transit, showing both the raw photometry and baseline-removed photometry, and overplots a theoretical transit curve based on the (Charbonneau et al., 2009) system parameters.
3 Derivation of Stellar and Planetary Radii
Our J-band transit data have greater photometric precision than our optical data (see Figure 1). Moreover, stellar limb darkening and activity signatures are reduced at IR wavelengths compared to the optical. Therefore we use only our J-band data to fit for the exoplanet and stellar radius, but we use all of our transit data to update the transit ephemeris.
Given an estimate of the stellar mass, three unknowns (stellar and planetary radii, and impact parameter) follow from three constraints (transit depth and duration, and ingress/egress time). The solution is only weakly affected by errors in the adopted stellar mass (Brown et al., 2001). Given also that the IR limb darkening is weak, we fix both the stellar mass and limb darkening in our fitting for radii. We adopt the stellar mass (0.157 solar masses) given by Charbonneau et al. (2009), and the model-atmosphere-based square-root limb darkening coefficients for M-dwarf stars derived by Claret (1998).
We calculate transit curves numerically, using a tile-the-star procedure with adaptive-mesh tiles to maximize the precision. The transit curve that results from the Charbonneau et al. (2009) system parameters, and the Claret (1998) limb-darkening, is illustrated in the lower panel of Figure 2. For Figure 2, we overlaid this transit curve on our data by first removing the baseline from the data. We then varied the central transit time to find the best fit, not changing the depth or shape of the curve. It provides an excellent fit, note particularly that it accounts for the sharp ingress/egress portions of the data (Figure 2). This agreement immediately suggests that the Charbonneau et al. (2009) radii are not signficantly affected by limb-darkening errors, or stellar activity. Note also that the transit curve still contains significant curvature, unlike transit curves at far-IR wavelengths (Richardson et al., 2006), where stellar limb darkening is virtually zero. The linear limb darkening coefficient for this M-dwarf star is about a factor of two lower in J-band than in I-band (Claret, 1998).
Given that the Charbonneau et al. (2009) system parameters are very close to best-fit values for our J-band data, we identify a refined solution as follows. We generate a 2-D grid of transit curves centered on the Charbonneau et al. (2009) values, as a function of the stellar radius and impact parameter. At each grid point, we find the best corresponding exoplanet radius by scaling the depth of the transit curve and fitting it to the raw photometry simultaneously with the baseline polynominal, using linear regression. (Scaling the depth of the transit curve relies on the excellent approximation that the transit depth is primarily dependent on the ratio of planetary-to-stellar radius, and not on the impact parameter.) We also shift each transit curve in time for the best fit. At each grid point we calculate the of the best fit, and the location of the minimum gives our global best-fit stellar radius, impact parameter, and planetary radius. We determine errors on these quantities via the range of values contained within a contour of a given significance. The results are given in Table 1, except for the best-fit central transit time - that is included with the optical transit times in Table 2.
To fit our four optical transits, we use the Claret (1998) limb darkening coefficients to generate synthetic transit curves at the optical wavelengths. We shift these in time, without varying their depth, to find the best central time for each transit. Those times are listed in Table 2. We combine our Table 2 transit times with the individual transits given by Charbonneau et al. (2009) to derive an updated ephemeris, listed in Table 1.
4 Results and Discussion
Figure 3 shows our contours of for the fit to our J-band transit, converted to standard deviations, and shown in the plane defined by stellar radius and impact parameter. Our minimum (square on Figure 3) occurs at a smaller stellar radius and smaller impact parameter than found by Charbonneau et al. (2009). We do not regard this difference as physically significant because: 1) it can reflect a degeneracy in the fitting process, 2) the difference is not much greater than the Charbonneau et al. (2009) error range in combination with our errors - the Charbonneau et al. (2009) values are within our contour, and 3) our radius for the planet is in excellent agreement with Charbonneau et al. (2009).
The contours in Figure 3 trace a parabolic locus wherein a larger stellar radius can trade-off versus a larger impact parameter (i.e., transit at higher latitude) to produce the same transit duration. In the limit of a small planet and zero limb darkening, a chord at high latitude across a large star would produce the same transit curve as a chord at low latitude across a small star. This mild degeneracy is broken by the duration of ingress and egress, so that stellar radii exceeding approximately lie outside contours of acceptable . We derive a value for the planetary radius () by examining the values at points lying within the contour (that first contour is not illustrated on Figure 3). This yields , where the asymmetric error range reflects the fact that the radii are not distributed symmetrically within the contour. We also derived best-fit values for the stellar radius and impact parameter, and these are listed in Table 1 for comparison to the Charbonneau et al. (2009) results. Our error range for the impact parameter (a factor of two) is relatively large, reflecting the degeneracy discussed above. However, our radius for the planet has a much smaller fractional variation within the contour, and is in excellent agreement with Charbonneau et al. (2009). We conclude: 1) our value for the planetary radius is relatively insensitive to the mild degeneracy between stellar radius and impact parameter, and 2) the discovery value for the radius of this super-Earth (Charbonneau et al., 2009) is unlikely to be significantly affected by uncertainty in the optical limb darkening, or affected by stellar activity.
References
- Brown et al. (2001) Brown, T. M., Charbonneau, D., Gilliland, R. L., Noyes, R. W., & Burrows, A., 2001, ApJ, 552, 699.
- Charbonneau et al. (2009) Charbonneau, D., & 18 co-authors, 2009, Nature, 462, 891.
- Charbonneau & Deming (2007) Charbonneau, D., & Deming, D., 2007, astro-ph/0706-1047.
- Claret (1998) Claret, A., 1998, A&A, 335,647.
- Elston (1998) Elston, R., 1998, SPIE, 3354, 404.
- Miller-Ricci & Fortney (2010) Miller-Ricci, E. & Fortney, J. J., 2010, ApJ, 716, L74.
- Nutzman & Charbonneau (2008) Nutzman, P. & Charbonneau, D. 2008, PASP, 120, 317.
- Rogers & Seager (2010) Rogers, L. A., & Seager, S., 2010, ApJ, 716, 1208.
- Richardson et al. (2006) Richardson, J. L., Harrington, J., Seager, S. & Deming, D., 2006, ApJ, 649, 1043.


| Parameter | Best fitted value | Charbonneau et al.(2009) values |
|---|---|---|
| Planetary radius | ||
| Stellar radius | ||
| Impact parameter | ||
| Central transit time | (UTC-BJD) | |
| Orbital period | days |
Note: Charbonneau et al. (2009) list only individual measured transit times, not an averaged epoch. We quote their most precise individual transit.
| UT Date | Telescope | Filter | BJD & Error () |
|---|---|---|---|
| April 29, 2010 | UDEM | Ic | |
| May 29, 2010 | KP 2-m | J | |
| May 29, 2010 | KP VCT | B | |
| June 6, 2010 | UDEM | Ic | |
| June 17, 210 | UDEM | Ic |
Note: Adding these transit times to those of Charbonneau et al. (2009), gives the best-fit ephemeris parameters (period and transit time) listed in Table 1.