Interplay of p-d and d-d charge transfer transitions in rare-earth perovskite manganites
Abstract
We have performed both theoretical and experimental study of optical response of parent perovskite manganites RMnO3 with a main goal to elucidate nature of clearly visible optical features. Starting with a simple cluster model approach we addressed the both one-center (p-d) and two-center (d-d) charge transfer (CT) transitions, their polarization properties, the role played by structural parameters, orbital mixing, and spin degree of freedom. Optical complex dielectric function of single crystalline samples of RMnO3 (R=La, Pr, Nd, Sm, Eu) was measured by ellipsometric technique at room temperature in the spectral range from 1.0 to 5.0 eV for two light polarizations: and . The comparative analysis of the spectral behavior of and is believed to provide a more reliable assignment of spectral features. We have found an overall agreement between experimental spectra and theoretical predictions based on the theory of one-center p-d CT transitions and inter-site d-d CT transitions. Our experimental data and theoretical analysis evidence a dual nature of the dielectric gap in nominally stoichiometric matrix of perovskite manganites RMnO3, it is formed by a superposition of forbidden or weak dipole allowed p-d CT transitions and inter-site d-d CT transitions. In fact, the parent perovskite manganites RMnO3 should rather be sorted neither into the CT insulator nor the Mott-Hubbard insulator in the Zaanen, Sawatzky, Allen scheme.
I Introduction
The nature of the low-energy optical electron-hole excitations in the insulating transition metal 3d oxides represents one of the most important challenging issues for these strongly correlated systems. All these excitations are especially interesting because they could play a central role in multiband Hubbard models used to describe both the insulating state and the unconventional states developed under electron or hole doping. Because of the matrix element effect the optical response does provide only an indirect information about the density of states. Nevertheless it remains one of the most efficient technique to inspect the electronic structure and energy spectrum.
It is now believed that the most intensive low-energy electron-hole excitations in insulating 3d oxides correspond to the charge transfer (CT) transitions while different phonon-assisted crystal field transitions are generally much weaker. Namely the CT transitions are considered as a likely source of the optical and magnetooptical response of the 3d metal-based oxide compounds in a wide spectral range 1-10 eV, in particular, the fundamental absorption edge. The low-energy dipole-forbidden d-d orbital excitations (or crystal field transitions) are characterized by the oscillator strengths which are smaller by a factor than that for the dipole-allowed p-d CT transitions and usually correspond to contributions to the dielectric function of the order of 0.001-0.01.
Despite CT transitions are well established concept in the solid state physics, their theoretical treatment remains rather naive and did hardly progress during last decades. Usually it is based on the one-electron approach with some 2p-3d or, at best, 2p 3d, 2p3d CT transitions in 3d oxides. In terms of the Hubbard model, this is a CT transition from the nonbonding oxygen band to the upper Hubbard band. But such a simplified approach to CT states and transitions in many cases appears to be absolutely insufficient and misleading even for qualitatively explaining the observed optical and magnetooptical properties. First, one should generalize the concept of CT transitions taking into account the conventional transition between the lower and upper Hubbard bands which corresponds to an inter-site d-d CT transition (intersite transition across the Mott gap).
Several important problems are hardly addressed in the current analysis of optical spectra, including the relative role of different initial and final orbital states and respective CT channels, strong intra-atomic correlations, effects of strong electron and lattice relaxation for CT states, the transition matrix elements, or transition probabilities, probable change in crystal fields and correlation parameters accompanying the charge transfer.
One of the central issues in the analysis of electron-hole excitations is whether low-lying states are comprised of free charge carriers or excitons. A conventional approach implies that if the Coulomb interaction is effectively screened and weak, then the electrons and holes are only weakly bound and move essentially independently as free charge-carriers. However, if the Coulomb interaction between electron and hole is strong, excitons are believed to form, i.e. bound particle-hole pairs with strong correlation of their mutual motion.
Our work was stimulated by the lack of detailed and reliable studies of electron-hole excitations and of a proper understanding of the relative role of p-d and d-d CT transitions in rare-earth perovskite manganites RMnO3 (R= rare earth or yttrium) to be parent systems for the colossal magnetoresistive Tokura and multiferroic Kimura materials. Given the complex phase diagram of this class of materials, studies of the nominally stoichiometric parent compound could give an insight into physics governing the doped version of these manganite oxides.
Virtually all the experimental optical data available for manganites are focused on the LaMnO3. Except for paper by Kim et al.Kim2 on the absorption spectroscopy of thin films of RMnO3 (R=La, Pr, Nd, Gd, Tb), there has been no effort to perform a comparative study of the optical response for different rare-earth perovskite manganites. The optical conductivity spectrum of LaMnO3 exhibits two broad intensive bands centered around and - eV. Arima ; Okimoto ; Jung ; Takenaka However, it has remained unclear just what the nature of the related electron-hole excitations. Some authors Arima ; Okimoto ; Takenaka assign these both features to the dipole-allowed p-d CT transitions like and ( denoting a ligand hole), respectively. However, others Jung ; Allen assign the low-energy peak to the Jahn-Teller orbiton-excitation transition, or doubly-forbidden (parity and orbital quasimomentum) d-d-like crystal-field transition between two -sublevels separated by a splitting due to a low-symmetry crystalline field. Both interpretations being particularly qualitative suffer from many shortcomings and give rise to many questions concerning the details of the charge transfer states or expected extremely weak intensity for the d-d crystal field transitions. Pronounced temperature rearrangement of the optical spectral weight both for low- and high-energy bands was uncovered by Quijada et al.Quijada . These authors were seemingly the first who made a valid conclusion that the dominant contribution to the optical spectral weight of the conductivity peak at 2.0 eV is provided by the CT hopping between nearest-neighbor manganese ions, or inter-site d-d CT transitions.
Until recently main body of the optical data for manganites was obtained by reflectivity measurements followed by a Kramers-Krönig (KK) transformation usually accompanied by a number of unavoidable uncertainties as regards the peak positions and intensities of weak spectral features. It often implies a parasitic contribution due to a deterioration of the sample surface Okimoto , that can give rise to some ambiguities due to problems with KK transformation. The technique of ellipsometry provides significant advantages over conventional reflection methods in that it is self-normalizing and does not require reference measurements, and optical complex dielectric function is obtained directly without a Kramers-Krönig transformation. The comparative analysis of the spectral behavior of and is believed to provide a more reliable assignement of spectral features.
First ellipsometric measurements for the single crystalline LaMnO3 samples were performed by Loshkareva et al.optics-PS at room temperature and for the spectral range 1.0-5.0 eV. Later on the ellipsometric measurements were performed for an untwinned crystal of LaMnO3 by Kovaleva et al. Kovaleva ; Kovaleva-09 in a wide temperature range. The authors have presented a detailed quantitative analysis of the pronounced redistribution of the spectral weight (SW) near the Néel temperature. They concluded that the low-energy optical band around 2 eV consists of three distinct bands all assigned to intersite d-d CT transitions, and that LaMnO3 is a Mott-Hubbard rather than a charge transfer p-d insulator as argued earlier (see e.g., Refs.Tobe, ; Moskvin-Mn, ). A similar interpretation of spectral features near 2 eV observed in multiferroic TbMnO3 was reported very recently by Bastjan et al. Bastjan . Many researchers Tobe ; Kovaleva ; Kovaleva-09 ; Lawler ; Kim1 pointed to a fine sub-peak structure of the low-energy 2 eV band. Early optical transmission spectra of the LaMnO3 films Lawler revealed a fine structure with two features near and eV, respectively, which were assigned to the Mn3+ d-d crystal-field transition , split by the JT effect. Up to this point, there has been little effort to understand this mysterious sub-peak structure. First theoretical cluster model analysis of the p-d CT transitions in the MnO6 octahedra Moskvin-Mn did predict several low-energy forbidden or relatively weak allowed electro-dipole transitions with an onset at 1.7 eV to be a ”precursor” of a strong dipole-allowed p-d CT transition at 4.5-4.7 eV.
Such an ambiguity leaves the question of the nature of the main optical transitions and low-lying electron states in LaMnO3 far from being resolved. Furthermore, it seems that there is a missing qualitative aspect of the problem that so far escaped identification.
The one-electron band models, including such modern modifications as LDA, do not elucidate the matter, first of all since they fail to reproduce important intra-atomic correlation effects which form the term structure both for the ground and excited CT configurations.Ahn ; Ravindran In this connection we would like to emphasize the priority of the cluster model of the CT transitions which showed itself to advantage in explaining the optical and magnetooptical spectra of orthoferrites, iron garnets, and a number of dielectric cuprates and manganites (see, e.g., Refs.Kahn, ; Moskvin-Ferro, ; Moskvin-Mn, ; Moskvin1, ; Moskvin2, ; ferrites, ). The model is marked by the physical clearness, possibility of detailed account for the electron correlation and the crystal field effects as well.
Our efforts were focused on the theoretical and experimental studies of the low energy CT bands peaked near 2 eV with a particular interest in the fine-structure effects. To this end we first address a theoretical analysis of a large variety of different CT states and CT transitions in the perovskite manganites based on the distorted MnO6 octahedra being a basic element of their crystalline and electronic structure. Then we present the results of optical ellipsometry for a number of manganites RMnO3 (R= Pr, Nd, Sm, Eu) with a supposedly reduced spectral weight of the d-d CT transitions and a better manifestation of the fine-structure effects.
The rest of the paper is organized as follows. In Sec. II we shortly address the electronic structure, the energy spectrum of a MnO6 cluster, and the one-center p-d CT transitions. Two-center d-d CT transitions are considered in Sec. III. The experimental results of ellipsometric optical measurements for perovskite manganites RMnO3 (R=La, Pr, Nd, Sm, Eu) are presented in Sec. IV. In Sec. V we address an extended discussion of experimental data which includes a Lorentzian fitting of dielectric function, and a short overview of electronic structure for parent perovskite manganites as derived from optical data.
II One-center (p-d) charge transfer transitions in orthorhombic manganites
II.1 Electronic structure of octahedral 3d-metal-oxygen MeO6 centers in perovskites
The electronic states in strongly correlated 3d oxides manifest both significant correlations and dispersional features. The dilemma posed by such a combination is the overwhelming number of configurations which must be considered in treating strong correlations in a truly bulk system. One strategy to deal with this dilemma is to restrict oneself to small clusters, creating model Hamiltonians whose spectra may reasonably well represent the energy and dispersion of the important excitations of the full problem. Naturally, such an approach has a number of principal shortcomings, including the boundary conditions, the breaking of local symmetry of boundary atoms, and so on. Nevertheless, this method provides a clear physical picture of the complex electronic structure and the energy spectrum, as well as the possibility of quantitative modelling. In a certain sense the cluster calculations might provide a better description of the overall electronic structure of insulating 3d oxides than the band structure calculations, mainly due to a better account for correlation effects.
Five Me 3d and eighteen oxygen O 2p atomic orbitals in octahedral MeO6 complex with the point symmetry group form both hybrid Me 3d-O 2p bonding and antibonding and molecular orbitals (MO), and purely oxygen nonbonding , , , , orbitals. Nonbonding and orbitals with the same symmetry are hybridized due to the oxygen-oxygen O 2p - O 2p transfer. The relative energy position of different nonbonding oxygen orbitals is of primary importance for the spectroscopy of the oxygen-3d-metal charge transfer. This is firstly determined by the bare energy separation between O 2p and O 2p electrons.
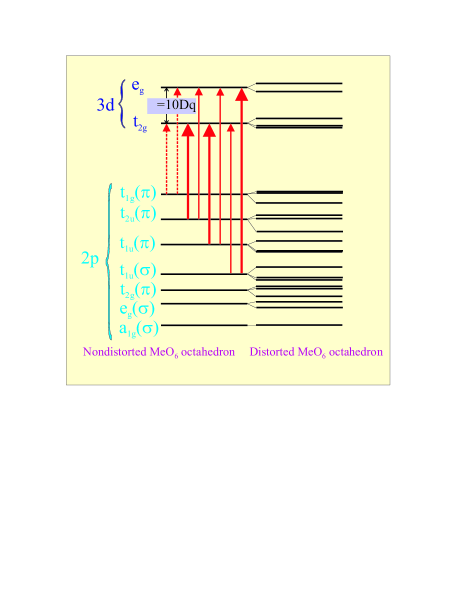
Since the O 2p orbital points towards the two neighboring positive ions, an electron in this orbital has its energy lowered by the Madelung potential as compared with the O 2p orbitals, which are oriented perpendicular to the respective 3d-O-3d axes. Thus, Coulomb arguments favor the positive sign of the separation which numerical value can be easily estimated in frames of the well-known point charge model, and appears to be of the order of eV. In a first approximation, all the states have the same energy. However, the O 2p-O 2p transfer yields the energy correction to bare energies with the largest value and positive sign for the state. The energy of the state drops due to a hybridization with the cation 4p state. In other words, the state is believed to be the highest in energy non-bonding oxygen state. For illustration, in Fig.1 we show the energy spectrum of the 3d-2p manifold in octahedral complexes like MeO6 with the relative energy position of the levels according to the quantum chemical calculations Licht for the FeO octahedral complex in a lattice environment typical for perovskites like LaFeO3 and LaMnO3. It should be emphasized one more that the top of the oxygen electron band is composed of O 2p nonbonding orbitals that predetermines the role of oxygen states in many physical properties of 3d perovskites.
Conventional electronic structure of octahedral MnO6 complexes is related with the configuration of the completely filled O 2p shells and partly filled Mn 3d shells. The typical high-spin ground state configuration and crystalline term for Mn3+ in octahedral crystal field or for the octahedral MnO center is and , respectively. Namely this orbital doublet results in a vibronic coupling and Jahn-Teller (JT) effect for the MnO centers, and cooperative JT ordering in LaMnO3. In the framework of a crystal field model the term originates from the (3d term of free Mn3+ ion.
Unconventional electronic configuration of octahedral MnO6 complexes is related with a charge transfer state with one hole in the O 2p shellsMoskvin-02 . The excited CT configuration 3d arises from the transition of an electron from the MO predominantly anionic in nature (the hole in the core of the anionic MO being hereby produced), into an empty 3d type MO ( or ). The transition between the ground configuration and the excited one can be presented as the 3d CT transition.
The CT configuration consists of two partly filled subshells, the ligand and the cation 3d shell, respectively. The latter configuration in the case of CT states in the MnO center nominally corresponds to Mn2+ ion. It should be emphasized that the oxygen hole having occupied the non-bonding orbital does interact ferromagnetically with the 3d shell. This rather strong ferromagnetic coupling results in Hund rule for the CT configurations with the high-spin ground states. The maximal value of the total spin for the Hund-like CT state in MnO center equals , that points to some perspectives of unconventional magnetic signatures of these states.
II.2 Electric dipole matrix elements
The one-electron electric dipole matrix elements for MeO6 octahedral center can be written with the aid of Wigner-Eckart theoremVarshalovich as follows (see Ref.Moskvin-Mn, for details)
| (1) |
where is the Wigner coefficient for the cubic point group Oh, the so-called quasimomentum number, is the one-electron dipole moment submatrix element. The 3d-2p hybrid structure of the even-parity molecular orbital: and a more simple form of purely oxygen odd-parity molecular orbital both with a symmetry superposition of the ligand O 2p orbitals point to a complex form of the submatrix element in (1) to be a sum of and terms composed of the one-site and two-site (d-p and p-p) integrals, respectively. In the framework of a simple ”local” approximationMoskvin-Mn , that implies the full neglect all many-center integrals:
| (2) |
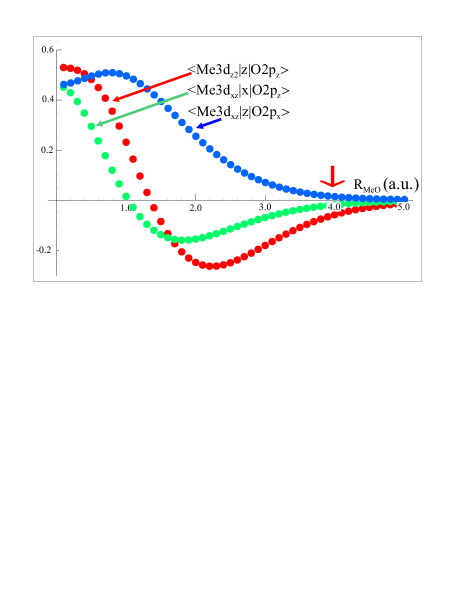
Here, , are covalency parameters for electrons, respectively, is an elementary dipole moment for the cation-anion bond length . We see, that the ”local” approximation results in an additional selection rule: it forbids the , and transitions, , and , respectively, though these are dipole-allowed. In other words, in frames of this approximation only -type () or -type () CT transitions are allowed. Hereafter, we make use of the terminology of ”strong” and ”weak” transitions for the dipole-allowed CT transitions going on the , , and , channels, respectively. It should be emphasized that the ”local” approximation, if non-zero, is believed to provide a leading contribution to transition matrix elements with corrections being of the first order in the cation-anion overlap integral. Moreover, the nonlocal terms are neglected in standard Hubbard-like approaches. In Fig. 2 we do demonstrate the results of numerical calculations of several two-site dipole matrix elements against 3d metal - oxygen separation . It is clearly seen that given typical cation-anion separations a.u. we arrive at values less than 0.1 a.u. even for the largest two-site integral, however, their neglect should be made carefully. Exps.(1),(2) point to likely extremely large dipole matrix elements and oscillator strengths for strong p-d CT transitions, mounting to and , respectively.
II.3 One-center p-d CT transitions in manganites
Now we can apply the model theory to the undoped stoichiometric perovskite manganites RMnO3. For our analysis to be more quantitative we make two rather obvious model approximations. First of all, one assumes that for the MnO centers in RMnO3 as usually for cation-anion octahedra in 3d oxides Kahn ; Licht ; TMO the non-bonding oxygen orbital has the highest energy and forms the first electron removal oxygen state. Furthermore, to be definite we assume that the energy spectrum of the non-bonding oxygen states for Mn3+O centers in RMnO3 coincides with that calculated in Ref.Licht, for Fe3+O in isostructural orthoferrite LaFeO3, in other words, we have (in eV):
Secondly, we choose for the Racah parameters and the numerical values typical for Mn2+, and eV, respectively. The crystal-field parameter eV provides a reasonable explanation of the Mn2+ spectra in MnO MnO . Furthermore, the photoemission data Park are believed to confirm the relevance of this value for crystal field splitting parameter in RMnO3. This set of parameters is used for the model theoretical simulation of the overall p-d CT band in LaMnO3.Moskvin-Mn Firstly, we argue that the lowest in energy spectral feature observed in LaMnO3 near eV (see, e.g. Ref.Jung, ) is believed to be related with the onset of the series of the dipole-forbidden p-d CT transitions , rather than with any d-d crystal field transition. The energy of this transition was picked out to be a starting point to assign all other p-d CT transitions.
Weak dipole-allowed CT transitions and form more intensive CT bands starting at higher than the preceding series energies, near and eV, respectively, in accordance with the magnitude of the and separations. Actually, the transition at 3.5 eV has to be more intensive because the state is partly hybridized with the one, hence this transition borrows a portion of intensity from the strong dipole-allowed CT transition.
The latter transition forms intensive broad p-d CT band starting with the main peak at eV and ranging to the peak at eV with interstitial peaks at eV being the result of the superposition of two transitions and , and at eV due to another transition, respectively. Thus, the overall width of the p-d CT bands with final configuration occupies a spectral range from up to eV.
Strong dipole-allowed CT transitions form two manifolds of equally intensive CT bands shifted with respect each other by the separation ( eV). In turn, each manifold consists of two triplets of weakly split and equally intensive p-d CT bands related with and transitions, respectively. In accordance with the assignment of crystal-field transitions MnO in LaMnO3 (see Fig. 1) we should expect the low-energy edge of the dipole-allowed CT band starting from eV (( separation)). Taking account of strong configuration interaction we should expect the high-energy edge of this band related with the highest in energy term of the 3d5 configuration to be situated near eV. In between, in accordance with our scheme of energy levels we predict peaks at 5.2, 5.5, 6.2 (), 7.2(), 7.9, 8.2, 8.3, and 8.9 eV. The weak dipole-allowed transitions occupy the high-energy spectral range from to eV.
Overall, our analysis shows the multi-band structure of the p-d CT optical response in LaMnO3 with the weak low-energy edge at eV, related with the forbidden transition and a series of intensive bands in the range eV starting with a composite peak at eV and closing by a composite peak at eV both resulting from the superposition of strong dipole-allowed and CT transitions.
In conclusion one should emphasize several points. First, the p-d CT excitons can move over the lattice thus forming an excitonic band. Its width would strongly depend on the character of the O 2p hole state. We anticipate rather narrow bands for and excitons, but rather wide bands for and excitons. It is worth noting that besides the charge transfer the p-d CT transitions in MnO6 octahedra are characterized by a remarkable effect of the transfer of the spin density and orbital degeneracy from Mn ion to surrounding oxygen ions. In addition, we would like to underline a crucial role of the intra-atomic correlations in forming the optical response in 3d oxides. Indeed, the one-electron energy level scheme (see, Fig. 1) points to low-lying 3d orbital to be a final state for any lower-energy CT transition, while actually the lower-energy CT transitions are related with 3d orbital as a final state because of a prevailing gain in the Hund energy.
II.4 Role of the Jahn-Teller distortions for the Mn3+O6 octahedra and the light polarization effects
Orthorhombic manganites RMnO3 are typical compounds with the 3d-electron orbital ordered ground state where 3d-like and 3d-like orbitals for -electrons are alternately ordered on Mn3+ sites in the plane and are stacked parallel along the c axis below the orbital ordering temperature T750-1500 K Good2 . Such an orbital ordering is stabilized by the cooperative Jahn-Teller (JT) effect that lifts the orbital degeneracy of the ground state crystal 5E term for the octahedral electronic configuration of Mn3+ ion. The orbital ordering causes a layer-type (so called A-type) antiferromagnetic AF ordering below TN, in which magnetic moments on Mn sites are aligned ferromagnetically in the plane and are stacked antiferromagnetically along the axis.
The -electron in the JT-distorted Mn3+O6 octahedral cluster occupies the superposition state
| (3) |
where the orbital mixing angle is determined by the deformations of Mn3+O6 octahedral cluster as follows:
| (4) |
where are the length of the Me-O bonds along the respective local co-ordinates. The unoccupied, or -hole state of the same Mn3+O6 octahedral cluster is described by the wave function which is orthogonal to :
| (5) |
The Jahn-Teller splitting energy is determined as follows: , where is a vibronic constant,
| (6) |
and is a mean Mn-O bond length. For rare-earth orthorhombic manganites the Mn-OI bond corresponds to the medium length while two Mn-OII bonds correspond to long and short lengths (see Ref.Good2, and Fig. 3). Interestingly that if the local -axis is directed along Mn-OI bond and -axis along Mn-OII bond with the longest length, and , or . In other words, it means that . In the tetragonal limit () the level splits to two singlets ( and , respectively), while the levels split to singlets and doublets (see Fig. 1). Thus all the one-center p-d CT transitions from filled nonbonding oxygen orbitals to empty orbital, both allowed and forbidden, are believed to reveal a singlet-(quasi)doublet structure. The intensity of weakly dipole allowed transitions centered near 2.5 eV, can be enhanced due to a mixing resulting from the low-symmetry deformations of MnO6 octahedra.
It should be noted that the probability for the transitions does not depend on the orbital mixing angle .
Let address the polarization properties of the main dipole-allowed one-center p-d CT transition . To this end we find the dipole transition matrix elements in the local coordinates of MnO6 octahedron:
| (7) |
and
| (8) |
Hence for spectral weights we obtain the following relation:
| (9) |
Neglecting the tilting of MnO6 octahedra we arrive at the ratio of spectral weights SWc and SWab for light polarized -axis and -plane, respectively:
| (10) |
This relation was obtained earlier by Tobe et al.Tobe though the authors tried to apply it to explain the 2 eV band polarization properties. Near the expected value of the orbital mixing angles () , while the account for the tilting of MnO6 octahedra is believed to reduce the ratio.
Generally speaking, the CT exciton creation is accompanied by an excitation of lattice modes. Indeed, the electron transfer from O to Mn state, or from an to a configuration such as transition is accompanied by a significant shortening of the equilibrium Mn-O bond length and a remarkable effect of the transfer of orbital degeneracy from Mn ion to surrounding oxygen ions accompanied by a strong change in the electron-lattice coupling. Thus, the incident photon can create a self-trapped exciton which can reemit a photon, returning either to the ground state or to various one-phonon or multiphonon excited states. The exciton-phonon interaction strongly affects the line-shape of absorption leading to Franck-Condon multiphonon sidebands and results in a phonon Raman scattering. The measurement of the Raman intensity as a function of excitation light energy is a very informative probe of the origin of electronic transitions.
II.5 Temperature dependence of the spectral weight for the p-d CT bands
Addressing the temperature dependence of the spectral weight for the p-d CT transitions we will first concern the effects of a magnetic ordering. At first sight for small one-center excitons we have a rather conventional transition with conservation of spin -state and a spin density fluctuation localized inside the MnO6 cluster. However, the redistribution of the spin density from manganese atom to the oxygen ones after the p-d CT transition switches on a strong ferromagnetic Heisenberg O 2p-Mn 3d exchange that leads to a number of temperature anomalies near the Néel temperature. At first, one has to expect a blue shift effect for the transition energy with the lowering the temperature near and below TN. Indeed, at TTN, the average molecular field for the MnO6 center turns into zero while the 3D antiferromagnetic ordering is accompanied by a rise of the exchange molecular fields and respective spin splittings. Due to an order of magnitude bigger value of the O 2p-Mn 3d exchange as compared with the Mn 3d-Mn 3d exchange this is accompanied by an increase of the transition energy with a maximal value of the blue shift as large as several tenths of eV. Additionally, one has to expect a strong (of the same order of magnitude) broadening of the excitonic line with the increase of the temperature due to strong fluctuations of molecular fields. It is worth noting that at variance with the inter-site d-d CT transition the p-d CT transition is not accompanied by strong two-magnon Raman processes, that could be used for its identification.
The temperature dependence of the phonon-assisted p-d CT transitions, such as , normally forbidden by parity considerations, is usually described by the functional form predicted for such a type of process:
where , the spectral weight at 0 K, embodies the effect of parity mixing introduced by lattice vibrations in the states connected by the transition, and is a phonon energy. Depending on the energy of the active odd-parity phonon mode(s) such a mechanism can provide up to a twofold rise of the spectral weight with the temperature rise from helium to room temperatures. Obviously, this transition borrows a portion of intensity from the nearest in the energy dipole-allowed CT transitions.
It should be noted that equally with the band-structure effects the electron-phonon interaction governs the lineshape and the temperature dependence of all the CT transitions, both dipole-allowed and forbidden ones.
III Two-center (d-d) CT transitions in manganites
III.1 Simple two-center CT model
For illustration of covalence and correlation effects in a two-center MeOn-MeOn molecular cluster, let first address its simplified version, namely a two-electron two-center (A-B) system with a single on-site electron state. Let a simple Hubbard-like Hamiltonian
| (11) |
incorporates a spin-independent single-particle transfer () and the on-site, as well as inter-site Coulomb repulsion. For a purely covalent bonding () the conventional single-particle MO-LCAO bonding-antibonding basis set
| (12) |
provides a diagonalization of the transfer Hamiltonian, and we have simple symmetrized
two-particle basis set for spin singlets with energies , respectively, and antisymmetrized function for a spin triplet. All purely covalent states describe a bond-centered charge ordering and are characterized by the equal mean on-site electron density distribution, definite parity and zero mean dipole moment. At the same time, there are strong charge and dipole moment fluctuations.
Depending on the properties of the on-site functions the single-particle bonding and antibonding MO-LCAO orbitals not only possess definite parity with regard a center of inversion in the two-center cluster, but resemble simple - and - orbitals, respectively. This implies an occurrence of the specific for ”covalent” systems mechanism of the allowed electric-dipole transitions with the dipole matrix elements determined only by the separation
and observed in the ”longitudinal” polarization .
In the opposite case of the purely ionic bonding () we apply a conventional Heitler-London approach forming two one-site symmetrized configurations and for spin singlets which energy equals , and two two-site configurations, described by symmetrized even and antisymmetrized odd functions for spin singlet and triplet, respectively, which energies both equal . All initial purely ionic states describe a site-centered charge ordering with a strictly definite on-site electron density distribution. Most interestingly that the and states interact due to a somewhat like an exchange resonance reaction with a probability amplitude , or an effective two-particle transfer integral. For a pair of identical centers we can compose even- and odd-parity superpositions with - and -like behaviour, and the energy splitting due to the two-particle transfer (), respectively.
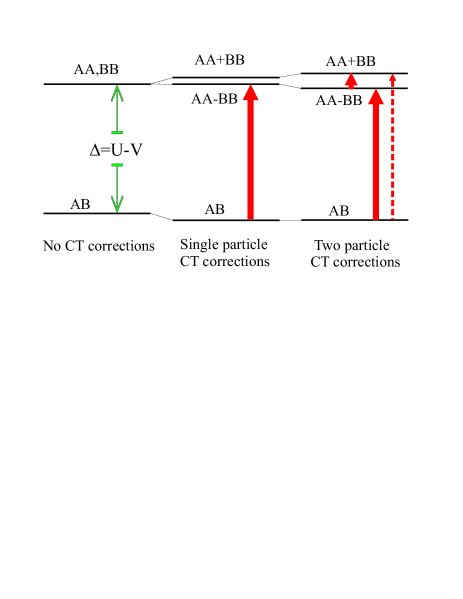
Assuming , and we switch on a weak single-particle inter-center transfer and simulate a weak covalent situation. In frames of spin singlets we obtain three two-electron orbital states (see Fig. 4):
Even-parity ground state:
| (13) |
Odd-parity excited state:
| (14) |
Even-parity excited state:
| (15) |
where
| (16) |
Here we ignore the spin-triplet state and ferromagnetic Heisenberg exchange coupling.
Even-parity ground state and odd-parity excited state are coupled by a dipole-allowed charge transfer transition at the energy with a dipole matrix element
| (17) |
We see that the oscillator strength or spectral weight for such a two-center d-d CT transition can be easily related to the kinetic contribution to the exchange integral in the AB pair: Ahn ; Oles .
Even- and odd-parity excited states and are also coupled by a dipole-allowed transition at the energy with a dipole matrix element
| (18) |
The d-d CT excitons can move over the lattice thus forming an excitonic band. Its width would strongly depend on the character of the electron-hole state. In particular, we anticipate rather wide bands for d-d excitons, but rather narrow bands for d-d excitons.
III.2 Classification of two-center (d-d) CT transitions in manganites
Simple model approach can be easily generalized to describe inter-center charge transfer transitions between two MeOn clusters centered at neighboring sites A and B, which define two-center CT excitons in 3d oxides. These two-center excitons may be addressed as quanta of the disproportionation reaction
| (19) |
with the creation of electron MeO and hole MeO centers. Depending on the initial and final single particle states all the intersite d-d CT transitions may be classified to the , , , and ones. For the 3d oxides with 3d cations obeying the Hund rule these can be divided to so-called high-spin (HS) transitions and low-spin (LS) transitions , respectively.
The inter-center d-d CT transition in manganites
| (20) |
implies the creation of the hole MnO and electron MnO centers with electron configurations formally related to Mn4+ and Mn2+, respectively. The HS one-particle d-d CT transition driven by transfer can be written as follows:
| (21) |
The transition energy for such an anti-Jahn-Teller transition is defined as follows:
| (22) |
that points to its dependence on the structural parameters (see (6)).
The energies of different d-d CT transitions can be easily derived using the proper Tanabe-Sugano diagrams for the and configurations. For instance, the low-energy HS d()-d() CT transition (21) sets up a rather wide band of the LS d()-d() CT transitions () with the energy separations (given a cubic symmetry) Trees :
which do not depend on the crystal field splitting parameter and do scarcely vary from one compound to another that makes the transitions to be important optical signatures of the d()-d() charge transfer. Making use for the Racah parameters the numerical values typical for free Mn2+ ion: B=0.12; C=0.41 eV, we arrive at three LS d()-d() CT bands separated from the low-energy HS d()-d() CT band by 3.2, 4.1, and 5.5 eV, while from experimental optical spectra for MnO MnO we obtain slightly lower energies: 2.8, 3.8, and 5.1 eV, respectively.
It should be noted that the intra-atomic electron-electron repulsion does mix the states with different configurations and/or different intermediate momenta but the same crystal terms . This point is of a great importance for and terms of Mn2+ which are a result of the interaction of two bare terms: and , respectively. It is worth noting that only the former term is active in the d()-d() charge transfer, which does not affect the subshell.
The wave functions for and terms can be written as follows:
| (23) |
where , and . In other words, the both terms are almost equally involved in the d()-d() charge transfer under consideration.
In the eV gap in between the low-energy HS and LS d()-d() CT transitions one may observe a relatively weak low-energy HS d()-d() CT transition at the energy and low-energy LS d()-d() CT transitions anticipated at the energies eV and eV, respectively MnO . Spectral weights for the both transitions are determined by () transfer integrals which are believed to be relatively small as compared with large transfer integrals.
III.3 Two-center CT d-d transitions:Effect of orbital states and Me1-O-Me2 bond geometry
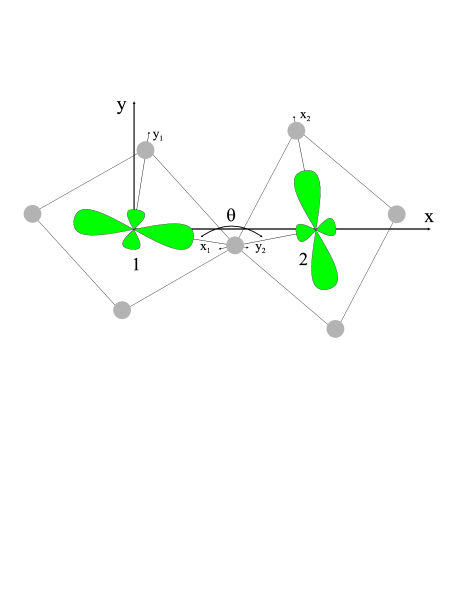
As it is seen from (16), (17) the d-d CT transition probability amplitude is determined by the respective single-particle transfer integral. These integrals depend both on initial and final states and the Me1-O-Me2 bond geometry. For two octahedral MeO6 clusters sharing the common oxygen ion we arrive at following expressions for transfer integrals:thesis
| (24) |
where the 3d-orbitals (), () are specified in the local co-ordinates for Me1O6 and Me2O6 clusters with and axes directed to the common oxygen ion; are transfer parameters for bonds, respectively; is a Me1-O-Me2 bonding angle; is the Wigner rotation matrixVarshalovich with being the Euler angles, specifying the transformation from the local co-ordinates for Me1O6 to that for Me2O6 cluster.
Thus we see that the probability amplitude for the HS CT transition along -axis in perovskite manganite RMnO3 would depend on the crystallographic parameters as follows:
| (25) |
while for the similar transition in the pair of nearest neighboring Mn3+O6 octahedral clusters located in -plane we arrive at
| (26) |
| (27) |
Hence the spectral weight for the inter-site d-d CT transitions may be written as follows:
| (28) |
It is worth noting that the orbital mixing angle dependence (28) strictly coincides with that of Ref.Kovaleva, . Kim et al. Kim2 presented an expression for SWab which accounts only for transfer (compare our Exp.(26) and Exp.(4) from Ref.Kim2, ) that immediately questions their main conclusions.
The spectral weight for the two-center d-d CT transition can be easily related with the kinetic contribution to the exchange integral in the Mn3+-Mn3+ pair:
| (29) |
The both expressions do predict a sizeable suppression of the SWab and SWc in RMnO3 for the two-center d-d CT transition with decreasing the ionic radius of R-ion, if to take into account proper variation of the structural parameters , , and Good2 .
III.4 Two-center CT d-d transitions:Spin dependence and temperature behaviour
After ruling out the roles of the Mn-O-Mn bond angle and the octahedral-site distortion in determining the d-d CT transition probability, we have to consider whether the spin degree of freedom affect the d-d CT transition.
Interestingly that despite the spinless character of dipole moment operator its matrix on the pair wave functions depends on the spin quantum numbers
| (30) |
for the () electron transfer. Here the conventional notations are used for spin -symbol, . For the partial spectral weight for transition we have
| (31) |
where
| (32) |
| (33) |
Making use of the normalization relation for -symbolsVarshalovich
| (34) |
we arrive at a spin sum rule:
| (35) |
For the partial spectral weight for transition we have
| (36) |
where is the temperature dependent statistical weight of spin multiplet. Taking into account the above expressions for -symbols we see that the temperature dependence of the partial spectral weight would be determined by a statistical average which, in its turn, relates to the spin-spin correlation function as follows
| (37) |
Thus we should conclude that the partial spectral weight for transition in an isolated spin pair is governed by a spin-dependent prefactor containing the spin-spin correlation function:. For the HS transition and the LS transition in the pair of identical 3d ions we arrive at
| (38) |
| (39) |
respectively. These expressions allow to obtain easily both the low-temperature () and high-temperature (, ) limits for the spin prefactor. Schematically the temperature dependence of the spectral weight for the HS d-d CT transition in ferromagnetically and antiferromagnetically ordering Mn3+-Mn3+ pairs () is shown in Fig.5. It should be noted that similar results were obtained earlier by Oleś et al. Oles though from another starting point.
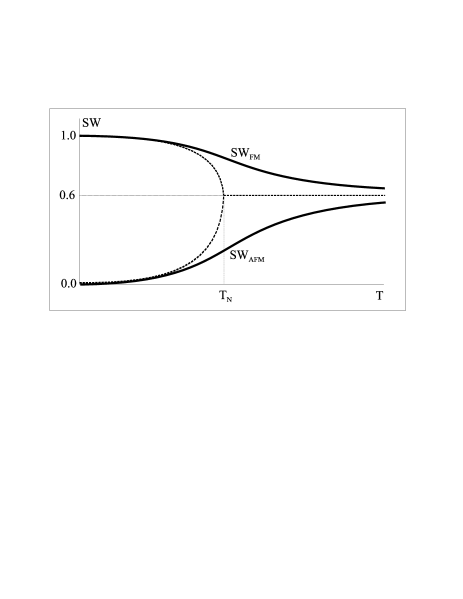
In accordance with a spin sum rule (35) the sum of spin prefactors in the right hand sides of the expressions (38) and (39) turns into unity due to an exact compensation of temperature dependent terms with the spin-spin correlation function. In other words, the higher-energy LS bands exhibit a strictly opposite SW evolution with the temperature as compared with HS band, that is varying the temperature we arrive at the SW transfer between the HS- and LS-subbands. In the limit the HS band in the antiferromagnetically coupled spin pair or LS band in the ferromagnetically coupled spin pair are freezed out. However, this prohibition is lifted for the HS band in the antiferromagnetically coupled spin pair, if we take account of effective staggered magnetic fields which affect the spin pair in the antiferromagnetic surroundings giving rise to a spin singlet-triplet mixing. Furthermore, the low-temperature SW for the HS band in the antiferromagnet is believed to be a quantitative measure of the Néel state weight in the ground antiferromagnetic state. The ratio of spectral weights and does weakly depend on the structural parameters such as and , in the high-temperature limit () , while in the low-temperature limit () for antiferromagnetic A-type order this ratio turns into zero. It is important to note that the temperature variation between these two limits is controlled by the nearest-neighbor spin-spin correlation function, which varies smoothly with T, and not by the square of the sublattice magnetization, which of course vanishes above TN. One generally has considerable short-range order above any magnetic-ordering temperature, and for LaMnO3 with K the ferromagnetic correlations should persist to quite high temperatures and the full difference in the spectral weight of the d-d CT transition between the antiferromagnetic ground state and the paramagnetic state is not saturated by 300 K. In contrast with LaMnO3 the room temperature seems to correspond quite well to a high-temperature limit () for such manganites as SmMnO3 and EuMnO3 with and 50 K, respectivelyGood2 . In other words, the optical measurements could be used to inspect the short-range spin correlations in manganites. It is worth noting that the spin-spin correlation function for the nearest-neighbor spins localized on the i-th and j-th Mn sites governs the effect of phonon renormalization Granado . This effect was examined Granado ; Mukhin for all orthorhombic RMnO3 compounds.
III.5 Some features of CT transitions in strongly coupled corner-shared MnO6 clusters
Above we have addressed a somewhat idealized scenario of p-d and d-d CT transitions which implies well isolated or weakly coupled MnO6 clusters. Actually in perovskite manganites we deal with strongly coupled corner-shared MnO6 clusters sharing a common oxygen ion. Strictly speaking, it means that we cannot make use of an oversimplified classification of the p-d and d-d CT transitions. Indeed, the O 2p electrons localized on the intermediate common oxygen ion cannot be attributed to one or another cluster. Formally this implies a strong overlap of the bare wave functions localized on the neighboring clusters. Generally speaking, this trouble can be overcomed with making use of the orthogonalization procedure, e.g. by the Löwdin technique. This immediately results in a two-center character of the wave functions with the onset of two-center spin and orbital correlations.
Many features of the corner-shared MeO6 clusters related with the p-d overlap and covalency effects can be illustrated by a more simple generic two-hole-three-site M1-O-M2 cluster model to be a natural generalization of the above addressed two-site A-B model. To this end we make use of a technique suggested in Refs.DM-JETP ; DM-PRB ; mechanism to derive the expressions for the Dzyaloshinsky-Moriya coupling and spin-dependent electric polarization in copper oxides.
We start with the construction of spin-singlet and spin-triplet wave functions for our three-center two-hole system taking account of the p-d hopping, on-site hole-hole repulsion, and crystal field effects for the bare ground state 101 and bare excited configurations (011, 110, 020, 200, 002) with different hole occupation of M1, O, and M2 sites, respectively. The p-d hopping for M-O bond implies a conventional Hamiltonian
| (40) |
where creates a hole in the state on the oxygen site, while annihilates a hole in the state on the copper site.
Perturbed wave functions can be written as follows
| (41) |
where are bare wave functions for configuration and the summation runs both on different configurations and different orbital states;
| (42) |
is a normalization factor. If we neglect the overlap integrals, the probability amplitudes for configurations coupled by a single p-d transfer are defined by the ratio of the generalized p-d transfer integrals and the p-d transfer energy as follows:
| (43) |
In other words, , while the probability amplitudes, or hybridization parameters for configurations coupled by a two-step p-d transfer, such as are on the order of .
Formally, the 101011(110) and 101002(200) CT transitions may be attributed to p-d and d-d charge transfer, respectively. However, the configuration interaction due to the charge transfer and overlap do result in that both types of the CT transitions are accompanied by a charge redistribution all over the three centers. Furthermore, a novel type of p2-dd CT transitions 101020 does emerge due to a mixing of all the 101, 110, 011, 020 configurations in the initial and final states. Obviously, the main contributions to dipole transition matrix elements for p-d, d-d, and p2-dd CT transitions are proportional to , , and , respectively. Accordingly, the spectral weights for the dipole allowed p-d, d-d, and p2-dd CT transitions are
respectively.
Interestingly, all the dipole-allowed CT transitions obey the spin-selection rule, however, the dipole transition matrix elements depend on the total spin S due to a spin (S) dependence of the energy denominators in the probability amplitudes and so in the normalization factors, particularly due to a contribution of 200, 020, and 002 two-hole on-site configurations. Indeed, for such configurations the spin-singlet and spin-triplet terms are usually separated by a large energy gap. In general, the spin-dependent part of the electro-dipole moment operator acting in the basis of the three-site wave functions can be written as follows
| (44) |
Such a spin operator for a transition dipole moment was firstly introduced by Sugano et al. TMS to explain so-called magnon side-bands in the optical absorption spectra of magnetic crystals. Simple estimates yield and for p-d and d-d CT transtions, respectively. In other words, the spin-dependent part of the spectral weight for both transitions appears to be of the same order: . It should be noted that the spin-dependent part of the spectral weight in the three-site two-hole cluster can be written as follows:
| (45) |
if to take into account that
From this reasoning we may conclude that, in contrast to a clue point of papers by Kovaleva et al. Kovaleva ; Kovaleva-09 , the both dipole-allowed d-d and p-d CT transtions are equally sensitive to the temperature-dependent spin correlations, only with a different change of the optical response through the onset of the magnetic order, relatively large for the former and relatively small for the latter.
IV Ellipsometric study of optical response of RMnO3
Theoretical analysis (see preceding section and Refs.Kovaleva, ; Kovaleva-09, ) clearly shows that the spectral weight of the HS d-d CT transitions is to be sizeably suppressed with decreasing the ionic radius of R-ion and increasing structural distortions that provides an opportunity to a better manifestation and inspection of the relatively weak p-d CT transitions expectedly forming a fine structure of 2 eV band in manganites. Indeed, a marked suppression of the spectral weight for the 2 eV band was observed by Kim et al. Kim2 in the ab-plane absorption spectra of RMnO3 (R=La, Pr, Nd, Gd, and Tb) thin films. However, the authors focused on the suppression effect and did not concern the fine structure of the band. We have, on the contrary, studied the optical response of RMnO3 (R=La, Pr, Nd, Sm, and Eu) with a main interest in the fine structure of 2 eV band and a more comprehensive assignment of different p-d and d-d CT transitions.
The perovskite manganites RMnO3 crystallize in the orthorhombic structure (space group ), where Mn3+O6 octahedra share corners with Mn3+-O-Mn3+ angle varying from for LaMnO3 to in the end of the series Good2 . The orthorhombic RMnO3 compounds with large ionic radia from La to Gd are characterized by A-type antiferromagnetic AFM structure. In this structure the Mn moments are ferromagnetically (FM) ordered in the planes and antiferromagnetically coupled along the direction. The Néel temperature TN decreases from 140 K for LaMnO3 to 40 K for GdMnO3 Good2 . With increasing structural distortions, the magnetic structure of RMnO3 compounds with small ionic radii changes to an incommensurate IC sinusoidal AFM structure (R=Tb, Dy) or to a so-called E-structure (R=Ho, Er).
We have studied the optical response for single crystalline samples of RMnO3 (R=La, Pr, Nd, Sm, Eu) grown by the floating-zone technique described in Ref.Balbashov, . Magnetic properties of these samples are reported in Refs.Mukhin1, ; Kadomtseva, . As a rule, the as-grown single crystals of RMnO3 had twins, however, it was possible to choose some samples exhibiting a strong magnetic and optical anisotropy, hence these could be considered as practically untwinned.
The measurements were performed with a home-built automatic ellipsometer on the x-ray oriented single crystalline bulk samples with as-grown polished surface ( mm2) where the angle of incidence was 67∘ or 72∘. Spectroscopic ellipsometry measurements were performed on the surfaces for PrMnO3 and NdMnO3 crystals for high-symmetry orientations and of the optical axis with respect to the plane of incidence of light and on the surfaces for SmMnO3 and EuMnO3 crystals for high-symmetry orientation . The crystal surfaces (-plane for PrMnO3 and NdMnO3, and -plane for SmMnO3 and EuMnO3) were polished to optical grade with diamond powders.
Optical complex dielectric function of single crystalline samples of RMnO3 was studied at room temperature in the spectral range from 0.5 to 5.5 eV. However, our experimental technique had some spectral limitations and provided reliable optical data only in the spectral range 1.5-5 eV of strong absorption. Optical constants, refractive index and extinction ratio have been calculated with using relations reported in Ref.Nomer, . The technique of ellipsometry provides significant advantages over conventional reflection methods in that it is self-normalizing and does not require reference measurements, and optical complex dielectric function are obtained directly without a Kramers-Krönig transformation. The comparative analysis of the spectral behavior of and is believed to provide a more reliable assignement of spectral features.
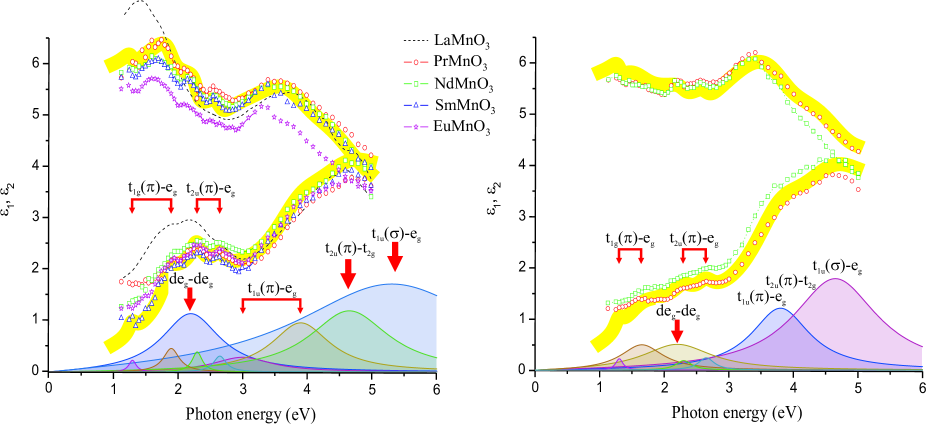
Fig. 6 shows the and room temperature spectra of RMnO3 (R= Nd, Pr, Sm, Eu) for two main light polarizations, -axis and -axis, respectively, together with earlier data for LaMnO3optics-PS . The optical spectra of RMnO3 are interesting in several aspects. First of all, as in many earlier works on LaMnO3, we clearly see two intensive and rather broad optical features peaked at around 2 eV and 4.5 eV, respectively. Both the intensity and shape of the high-energy band change weakly inbetween different manganites, whereas the spectral weight of the broad band peaked at 2.0 eV in LaMnO3 seems by factor 1.5 bigger than in other manganites. This result agrees with the findings by Kim et al.Kim2 who investigated the -plane absorption spectra of RMnO3 (R=La,Pr,Nd,Gd, and Tb) thin films and observed a drastic suppression of the 2 eV peak with the decrease of the R-ion radii.
The broad 2 eV band exhibits strong anisotropy, it is hardly visible at -axis polarization. As expected, our measurements for R=Nd, Pr, Sm, Eu have uncovered many subtle features missed in earlier optical experiments on parent manganites. First, the comparative analysis of the and spectra (see Fig. 6) allows us to unambiguously conclude that the 2 eV feature is composed of a single intensive and rather broad band peaked at 2.0 eV for LaMnO3 and 2.2 eV for other manganites, and several relatively weak and narrow bands peaked nearly equally for all the manganites at 1.3, 1.9, 2.3, 2.7 eV (), respectively. Interestingly, that not only the energies but also the intensities of these bands hardly depend on the manganite type if any. This observation immediately points to different nature of both features at variance with Kovaleva et al.Kovaleva who addressed the 2 eV feature in LaMnO3 to consist of three distinct bands, peaked at 1.95, 2.35, 2.70 (, T=300 K) each attributed to inter-site d-d CT transitions. Weak sub-peaks show up a clear anisotropy.
As regards the high energy spectral feature peaked at around 4.5 eV one should note its hardly visible composite structure with as minimum three rather intensive bands which integral spectral weight for -axis polarization seems to be slightly larger than for -axis polarization.
Our ellipsometric data for RMnO3 samples (R=Pr, Nd, Sm, Eu) agree with that of Kovaleva et al.Kovaleva for LaMnO3 samples all over the spectral range with a visible discrepancy only below 1.5 eV where ellipsometric technique fails to reliably reproduce the optical response because of a crucial role of the sample morphology, surface roughness, and depolarization effects. Namely these effects rather than intrinsic electronic structure are believed to be responsible for a sizeable scatter of data for different RMnO3 samples (R=Pr, Nd, Sm, Eu) below 1.5 eV. The spectral limitations affect smoothly the results in the low absorption range, but not the positions and the strength of intensive absorption bands. In other words, these limitations are believed not to affect the main result of our paper that is the assignment of p-d and d-d CT transitions in the spectral range 1.5-5 eV.
V Discussion
V.1 Optical response of RMnO3 as an interplay of p-d and d-d CT transitions
In Fig. 6 we have presented the results of a semi-quantitative analysis of the spectra in the energy range covered by our experiment based on a dispersion analysis of the complex dielectric function , which was fitted by a set of 8 Lorentzian oscillators. To reproduce the tails of the high-energy bands we have introduced an additional optical band peaked at around 8.7 eV () or 8.2 eV (). It is worth noting, that the Lorentzian fitting should be made with a great care because of several points. First of all, the Lorentzian function is a clear oversimplification for complex line-shapes resulting from an interplay of the electron-lattice interaction and excitonic band effects. Second, it is worth noting the increased uncertainties both of the measurement and, accordingly, of the analysis close to the low- and high-energy cutoffs of our experiment. It should be noted that the results of the Lorentzian fitting for the near 2 eV optical feature rather than are quite robust to the assumptions related with the transitions beyond the energy range. All the oscillators we made use can be sorted into three groups assigned to: i) an intensive and broad band peaked at 2.2 eV, ii) weak and narrow bands peaked at 1.3, 1.9, 2.3, 2.65 eV, forming a fine structure of 2.2 eV band, and iii) intensive bands peaked at 3.0, 3.9, 4.65, 5.3 eV, forming a broad spectral feature peaked at around 4-5 eV. A proper Lorentzian decomposition is shown in Fig. 6.
Both the spectral weight, polarization properties, and temperature behaviorQuijada ; Kovaleva ; Kovaleva-09 of the intensive and broad 2 eV band in all the manganites investigated point to its inter-site d-d CT character, or strictly speaking, to the low energy HS CT transition. Such a conclusion is strongly supported by proper quantitative estimates Ahn ; Kovaleva ; Kovaleva-09 .
One of the most impressive manifestations of the d-d CT origin of the 2 eV band in LaMnO3 is provided by the resonance Raman spectroscopy Raman-Kruger . Indeed, the out of phase B2g (Pbnm system) breathing mode Martin at 611 cm-1, which strongly modulates the intersite d-d charge transfer, shows a single pronounced resonance at around 2 eV. It is worth noting that the authors Raman-Kruger found a good agreement between the experimental results and a theory by Allen and Perebeinos Allen based on the Franck-Condon mechanism activating multiphonon Raman scattering. However, the assignment of the 2 eV absorption peak to the intra-molecular transition due to the Frank-Condon process between the Jahn-Teller split levels seems to be questionable because it cannot explain the basic features of 2 eV band such as a rather strong spectral weight with a peculiar temperature dependence (see detailed discussion in Ref. Quijada, ).
As it is seen from Exp.(29) the spectral weight of the 2 eV d-d CT band depends on the orbital mixing angle , Mn-O-Mn bond angle , and the d-d transfer energy , which in turn depends on the JT distortions of MnO6 octahedra (see Exp.(22)). Our experimental data unambiguously show that the minimal inter-site CT energy eV is virtually constant for R= Nd, Pr, Sm, and Eu. Interestingly that the red shift of the band in LaMnO3 ( 2.0 eV) is due to a sizeably lower magnitude of the JT energy (see Ref.Good2, ) as compared with other manganites studied ( 2.2 eV), furthermore, this can provide a sizeable 20% contribution to the spectral weight enhancement, while the effect of and variation is restricted by 10%. This result agrees with theoretical predictions based on the structural dependence of the SW and also supports the inter-site d-d CT assignment of the 2 eV band.
Lorentzian decomposition of 2 eV feature in RMnO3 with assignement of all the peaks is shown in Fig.6. The intensity and energy position of four narrow bands forming the fine structure of 2 eV feature agree surprizingly well with the theoretical predictions made earlier by one of the authors (see Ref.Moskvin-Mn, ) for the forbidden and weakly-allowed one-center p-d CT transitions splitted by a near tetragonal crystal field. It is worth noting that a close similarity of tetragonal distortions for MnO6 octahedra in all the manganites under consideration Good2 does explain a nearly equal position of relatively weak and narrow bands peaked for all the manganites at 1.3, 1.9, 2.3, 2.7 eV (). Weak non-tetragonal distortions of MnO6 octahedra are seemingly visible for transition. Indeed, the -response is well fitted by two Lorentzians peaked at 1.3 and 1.9 eV, while -response needs two Lorentzians peaked at 1.3 and 1.7 eV, respectively. It is worth noting that the energy splitting of nonbonding oxygen orbitals (0.5 and 0.4 eV, respectively) appears to be slightly smaller than that of orbital ( 0.7 eV). The relative sharpness of all the weak p-d CT bands agrees with a localized character of nonbonding oxygen O 2p orbitals. The most intensive and broad high-energy band modeled by four Lorentzians peaked at 3.0, 3.9, 4.65, and 5.3 eV can be unambiguously assigned to the one-center dipole-allowed p-d CT transitions: (), (), () transitions, respectively, with a hardly resolved low-symmetry splitting for the most intensive and broad bands. The composite high-energy p-d CT band is markedly revealed by the resonance Raman spectroscopy in LaMnO3 Raman-Kruger . One observe pronounced resonances at around 4-5 eV both for the Ag Jahn-Teller stretching and Ag out-of-phase rotation modes of the oxygen octahedra at 496 cm-1 and 284 cm-1, respectively, and also for the in phase symmetric B1g stretching mode at 655 cm-1. Interestingly that the same Raman modes resonate also at around 2 eV that supports our conclusion about the composite d-d/p-d structure of the low-energy CT band. It is worth noting that in LaMnO3 we deal with a near degeneracy of the d-d CT transition and one of the p-d CT transitions at 1.9-2.0 eV. It means a strong coupling/mixing of two types of transitions.
Concluding the subsection we would like to comment an assignment of p-d and d-d CT transitions in LaMnO3 reported in recent papers by Kovaleva et al Kovaleva ; Kovaleva-09 . As it is clearly seen in Fig. 6(see also Figs.8 and 9 in Ref. Kovaleva-09, ) the optical response of LaMnO3 in contrast to RMnO3 (R=Pr, Nd, Sm, Eu) does not distinctly reveal fine structure effects. Neverthless, the authors Kovaleva ; Kovaleva-09 made use of a Lorentzian decomposition of the complex dielectric response and , measured by ellipsometric technique in the spectral range 1.2-6.0 eV at the temperatures varied between 20 and 300 K. They did consider only one high-energy strongly dipole-allowed p-d CT transition at 4.7 eV, while other optical bands observed at around 2.0, 2.4, 2.7, 3.8, 4.4, 4.6, 5.7 eV were assigned to different HS and LS inter-site d-d CT transitions. The assignment was based on the temperature dependence of the partial and total spectral weights, and a parameterization of the energy spectrum of final d3-d5 configuration. However, the argumentation is believed to be questionable because of several unacceptable assumptions and inconsistencies. First, the authors neglect a number of one-center p-d CT transitions to be precursors of the most intensive high-energy dipole-allowed p-d CT transitions peaked at around 4.7 eV. As we have shown above these include the low-energy nominally dipole-forbidden, however, phonon-assisted transition centered at around 1.7 eV, the weak dipole-allowed transition centered at around 2.5 eV, and a more intensive dipole-allowed transition centered at around 3.5 eV. All the p-d CT bands are characterized by a sizeable temperature dependence of the line-shape and spectral weight, both due to electron-lattice and spin-spin correlations, with a pronounced T-dependent SW transfer between dipole-allowed and dipole-forbidden bands. The situation becomes more involved, if to take into account the interaction/mixing between p-d and d-d transitions.
Second, the analysis Kovaleva ; Kovaleva-09 of the electron structure and energy spectrum of the d3-d5 configuration to be a final one for the d()-d() charge transfer should be revisited in several points, in particular, as regards the assignment of the LS transitions. The fact is that the gap in between the low-energy HS and LS d()-d() CT transitions eV, i.e. markedly bigger than 2.3 eV suggested in Ref. Kovaleva-09, . The authors have unreasonably turned down the term of the d5 configuration while the both and terms are almost equally involved in the d()-d() charge transfer under consideration. As a result, both the assignment of the LS d-d CT transitions and quantitative estimates of such parameters as the Hund exchange integral , spectral weights SWLS obtained in Ref. Kovaleva-09, seem to be questionable ones.
Third, the authors address three bands at 2.0, 2.4, and 2.7 eV to form a three-subband structure of the 2 eV d-d CT band. However, they cannot explain the origin of this splitting. Nevertheless, their quantitative analysis implies eV (not 2.4 or 2.7 eV!) to be an energy of the HS d()-d() CT transition.
From the other hand, the excellent experimental data by Kovaleva et al Kovaleva ; Kovaleva-09 for LaMnO3 are beyond all doubt. However, these support our assignment of p-d and d-d CT transitions in perovskite manganites and challenge a detailed analysis of the temperature effects with taking into account a sizeable contribution of the electron-phonon coupling, comparable spin-dependent terms in the spectral weight for the both p-d and d-d CT transitions, and coupling/mixing of the both types of CT transitions.
V.2 Parent perovskite manganites: Mott-Hubbard or charge transfer insulators?
Above we have provided an experimental evidence of a dual nature of charge gap states in perovskite manganites to be a superposition of inter-site d-d and one-center p-d CT transitions, a remarkable observation, which to the best of our knowledge has not been previously reported for the perovskite manganites. This implies a revisit of a standard ZSA classification scheme usually applied for these compounds.
Zaanen, Sawatzky, and Allen (ZSA) ZSA have pointed out that all the insulating 3d-electron systems can be classified into two categories: the Mott-Hubbard and charge transfer insulators, depending on the nature of the gap. In the former the gap is formed by the transition between the lower and upper Hubbard bands (), while in the latter it is formed by the CT transitions between upper filled ligand and upper Hubbard bands (). Actually in both cases we deal with CT transitions, however, in terms of a classification introduced by A. Moskvin et al. Moskvin1 ; Moskvin2 these correspond to two-center (d1-d2-) and one-center (pd-) CT excitons, respectively. Usually one considers that the gap is of CT p-d type () for heavier transition metals (Cu, Ni, …), while it is of d-d type () for the light transition metals (Ti, V, …). However, actual situation can be rather intricate. For instance, parent cuprates such as CuO, La2CuO4, Sr2CuO3, Sr2CuO2Cl2 are usually addressed to be Mott-Hubbard insulators, however, the detailed analysis of recent EELS data reveals its dual nature because of the gap described by a superposition of one- and two-center CT excitons Moskvin1 ; Moskvin2 . Simple ZSA scheme needs in a revisit as it does not take into account a number of important issues.
The parameter appears in the simple generic pd-model describing the 3d oxides, with the hole Hamiltonian
| (46) |
where , and all the terms have its usual form. This Hamiltonian describes fairly well the pd-hybridization effects. Depending on the sign and numerical value of the parameter we come to a rather smooth redistribution of the hole density from the cations given large positive to anions given large negative . This effect, as it is stressed by Khomskii D.Khomskii bears the quantitative character albeit the properties of systems with positive and negative can differ substantially.
However, simple Hamiltonian (46) does not take into account a number of important effects, including the symmetry of different d-, p-states, crystalline field, polarization corrections, and electron-lattice coupling, particularlly important in the case of a near degeneracy for the centers of gravity of the d- and p- manifolds. Electron correlations need in a more correct description, which must include a full set of the Slater, or Racah parameters. First of all, we should discriminate the (anti)bonding and nonbonding orbitals. For instance, in simple octahedra like MeO6 we have two sets of 3d orbitals with and symmetry, and seven sets of O 2p orbitals with , , , , , , and symmetry. Only two of them, and hybridize with 3d orbitals having the same symmetry. From the other hand, namely the nonbonding O 2p orbitals seemingly form the first electron removal state in perovskites with octahedrally coordinated 3d ions Licht . Thus, simple cluster model points to a need in the realistic multi-band description of 3d oxides with a set of parameters like Moskvin-02 . The near degeneracy of the 3d orbitals with nonbonding oxygen states qualitatively differs from that for two hybridized orbitals of the same symmetry, and can result in a number of novel effects, in particular, generated by enhanced electron-lattice coupling with local, or cooperative low-symmetry lattice deformations. In the case of the near-degeneracy of hybridizing 3d and O 2p states the lattice deformation is governed by the active high-symmetry breathing modes.
We should note that in many cases the charge transfer with the lowest energy corresponds to the dipole-forbidden transition with a very weak spectral weight, that hampers its assignment. In general, we should make use of symbol for the smallest of the O 2p- Me 3d charge transfer gaps, and for the gap revealed in optical response due to strong dipole-allowed and charge transfer transitions, respectively. Hence, one might say that the ZSA classification needs in detailization.
As concerns the ZSA classification for perovskite manganites the situation seems to be far from being resolved. The parent compound LaMnO3 is sorted either into the charge transfer insulatorArima ; Tobe or the Mott-Hubbard insulatorQuijada ; Kovaleva ; Kovaleva-09 ; Kim1 ; Kim2 . Interestingly, that in the study by Arima et al. Arima LaMnO3 is addressed to be located in the vicinity of the borderline where the optical gap changes from the Mott gap to the charge transfer gap that implies its dual nature. Our experimental data and theoretical analysis support this conjecture and evidence a dual nature of the dielectric gap in perovskite manganites RMnO3, being formed by a superposition of p-d CT transitions and inter-site d-d CT transitions. In fact, the parent perovskite manganites RMnO3 should rather be sorted neither into the CT insulator nor the Mott-Hubbard insulator in the ZSA scheme.
At present there is no decisive experimental technique that provides the separation of one- and two-center CT excitons and distinction between Mott-Hubbard and CT insulators. It seems, one-dimensional 3d compounds are good candidates for such a study since the light with the electric field perpendicular to the chain direction does excite only electron-hole pairs sitting on one MeOn cluster. On the other hand, for parallel to the chain direction, both types of excitons (one- and two-center’s) can be observed. Indeed, the polarization-dependent angle-resolved EELS study of the 1D cuprate Sr2CuO3 with the corner-shared CuO4 plaquettes has provided a unique opportunity to separate both the one- and two-center CT excitons and reveal the two-peak nature of the CT gap with the presence of nearly degenerate two types of excitations Moskvin2 . In other words, similar to RMnO3, insulating cuprates appear to be neither Mott-Hubbard, nor CT insulators, thus falling into intermediate region in which there are strong fluctuations between one- and two-center CT excitons.
VI Conclusions
We have performed a compehensive theoretical and experimental study of optical response of parent perovskite manganites RMnO3. Starting with a simple cluster model approach we addressed both the one-center (p-d) and two-center (d-d) CT transitions, their polarization properties, the role played by structural parameters, orbital mixing, and spin degree of freedom. Optical complex dielectric function of single crystalline samples of RMnO3 (R=La, Pr, Nd, Sm, Eu) has been measured by ellipsometric technique at room temperature in the spectral range from 1.0 to 5.0 eV for two light polarizations: and . The comparative analysis of the spectral behavior of and , particularly for polarization, is believed to provide a more reliable assignment of spectral features. Our experimental data and theoretical analysis evidence a dual nature of the dielectric gap in these manganites, being formed by a superposition of forbidden (1.3 and 1.9 eV) or weak dipole allowed (2.3 and 2.7 eV) p-d CT transitions and inter-site d()-d) (2.0 eV in LaMnO3 and 2.2 eV in other manganites) HS CT transitions, a remarkable observation, which to the best of our knowledge has not been previously reported for these materials. In fact, the parent perovskite manganites RMnO3 should rather be sorted neither into the CT insulator nor the Mott-Hubbard insulator in the Zaanen, Sawatzky, Allen scheme. We found an overall agreement between experimental spectra and theoretical predictions based on the theory of one-center p-d CT transitions and inter-site d-d CT transitions. Spectral features at 3.0 and 3.8 eV are assigned to a weak dipole-allowed p-d CT transition of the type with a clearly resolved low-symmetry splitting. Strong dipole-allowed p-d CT transitions and of the and type, respectively, are observed as the most intensive bands with an unresolved structure at 4.7 and 5.3 eV. Weak low-spin counterparts of the HS d()-d) CT transition are seemingly superimposed on these strong p-d CT bands.
We argue that the both dipole-allowed d-d and p-d CT transtions are equally sensitive to the temperature-dependent spin correlations, only with a different relative change of the optical response through the onset of the magnetic order, relatively large for the former and relatively small for the latter.
Finally one should note that some uncertainties and discrepancies observed in optical response of different MnO3 samples can be related with a charge transfer instability of perovskite manganites and a trend to a phase separation. Moskvin-98 ; Moskvin-09 ; Moskvin-LTP ; optics-PSa ; optics-PSb ; droplet ; CIC ; Mih
We thank R. V. Pisarev for fruitful discussions. The present work was partly supported by the RFBR under Grants No. 08-02-00633 and No. 10-02-96032 (A.S.M.), the DPS program ”Physics of new materials and structures” (N.N.L).
References
- (1) Y. Tokura, Rep. Prog. Phys. 69 797 (2006).
- (2) T. Kimura, T. Goto, H. Shintani, K. Ishizaka, T. Arima, and Y. Tokura, Nature London 426, 55 (2003).
- (3) M. W. Kim, S. J. Moon, J. H. Jung, J. Yu, S. Parashar, P. Murugavel, J. H. Lee, and T. W. Noh, Phys. Rev. Lett. 96, 247205 (2006).
- (4) T. Arima, Y. Tokura, J. Phys. Soc. Jap. 64, 2488 (1995).
- (5) Y. Okimoto, T. Katsufuji, T. Ishikawa, A. Urushibara, T. Arima, and Y. Tokura, Phys. Rev. Lett. 75, 109 (1995); Y. Okimoto, T. Katsufui, T. Ishikawa, T. Arima, and Y. Tokura, Phys. Rev. B 55, 4206 (1997).
- (6) J. H. Jung, K. H. Kim, D. J. Eom, T. W. Noh, E. J. Choi, J. Yu, Y. S. Kwon, Y. Chung, Phys. Rev. B 55, 15489 (1997);J. H. Jung, K. H. Kim, T. W. Noh, E. J. Choi, and J. Yu, Phys. Rev. B 57, R11043 (1998).
- (7) K. Takenaka, K. Iida, Y. Sawaki, S. Sugai, Y. Moritomo, and A. Nakamura, J. Phys. Soc. Jap. 68, 1828 (1999).
- (8) P.B. Allen and V. Perebeinos, Phys. Rev. Lett. 83, 4828 (1999).
- (9) M. A. Quijada, J. R. Simpson, L. Vasiliu-Doloc, J. W. Lynn, H. D. Drew, Y. M. Mukovskii, and S. G. Karabashev, Phys. Rev. B 64, 224426 (2001).
- (10) N. N. Loshkareva, Yu. P. Sukhorukov, E. V. Mostovshchikova, L. V. Nomerovannaya, A. A. Makhnev, S. V. Naumov, E. A. Gan’shina, I. K. Rodin, A. S. Moskvin, A. M. Balbashov, JETP 94, 350 (2002).
- (11) N. N. Kovaleva, A. V. Boris, C. Bernhard, A. Kulakov, A. Pimenov, A. M. Balbashov, G. Khaliullin, and B. Keimer, Phys. Rev. Lett. 93, 147204 (2004).
- (12) N. N. Kovaleva, A. M. Oleś, A. M. Balbashov, A. Maljuk, D. N. Argyriou, G. Khaliullin, and B. Keimer, arXiv:0907.5098v1.
- (13) K. Tobe, T. Kimura, Y. Okimoto, Y. Tokura, Phys. Rev. B 64, 184421 (2001).
- (14) A. S. Moskvin, Phys. Rev. B 65, 205113 (2002).
- (15) M. Bastjan, S. G. Singer, G. Neuber, S. Eller, N. Aliouane, D. N. Argyriou, S. L. Cooper, and M. Rübhausen, Phys. Rev.B 77, 193105 (2008).
- (16) J. F. Lawler, J. G. Lunney, and J. M. D. Coey. J. Appl. Phys. Lett. 65, 3017 (1994).
- (17) M. W. Kim, P. Murugavel, S. Parashar, J. S. Lee, and T. W. Noh, New Journal of Physics 6 156 (2004).
- (18) K. H. Ahn and A. J. Millis, Phys. Rev.B 61, 13545 (2000).
- (19) P. Ravindran, A. Kjekshus, H. Fjellvag, A. Delin, and O. Eriksson, Phys. Rev.B 65, 064445 (2002).
- (20) F. J. Kahn, P. S. Pershan, J. P. Remeika, Phys. Rev. 186, 891 (1969).
- (21) A. S. Moskvin, A. V. Zenkov, E. I. Yuryeva, V. A. Gubanov, Physica B, 168,186 (1991); A. S. Moskvin, A. V. Zenkov, E. A. Ganshina et al., Journal of Physics and Chemistry of Solids, 54, 101 (1993).
- (22) A. S. Moskvin, R. Neudert, M. Knupfer, J. Fink, and R. Hayn, Phys. Rev. B 65, 180512(R) (2002).
- (23) A. S. Moskvin, J. Málek, M. Knupfer, R. Neudert, J. Fink, R. Hayn, S.-L. Drechsler, N. Motoyama, H. Eisaki, and S. Uchida, Phys. Rev. Lett. 91, 037001 (2003).
- (24) R. V. Pisarev, A. S. Moskvin, A. M. Kalashnikova, and Th. Rasing, Phys. Rev. B 79, 235128 (2009).
- (25) A. I. Liechtenstein, A. S. Moskvin, V. A. Gubanov, Sov. Phys. Solid State 24, 2049 (1982).
- (26) A. S. Moskvin, I. L. Avvakumov, Physica B, 322/3-4, 371 (2002).
- (27) D. A. Varshalovich, A. N. Moskalev, V. K. Khersonskii. Quantum Theory of Angular Momentum (World Scientific, Singapore, 1988).
- (28) E. Clementi and D. I. Raimondi, J. Chem. Phys. 38, 2686 (1963);E. Clementi, D. I. Raimondi, and W. P. Reinhardt, J. Chem. Phys. 47, 1300 (1967).
- (29) C. N. R. Rao, B. Raveau, Transition Metal Oxides, VCH, 1995.
- (30) B. Fromme, U. Brunokowski, and E. Kisker, Phys. Rev. B 58, 9783 (1998).
- (31) J.-H. Park, C. T. Chen, S.-W. Cheong, W. Bao, G. Meigs, V. Chakarian, Y. U. Idzerda, Phys. Rev. Lett. 76, 4215 (1996).
- (32) J.-S. Zhou and J. B. Goodenough, Phys. Rev. Lett. 96, 247202 (2006).
- (33) A. M. Oleś, G. Khaliullin, P. Horsch, and L. F. Feiner, Phys. Rev. B 72, 214431 (2005).
- (34) We do not consider the so-called Trees correction which results in an additional blue-shift of the LS d-d CT transitions.
- (35) A. S. Moskvin, Dr.Sci. thesis, Moscow State University, 1984.
- (36) E. Granado, A. Garcia, J. A. Sanjurjo, C. Rettori, I. Torriani, F. Prado, R. Sanchez, A. Caneiro, and S. B. Oseroff, Phys. Rev. B 60, 11879 (1999).
- (37) J. Laverdiere, S. Jandl, A. A. Mukhin, V. Yu. Ivanov, V. G. Ivanov, and M. N. Iliev, Phys. Rev. B 73, 214301 (2006).
- (38) A. S. Moskvin, JETP, 104, 911 (2007).
- (39) A. S. Moskvin, Phys. Rev. B 75, 054505 (2007).
- (40) A. S. Moskvin, S.-L. Drechsler, Phys. Rev. B 78, 024102 (2008).
- (41) Y. Tanabe, T. Moriya, S. Sugano, Phys. Rev. Lett. 15, 1023 (1965).
- (42) A. M. Balbashov, S. G. Karabashev, Ya. M. Mukovskiy, S. A. Zverkov, J. Cryst. Growth 167, 365 (1996).
- (43) A. A. Mukhin, V. Yu. Ivanov, V. D. Travkin, and A. M. Balbashov, JMMM, 226-230, 1139 (2001).
- (44) A. M. Kadomtseva, Yu. F. Popov, G. P. Vorobev, V. Yu. Ivanov, A. A. Mukhin, A. M. Balbashov, JETP Lett. 81, 590 (2005).
- (45) L. V. Nomerovannaya, A. A. Makhnev, A. N. Malyuk, G. A. Bolotin, G. L. Shtrapenin, and A. N. Ignatenkov, Fiz. Met. Metalloved. 80, 164 (1995).
- (46) R. Krüger, B. Schulz, S. Naler, R. Rauer, D. Budelmann, J. Bäckström, K. H. Kim, S-W. Cheong, V. Perebeinos, and M. Rübhausen, Phys. Rev. Lett. 92, 097203 (2004).
- (47) L. Martín-Carrón and A. de Andrés, Eur. Phys. J. B 22, 11 (2001).
- (48) J. Zaanen, G. A. Sawatzky, and J. W. Allen, Phys. Rev. Lett. 55, 418 (1985).
- (49) D. Khomskii, Lith. Phys. J. 37, 65 (1997); arXiv:cond-mat/0101164.
- (50) A. S. Moskvin, Physica B, 252, 186 (1998).
- (51) A. S. Moskvin, Phys. Rev. B 79, 115102 (2009).
- (52) A. S. Moskvin, Low Temp. Phys. 33, 234 (2007).
- (53) A. S. Moskvin, E. V. Zenkov, Yu. D. Panov, N. N. Loshkareva, Yu. P. Sukhorukov, E. V. Mostovshchikova, Physics of the Solid State, 44, 1519 (2002).
- (54) Yu. P. Sukhorukov, N. N. Loshkareva, E. A. Gan’shina, E. V. Mostovshchikova, I. K. Rodin, A. R. Kaul, O. Yu. Gorbenko, A. A. Bosak, A. S. Moskvin, and E. V. Zenkov, JETP, 96, 257 (2003).
- (55) E. V. Mostovshchikova, N. G. Bebenin, and N. N. Loshkareva, Phys. Rev. B 70, 012406 (2004).
- (56) N. N. Loshkareva, Yu. P. Sukhorukov, E. A. Neifel d, V. E. Arkhipov, A. V. Korolev, V. S. Gaviko, E. V. Panfilova, V. P. Dyakina, Ya. M. Mukovskii, and D. A. Shulyatev, JETP 90, 389 (2000).
- (57) T. Mertelj, D. Kuscer, M. Kosec, and D. Mihailovic, Phys. Rev. B 61, 15102 (2000-II).