Tc map and superconductivity of simple metals at high pressure
Abstract
We calculate Tc map in region of weak electron-phonon coupling based on simple phonon spectrum. By using linear-response method and density functional theory, we calculate phonon spectra and Eliashberg functions of simple metals under pressure. Based on the evolutions of superconducting parameters of simple metals on the Tc map with increasing pressure, we find that there are two different responses to pressure for simple metals: (1) enhancing electron-phonon interaction such as for La and Li, (2) increasing phonon frequency such as for Pb, Pt. The threshold effect is found, which origins from the competition between electron-phonon interaction and electron-electron Coulomb interaction and is the reason why Tc of most superconductors of simple metals are higher than 0.1K.
Key Words: Tc Map, superconductivity, pressure, simple metals
PACS: 74.62.Fj, 74.20.Fg, 74.25.Dw
1 Introduction
The BCS theory and its strong-coupling generalization (Eliashberg theory) have successfully explained the superconductivity of elementary metals and their alloys [1, 2]. In strong electron-phonon coupling region , Eliashberg equation has been widely studied, where is the parameter of electron-phonon interaction and is Coulomb pseudo-potential. However in weak-coupling region is comparable with . The competitions between electron-phonon interaction and electron-electron interaction are so prominent that some new aspects of Eliashberg equation can be found in such region. The Eliashberg equation is very hard to be solved using analytic method. In fact no analytic solution has been found except for some extreme limit. The numerical methods can overcome the difficulties encountered by analytic method and provide full and global information on Eliashberg equation. The Tc maps in three-dimensional parameter space had been calculated [3], which can predict the possible highest transition temperature for a certain superconducting material and light the route to find superconductors with higher Tc [3]. It’s very interesting to study the evolution of superconducting parameters on the Tc map with external parameter such as pressure.
The issues on the superconductivity of simple elements become active due to the developments of high pressure technique based on diamond-anvil cell (DAC). The Tc of metal lithium can reach about 20K at high pressure [4, 5]. The researches along this direction have been extended to non-metal elements, such as sulphur [6], oxygen [7] and diamond [8], non-magnetic metals such as non-magnetic iron [9], calcium [10] and yttrium [11]. Some of them have very complex lattice structures, rich structural phase diagrams and corresponding structural phase transitions. Thus from structural complexity point of view, these simple elements, such as lithium and boron, are not really simple. The Tc of these superconductors generally change with the changes of crystal structures. At very high pressure some simple metals even transform to insulator phase or semiconductor phase [12, 13]. An introduction for the superconductivity of simple elements can be found in a short review [14].
Theoretically, the linear response method in the framework of density functional theory has been widely used to calculate the superconducting properties of simple elements [15, 16]. These calculations reproduce very well the transition temperatures of some elements such as metal lithium [17, 18], yttrium [19] and lanthanum [20, 21] at high pressure. In this paper we present the information on so-called Tc map [3] in weak-coupling region. The numerical calculations in weak-coupling region are more difficult than those in strong-coupling region because the very low Tc needs more Matsubara frequencies to obtain more numerically reliable Tc. In this work, we find the threshold effect of , which can explain why noble metals are not superconductors even at very high pressure. We use density functional theory and perturbed line-response theory to calculate the Eliashberg function . We mainly concentrate on the non-magnetic simple metals and try to find how their Tc run on the Tc map with increasing pressure. With increasing pressure, two different pressure effects are found: (1) enhancing such as for La and Li and (2) increasing phonon frequency such as for Pb and Pt. The metals belong to the first group generally undergo complex structural phase transitions with increasing pressure.
2 Strong-Coupling theory
The energy-gap equation of Eliashberg-Nambu theory in the Matsubara’s imaginary-energy form is standard and well established [1]. Firstly, we use a simple analytic model of Eliashberg function written in the form
| (1) |
where is the energy (or frequency) of phonon mode, the half-width of peak of phonon mode and . The parameter of electron-phonon interaction can be written as . The moments of the distribution function are defined as . Based on these moments, others frequency parameters are defined as . Another important parameter is . The Coulomb pseudo-potential is defined as and its renormalized value is , where is the Coulomb parameter, the density of states at Fermi energy, the characteristic energy for electrons such as the Fermi energy or band width, and the characteristic phonon energy such as the energy cutoff of phonon energy or Debye energy. In the region of small , where Tc is generally smaller than 10K. To accurately define Tc, the number of Matsubara energy must be larger enough to guarantee the range of energy larger than the maximum of phonon energy. We choose =1000, the values of T0.1K are numerically reliable if 60 meV.
There are two important Tc formulas based on strong coupling theory, which are the McMillan formula[2]
| (2) |
and the formula generalized by Allen [1]
| (3) |
where and are the functions of , , and , which can be found in Ref.[1].
3 Threshold effect of
The McMillan’s formula presents a threshold . If , the superconductivity will be destroyed by Coulomb interaction. A solution of Eliashberg equation had been found long time ago by Wu and his co-workers [22, 23, 24]. The formula is expressed as , where . The formula is accurate in strong-coupling region. If number of Matsubara energies used in calculation is large enough the formula is analytic when even with 1.0. It had been proved that if 1, [23]. When , the Tc formula is not analytic and physically, superconductivity does exist. If the number N of Matsubara energies is large, the form of the Tc formula will be very complicated.
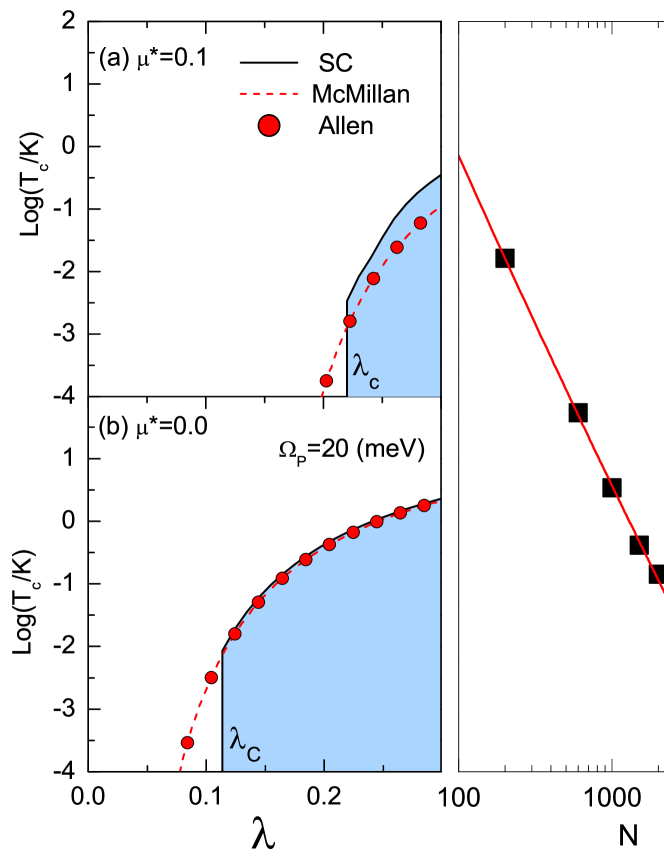
What is the threshold in general Eliashberg theory?. In this section we present our numerical solution by using large number of Matsubara energies up to N=5500. From Fig.1(a), we find that, for , the results of strong-coupling calculations are considerably different from McMillan’s and Allen’s formulae. The strong-coupling theory used in this work shows a disrupted change for Tc. When , there are no superconductivity. The is dependent on the number of Matsubara energies. In our calculations, we increase the number from 200 to N=5500, the decreases from 0.26 to 0.22 with . If we use larger , also takes larger values. In Fig.1(b), we decrease to zero, the decreases to about 0.10-0.11. The in many aspects are similar to obtained from McMillan formula, for instance, slightly larger that . This means that and 0. If =0, 0.10.11 shown in Fig.1(b).
The accurate is hard to define numerically because a very large N is needed to obtain reliable results if T0.0001K. This brings difficulties to define Tc if TK using numerical calculations of Eliashberg theory. At this time, McMillan formula is a good choice as shown in Fig.1(a,b). In the case of =0.0, the Fig.1(c) show N-dependent with logarithm-scale. we fit N-dependent using formula . The fitting results are =-0.16 and =0.0299. This means that, if , =0.0299. Thus our results imply that the threshold of exists, but not so large as shown in Fig.1. Additionally, there are many physical reasons that make not too small. In fact, only finite is enough because of the existence of the cutoff for phonon energy (Debye energy). Moreover some pair-breaking interactions such as the interaction with magnetic order and magnetic fluctuation make larger.
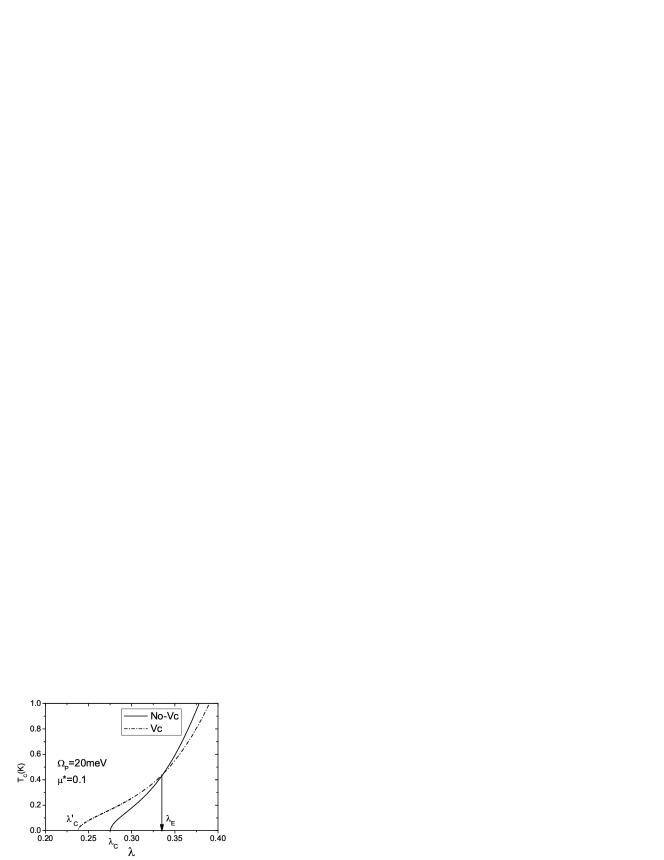
We further study the influence of vertex correction or non-adiabatic effects on . Generally, we expect that in strong-coupling region with , the vertex correction has significant influence on Tc. However in weak-coupling region from Fig.2, we find that the vertex correction can reduce to smaller value. This is closely related to the positive vertex correction ( is transition temperature including vertex correction) that had been found in previous work [3]. The magnitude of vertex correction is dependent on the effective band-width, in which the smaller band-width is corresponding to the strong vertex correction. In Fig.2, the effective band-width is about 1.0 eV. The band widthes of simple metals are generally larger than 1.0 eV so that the vertex correction has smaller effects than that shown in Fig.2.
We have found that both larger N and vertex correction make decrease to the small value. As an approximation, we define an approximate threshold =0.22-0.28 if =0.1. The region with and T0.1K is called weak-superconductivity region. The superconductivity in this region is easily destroyed by pair-breaking interaction coming from magnetism or inhomogeneity of superconducting materials. In fact, for most of simple metals, Tc are larger than 0.1K except for W, Be , Pt and Rh.
Tc changing discontinuously with will have significant effects on the superconductivity. Simple metals have very low Tc and their parameters of electron-phonon interaction are generally smaller than 0.5. The threshold effect can predict why some noble metals such as Au, Ag and Cu are not superconductors even under very-high pressure. The threshold effect determines why Tc of most of simple metals are higher than 0.1K. We will extend the Fig.1 to Tc map on plane (Fig.4) in the section 5.
| Tc | T | |||||
|---|---|---|---|---|---|---|
| Ni | =3.51 | 0.15 | 101 | - | - | |
| Pd | =3.97 | 0.20 | 0.350c | 58.55 | - | 3.20a |
| Pt | =4.00 | 0.32 | 53.2 | 0.15 | 0.02b | |
| Cu | =3.62 | 0.17 | 0.140c | 50.12 | - | - |
| Ag | =4.15 | 0.12 | 0.146e | 23.70 | - | - |
| Au | =4.13 | 0.21 | 0.170d | 19.16 | - | - |
| Cd | =2.97 | 0.55 | 0.710e | 31.8 | 0.98 | 0.52 |
| =1.88 | ||||||
| Hgh | (,)=3.18 | 1.85 | 21.1 | 4.87 | 4.15 | |
| Pb | =4.77 | 1.41 | 1.680c | 50.0 | 8.01 | 7.20 |
| Lif | =3.38 | 0.33 | 202.2 | 22(41) | 20(50) | |
| Cs | =6.13 | 0.12 | 0.95 | - | 1.66(8) | |
| Lag | =5.34 | 0.986 | 63.24 | 6.84 | 6 | |
| Al | =3.95 | 0.37 | 0.440c | 352.2 | 1.20 | 1.18 |
| Tl | =3.45 | 1.58 | 25.4 | 5.20 | 2.40 | |
| =1.59 |
a Stritzker et al., irradiation with He+ Ref.[28]; b Schindler et al., powder samples, Ref.[29]; c Savrasov et al., Ref.[15]; d Bauer et al., Ref.[30]; e Bose, Ref.[16] with of 3d and 4d transition metal elements; f fcc structure. At ambient pressure Li is metal with bcc structure without superconductivity. g fcc structure. h Rhombohedral structure.
4 The phonon spectrum and electronic-phonon interaction from the calculations of linear response method
With development of the method of electronic-structure calculation in solid materials, the Eliashberg function and the parameters of electron-phonon interaction can be calculated using density functional theory combined with linear-response theory [15]. The q-dependent parameter of electron-phonon interaction is defined as
| (4) |
where is phonon linewidth, the dispersion relation of phonon, the electronic density (pre spin) at Fermi surface. The usual is the weighted average of for different points and the summation of all phonon bands or phonon modes. In this work, the , and are calculated using the linear response theory with the frame of the density functional theory based on the plane-wave pseudo-potential method [25]. We just simply use the q-independent Eliashberg function in standard Eliashberg theory. A full treatment electron-phonon interaction needs q-dependent Eliashberg function introduced in reference [26].
The ultra-soft pseudo-potential and the GGA approximation [27] are used in total-energy calculation of electronic structure [25]. In the calculations, two Monkhorst-Pack grids 161616 and 242424 are used for fcc and bcc structure, two grids of 16168 and 242412 for hcp structure. The Monkhorst-Pack grids for the phonon calculations are 444 and 666 for fcc and bcc, 442 and 663 for hcp structures respectively. The energy cutoffs are different for different elements within range from 400 eV to 550 eV.
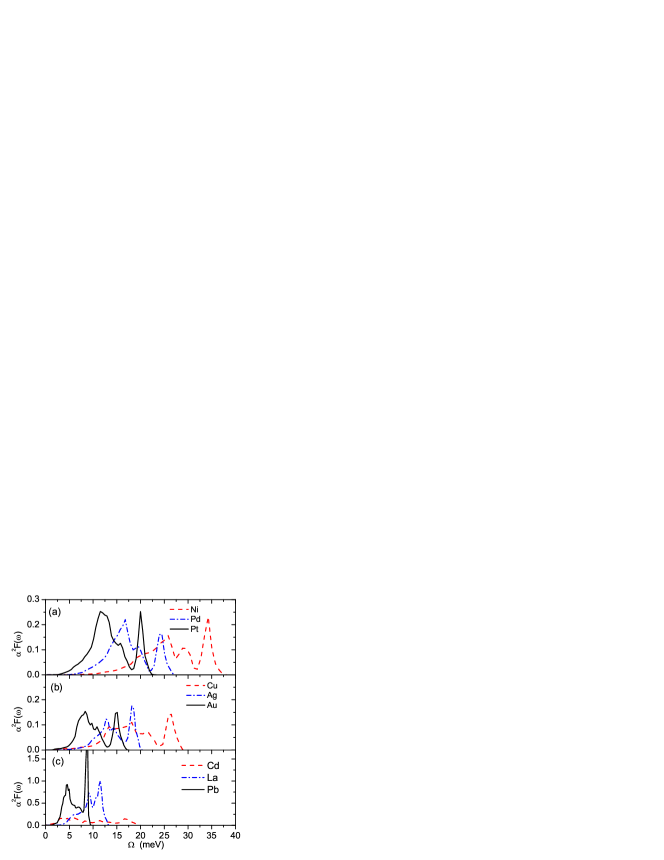
Using the Eliashberg function obtained from linear response theory and the standard strong-coupling theory, we can more reliably calculate Tc and other properties of superconductors. We have calculated the Eliashberg functions of simple metals listing in Table.(1). We plot functions of Ni, Pd and Pt in Fig.3(a), Cu, Ag and Au in Fig.3(b), Cd, La and Pb in Fig.3(c). From Table.(1), metallic Ni has relatively large hopfield parameter , so it is a potential superconductor under extreme condition such as at high pressure similar to non-magnetic iron [9]. Our calculations have shown that the magnetic moment of Ni atom quenches to zero when pressure is higher than 300 GPa. The element Pd has smaller and its superconductivity is only found in the samples after the irradiation with He+ [28]. The element Pt has relative larger value than the threshold , so it should be a superconductor. The superconductivity of element Pt, however, is only found in powder samples [29]. From Table.(1), the values of noble metals Cu, Ag and Au are all smaller than the threshold , so the threshold effect for small in strong-coupling theory is indicative that noble metals Cu, Ag and Au have no superconductivity. It’s correct even at high pressure (see next section). In Table.(1), the elements of heavy metals such as Pb, Hg, Cd and La have relative large . For metallic Pb, we use the norm-conservation pseudo-potential which gives better phonon spectrum and Tc. The Hg and Cd have smaller values so these heavy metals have small space to increase Tc further at extreme condition such as high-pressure. The Tc in Table.(1) for Cd, Hg, Pb and La match the experimental values very well. These heavy metals have soft modes with imaginary energies at normal condition. This agrees with general arguments that the softening of vibration mode is intrinsic important to superconductivity. It’s reasonable that we use the Coulomb pseudo-potential 0.1 in strong coupling calculation for all simple metals under studied. This is because the obtained Tc are very close to experiments shown in Table.1. The underlying physical reason is probably that large band-width of these simple metals make the re-normalized very close to 0.1.
5 The evolution of superconductivity with increasing pressure on Tc map
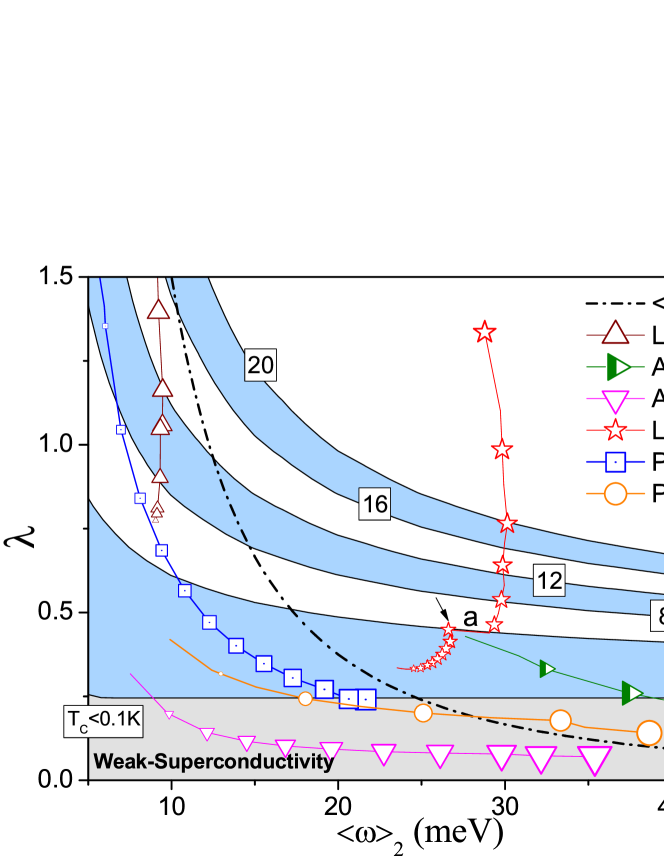
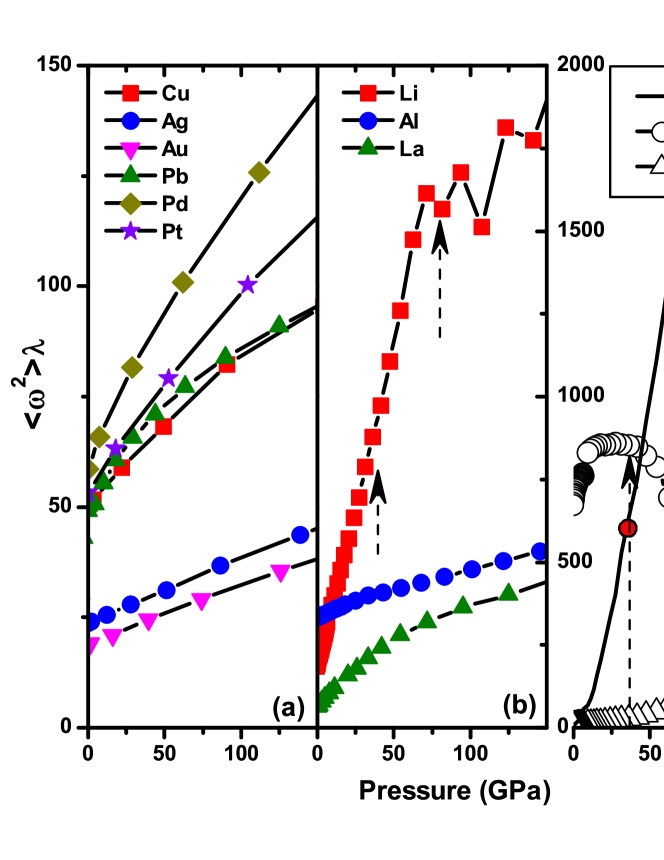
As main purpose of this context, we study the evolutions of superconducting state on Tc map [3] when pressure increases. The static pressure is simply controlled by changing the cell volume. We plot the evolutions of superconducting parameters of Al, Au, Pt, Li, La and Pb on the map with increasing pressure shown in Fig.4. The is used to measure the phonon energy instead of used in previous papers [3]. The for Au decreases with pressure and increases with pressure, which is very similar to others noble metal Cu and Ag. The keeps smaller than is indicative that Au, Ag and Cu can not become superconductors within pressure ranges up to 300GPa. At ambient pressure, Pt is marginal superconductor, but its superconducting parameters enter non-superconductivity region when increasing pressure. The metal Al is real superconductor at ambient pressure and becomes non-superconductivity with increasing pressure. The metal Pb is a strong-coupling superconductor and Tc decreases with increasing pressure.
The positive for La and Li with increasing the pressure are different from the negative for Al, and Pb. For La and Li, the parameters of electron-phonon interaction increase with pressure and the changes relative small (even decrease). A structural instability happens at 13 GPa for Li. We recalculate the curve using norm-conserving pseudo-potential. The structural instability still remains however it becomes very weak. For Li, the ultra-soft pseudo-potential gives Tc=22K at pressure 36 GPa and for normal-conserving pseudo-potential Tc=20K at 15 GPa. Thus the results of ultra-soft pseudo-potential are more close to experimental Tc=20K at pressure 50 PGa in Ref. [4] and Tc=16K at 40 GPa in Ref [5]. Similar to Li, both and Tc of La increase with pressure and has only small change. The more sensitive response of than for applying pressure means that Li and La try to modify their lattice structures under high pressure. However for Pb, Pt, Au and Ag under high pressure the lattice structures are stable and the frequencies of phonons are more efficiently increasing with pressure.
An important relation =constant has been plotted on the Tc map. The relation had been used to explain the spatial anti-correlation between energy gap and phonon energy found in the samples of HTSC superconductor Bi2212 [3] and the anomalous isotope effects of Rb3C60 [31]. A very useful formula of isotope effects had been derived [31] based on the relation. The pressure-dependent had been studied in detail using the formula of strong-coupling theory [32]. The Fig.5(a,b) show that does not keep as constant with increasing pressure. However our calculations show that the generalized relation =constant is correct for isotope substitution for simple metals.
The curve of Pb is very close to the curves of Cu with non-superconductivity, Pt and Pd with weak superconductivity shown in Fig.5. The superconductivity of Pb is because of the large or strong-electron-phonon interaction. The atomic mass of Pt is very close to Pb but with very weak superconductivity. This is because the parameter of Pt is far less than that of Pb shown in Table.(1), although the phonon energy of Pt is almost twice higher than that of Pb shown in Fig.3. The parameter measures the possible maximum of Tc, however the individual values of and need to be considered to determine the real Tc of a superconducting material. The parameter increases with pressure for most of superconductors in Fig.5. However, this does not mean that Tc always increases with pressure. The depressed Tc with increasing such as for Pb ascribes to the decrease of . For metal Al the same situation is correct and its Tc decreases with increasing pressure and close to zero at 5 GPa [33], which is consistent with our calculations and others [34].
Experimentally, metal Li shows complex structural phase-transitions in diamond anvil when pressure increases up to 100 GPa. There are at least two phase transitions at around 40 GPa and around 70-80 GPa [13]. Around 20-40 GPa, fcc structure is stable. Tc reaches to 16K near 40GPa. From 40 GPa to 70-80 GPa the c/16 phase is stable and Tc keeps about 16K [5] (even reaches about 20K [4]). When pressure is higher than 80 GPa, a structural phase happens and Tc decreases. Compared with our results shown in Fig.5(b,c), the phonon energy significantly deceases at pressure around 40 GPa, and with pressure increasing further, reaches to the maximum at pressure around 80 GPa. Thus our results mean that, between 40 GPa to 80 GPa, the crystal structure is in an intermediate phase between two stable phases. At pressure 40 GPa, the fcc structure becomes unstable, the intermediate phase emerges from fcc phase by phonon softening. At pressure 70-80 GPa, the electron-phonon interaction reaches to the maximum. The intermediate phase becomes unstable and a new phase form by a phase transition. The big jump of resistivity of normal state (25K) at about 80 GPa just shows a real phase-transition [13]. The Tc monotonously increases with pressure from 40 to 75 GPa in our calculations, which is different from keeping around 16K in experiment [5]. The discrepancy is probably because the stable structure is the c/16 phase and not the fcc structure used in our calculation. When pressure increases to higher than 80 GPa, Tc decreases with pressure which is consistent with experiments. Although the fcc structure is kept unchanged from low to high pressure, our results still hint possible structural transitions of metal Li at corresponding experimental pressures. This means that the interactions of atomic orbits between nearest-nearby atoms plays more important role than the formation of super-structure of crystal with increasing pressure.
The pressure-dependent Tc of metal Li is very similar to superconducting niobium nitride (NbN). The observed high-pressure effect on Tc is explained as the pressure-induced interplay of electronic stiffness and phonon frequency [35]. In this paper, the high-pressure effect on Li is explained as the changes of role between electron-phonon interaction and phonon energy when pressure increase as illustrated in Fig.5(c). In low-pressure region, increasing Tc with pressure is induced by the increasing . In high-pressure (80Gpa) region, decreasing Tc with pressure is induced by softening of phonon modes.

6 The electron-phonon interaction of element metals under pressure
The superconductors collected on Tc map in Fig.4 can be divided into two groups: (1) metals La and Li; (2) metals Pb, Al and others. The effects of high pressure are more efficiently increasing for group (1) but increasing for group (2). As discussed in Ref.[14] based on experimental Tc-pressure relations, most of simple metals are belong to above two groups. We calculate q-dependent of La, Cu and other metals at different pressures. As a comparison, we present the results of non-superconductor Cu and superconductor La. The Cu is prefect conductor and the metal La with fcc structure is well-known superconductor at ambient pressure with Tc=6 K [36]. At high pressure 20 GPa, Tc of La increases to 12.8K [36]. The electron-band, phonon-band and Eliashberg function of La had been studied in very details [20, 21].
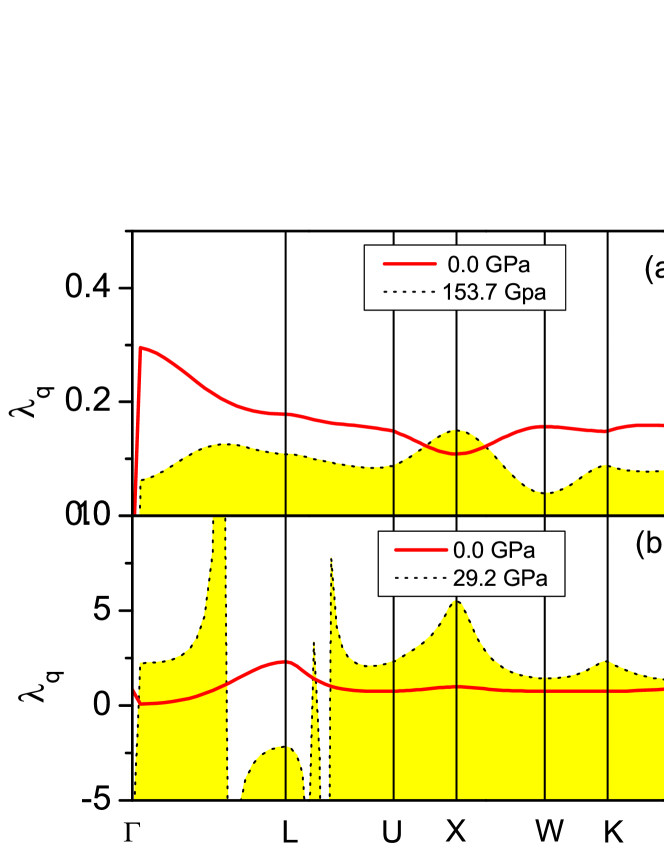
The q-dependent parameters of electron-phonon interaction generally have very large values near or at some high symmetry q-points shown in Fig.6. For metal Cu, the decreases with increasing pressure but the increases with pressure. The one exception is that near K point, of Cu increases with pressure. The increase of at high symmetry point of Brillouin zone, such as K point of fcc crystal, means that the C2v symmetry of the crystal will be possible broken if pressure increases further. The values of for metal La have maximum near high-symmetry points. Exactly at point, is hard to define due to the large numerical errors. However, main features at others points, especially the larger values of near point along line are very robust in Fig.6(b).
The phonon anomaly of fcc La at point shown in Fig.6 were found in experiment of temperature-dependent phonon dispersion [37] and theoretical calculations [21]. The soft modes especially for transverse modes (shearing instability) lead to the instability of lattice. The distances (or interactions) between planes are larger (weaker) than those along other directions. The instability of lattice structure begins with transverse gliding between planes due to smaller activation energy.
We plot the Fermi surfaces of La at low pressure and at high pressure shown in Fig.7. At low pressure there is only one sheet of Fermi surface with rather complex topology. The electrons occupy around the boundaries except that near the center region of eight hexagons and the 24 vertexes. When the pressure increases to 29.2 GPa, the topology of Fermi surface has significant changes. A group of very small Fermi-surface packets appear near the middle of lines but they aren’t displayed in Fig.7 due to very small sizes. The occupations of electrons near regions of eight hexagons have large reductions, especially near 36 edges. This means that the electronic states at the edges of Brillouin zone are electron-like states at low pressure and hole-like states at high pressure. The large reconstruction of Fermi surface for La will lead to the structural transition between different phases. For metal Cu, the increasing pressure only generates very small changes of lattice constant. So its electron-like Fermi surface has very small change at high pressure (153.7 GPa) shown in Fig.7 with the well-known shape of Fermi surface at ambient pressure.
The high-symmetry points of Brillouin zone characterize the long-range orders of crystal structure determined by space-group symmetries. The electrons with wave vectors near high symmetrical points, line and boundaries of Brillouion zone have potentially strong interactions with lattice vibrations. The main contributions to come from the parts of Fermi surface contacted with boundaries of Brillouion zone. This is why noble metals have very small and metal La, Pb and Hg have very larger . Thus, the structural phase transition will lead to the sharp increases of with increasing pressure for metal La.
7 conclusion
In summary, we have calculated Tc map in the region of weak electron-phonon coupling. The threshold effect of is found in small region. It origins from the competition between electron-phonon interaction and electron-electron Coulomb interaction when is comparable with . The threshold effect of can explain why noble metals are not superconductors even at high pressure and why Tc of most of simple metals are higher than 0.1K. The phonon spectra and Eliashberg functions have been calculated by using linear response method in the framework of density functional theory. The obtained Eliashberg functions are then used in the calculations of strong-coupling theory. Our calculations illustrate how the superconducting parameters of simple metals distribute on the Tc map and how they run on the map with increasing pressure. Our results explain the pressure-dependent Tc of metal Li at high pressure ( 80GPa ). Thus the Tc maps studied in this paper and in previous papers [3] are very useful tools for studying the superconductivity of simple metals and hopefully extend to other types of superconductors.
8 Acknowledgements
The Fermi surfaces are plotted using XCrySden software. Zeng was supported by the special Funds for Major State Basic Research Project of China (973) under Grant 2007CB925004 and Zou by the National Science Foundation of China under Grant 10874186.
References
- [1] P. B. Allen and R. C. Dynes, Phys. Rev. B12 (1975), 905.
- [2] W. L. McMillan, Phys. Rev. 167 (1968), 331.
- [3] W. Fan, Physica C 469 (2009), 177; W. Fan, Chinese Physics Letter, 25 (2008), 2217.
- [4] K. Shimizu, H. Kimura, D. Takao, and K. Amaya, Nature (London) 419 (2002), 597.
- [5] V. V. Struzhkin, M. I. Eremets, W. Gan, H. K. Mao, R. J. Hemley, Science 298 (2002), 1213.
- [6] V. V. Struzhkin, R. J. Hemley, H. K. Mao and Y. A. Timofeev, Nature (London) 390 (1997), 382.
- [7] K. Shimizu, K. Suhara, M. Ikumo, M. I. Eremets, and K. Amaya, Nature (London) 393 (1998), 767.
- [8] E. A. Ekimov, V. A. Sidorov, E. D. Bauer, N. N. Mel’nik, N. J. Curro, J. D. Thompson, and S. M. Stishov, Nature (London) 428 (2004), 542.
- [9] K. Shimizu, T. Kimura, S. Furomoto, K. Takeda, K. Kontani, Y. Onuki, and K. Amaya, Nature (London) 412 (2001), 316.
- [10] T. Yabuuchi, T. Matsuoka, Y. Nakemoto, K. Shimizu, J. Phys. Soc. Japan 75 (2006), 083703.
- [11] J. J. Hamlin, V. G. Tissen, and J. S. Schilling, Phys. Rev. B 73 (2006), 094522.
- [12] Y. M. Ma, M. Eremets, A. R. Oganov, Y. Xie,I. Trojan, S. Medvedev, A. O. Lyakhov, M. Valle, and V. Prakapenka, Nature (London) 458 (2009), 182.
- [13] T. Matsuoka, and K. Shimizu, Nature (London) 458 (2009), 186.
- [14] C. Buzea, and K. Robbie, Supercond. Sci. Technol. 18 (2005), R1-R8.
- [15] S. Y. Savrasov, D. Y. Savrasov, Phys. Rev. B 54 (1996), 16487.
- [16] S. K. Bose, J. Phys.: Condens. Matter 21 (2009), 025602.
- [17] D. Kasinathan, J. Kuneš, A. Lazicki, H. Rosner, C. S. Yoo, R. T. Scalettar, and W. E. Pickett, Phys. Rev. Lett. 96 (2006), 047004.
- [18] N. E. Christensen, and D. L. Novikov, Phys. Rev. B 73 (2006), 224508.
- [19] Z. P. Yin, S. Y. Savrasov, and W. E. Pickett, Phys. Rev. B 74 (2006), 094519.
- [20] W. E. Pickett, A. J. Freeman, and D. D. Koelling, Phys. Rev. B 22 (1980), 2695.
- [21] H. M. Tütüncü, and G. P. Srivastava, Journal of Applied Physics 104 (2008), 063916.
- [22] H. S. Wu, J. H. Cai, C. D. Gong, G. D. Ji, J. D. Cai, Acta Physica Sinica 26 (1977), 509. (in Chinese)
- [23] C. D. Gong, H. S. Wu, J. H. Cai, J. D. Cai, and G. D. Ji, Acta Physica Sinica 27 (1978), 85. (in Chinese)
- [24] H. S. Wu, Z. Y. Weng, G. D. Ji, Z. F. Zhou, J. Phys. Chem. Solids 48 (1987), 395.
- [25] Quantum-ESPRESSO is a community project for high-quality quantum-simulation software, based on density-functional theory, and coordinated by Paolo Giannozzi. See http://www.quantum-espresso.org and http://www.pwscf.org.
- [26] P. B. Allen and B. Mitrovic, in Solid State Physics Vol 37, (1982) 1, edited by F. Seitz and D. Turnbull (Academic, New York).
- [27] J. P. Perdew, K. Burke and M. Ernzerhof, Phys. Rev. Lett.77 (1996), 3865.
- [28] B. Stritzker, Phys. Rev. Lett. 41 (1979), 1769.
- [29] A. Schindler, R. König, T. Herrmannsdörfer, H. F. Braun, G. Eska, D. Günther, M. Meissner, M. Mertig, R. Wahl, W. Pompe, Physica B 329-333 (2003), 1427.
- [30] R. Bauer, A. Schmid, P. Pavone, D. Strauch, Phys. Rev. B 57 (1997) , 11276.
- [31] W. Fan, to appear in International Journal of Modern Physics B; preprint 2008, arXiv:0811.3813.
- [32] X. J. Chen, H. Zhang, and H. -U. Habermeier, Phys. Rev. B 65 (2002), 144514.
- [33] D. U. Gubser, and A. W. Webb, Phys. Rev. Lett. 35 (1975), 104.
- [34] G. Profeta, C. Franchini, N. N. Lathiotakis, A. Floris, A. Sanna, M. A. L. Marques, M. Lüders, S. Massidda, E. K. U. Gross, and A. Continenza, Phys. Rev. Lett. 96 (2006), 047003.
- [35] X. J. Chen, V. V. Struzhkin, Z. G. Zhu, R. E. Cohen, S. Kung, H. K. Mao, R. J. Hemley, and A. N. Christensen, Phy. Rev. B 72 (2005), 094514.
- [36] M. B. Maple, J. Wittig, and K. S. Kim, Phys. Rev. Lett. 23 (1969), 1375.
- [37] C. Stassis, C. -K. Loong, and J. Zarestky, Phys. Rev. B 26 (1982), 5426.