Re-assessing the radial-velocity evidence for planets around CoRoT-7
Abstract
CoRoT-7 is an magnitude K-star whose light curve shows transits with depth of 0.3 mmag and a period of d, superimposed on variability at the 1% level, due to the modulation of evolving active regions with the star’s 23 d rotation period. In this paper, we revisit the published HARPS radial velocity measurements of the object, which were previously used to estimate the companion mass, but have been the subject of ongoing debate.
We build a realistic model of the star’s activity during the HARPS observations, by fitting simultaneously the line width (as measured by the width of the cross-correlation function) and the line bisector, and use it to evaluate the contribution of activity to the RV variations. The data show clear evidence of errors above the level of the formal uncertainties, which are accounted for neither by activity, nor by any plausible planet model, and which increase rapidly with decreasing signal-to-noise of the spectra. We cite evidence of similar systematics in mid-SNR spectra of other targets obtained with HARPS and other high-precision RV spectrographs, and discuss possible sources. Allowing for these, we re-evaluate the semi-amplitude of the CoRoT-7b signal, finding m s-1, a tentative detection with a much reduced significance (1.2-sigma) compared to previous estimates. We also argue that the combined presence of activity and additional errors preclude a meaningful search for additional low-mass companions, despite previous claims to the contrary.
Taken at face value, our analysis points to a lower density for CoRoT-7b, the mass range spanning –, and allowing for a wide range of bulk compositions. In particular, an ice-rich composition is compatible with the RV constraints. More generally, this study highlights the importance of a realistic treatment of both activity and uncertainties, particularly in the medium signal-to-noise ratio regime, which applies to most small planet candidates from CoRoT and Kepler.
keywords:
planetary systems.1 Introduction
First of a kind
CoRoT-7 is an active K-dwarf which was monitored photometrically for 5 months in 2007–2008 as part of the exoplanet programme of the CoRoT space mission (Baglin, 2003). Following the routine analysis of the data to search for planetary transits, Léger et al. (2009, hereafter L09) reported the detection, in CoRoT-7’s light curve, of eclipses with a depth of 0.3 mmag and a period d, superimposed on significant (1.8% peak-to-peak) activity-induced stellar variability. They also carried out ground-based photometric follow-up and obtained near-infrared spectra, which ruled out the majority of the alternative binary scenarios that could have given rise to the observed transits (grazing or diluted eclipsing systems with a stellar, sub-stellar or giant planet companion). They therefore interpreted the eclipses as most likely to be caused by a planetary companion, dubbed CoRoT-7b, with a radius of . The accompanying radial velocity (RV) follow-up campaign, carried out with the HARPS spectrograph, was reported in Queloz et al. (2009, hereafter Q09). The RV signal of CoRoT-7 was dominated by strong (40 m s-1 peak-to-peak) activity-induced variations. Q09 nonetheless derived a radial velocity semi-amplitude of m s-1, corresponding to a mass . They also reported the detection of another (non-transiting) planet in the system, CoRoT-7c, with period d, semi-amplitude m s-1, and mass .
Optimistic pre-launch estimates of CoRoT’s detection capabilities had forecast the detection of hundreds of transiting planets, with masses between that of Neptune and twice that of the Earth (see e.g. Bordé et al., 2003). However, prior to CoRoT-7b, all the planets that CoRoT discovered were gas giants. The smallest transiting planet known was the Neptune-mass GJ 436b (Gillon et al., 2007), whose transits were detected from the ground after it was discovered by radial velocities. Thus, the discovery of CoRoT-7b was an important confirmation that space-based transit surveys could indeed detect planets in this regime. It should be noted that CoRoT-7 was a particularly favourable target: it is one of the brightest targets ever monitored as part of CoRoT’s exoplanet programme (), and the precision of its CoRoT light curve is photon-noise limited on the 2-h timescales typical of short-period transits (Aigrain et al., 2009), despite significant variability on longer time-scales.
A handful of new low-mass transiting planets have since been detected: GJ 1214 b, another ‘Super-Earth’, by the ground-based MEarth project (Charbonneau et al., 2009), and two ‘hot Neptunes’, Kepler-4b (Borucki et al., 2010) and HAT-P-11b (Bakos et al., 2010). However, such objects remain scarce and their potential to constrain formation and evolution scenarios unique. As a result, the CoRoT-7b system has already been the subject of a number of theoretical studies. The mass and radius of CoRoT-7b, as reported by Q09, point to a predominantly rocky composition (Valencia et al., 2010; Barnes et al., 2010), albeit with significant degeneracy (Rogers & Seager, 2010). This is in stark contrast to GJ 1214b, whose lower density indicates a significant H2O content and/or H/He envelope (Charbonneau et al., 2009), and it raises interesting questions about CoRoT-7b’s origin (Jackson et al., 2009; Jackson et al., 2010). Dvorak et al. (2010) also investigated the dynamics of the two-planet system reported by Q09, pointing out signatures of possible interactions between the two planets which may be observable in the medium term. All of these studies depend critically on the assumed parameters of the planet(s) and host star.
The scientific importance of this object, and the extremely challenging nature of the observations, have naturally prompted a number of teams to re-analyse the HARPS RV data presented in Q09. Far from clarifying the situation however, these efforts appear to be leading to an even more confused picture. Before summarising them, it is helpful to summarise briefly the methodology of Q09.
Previous analyses
Q09 first analysed the RV data using a pre-whitening procedure, successively fitting and subtracting sinusoids at the period corresponding to the highest peak in a Lomb-Scargle periodogram. They attributed the first three peaks, at 23.5, 9.03 and 10.6 d, to activity, on the basis that they are close to the rotation period of the star (determined to be d from the CoRoT photometry) or one of its first few harmonics. The fourth peak is not obviously related to , and they attributed it to a planet which does not transit (CoRoT-7c). Finally, the fifth peak was found at the one-day alias of the period of CoRoT-7b (though it should also be noted that this corresponds almost exactly to the third harmonic of the stellar rotation period, ). In support of the planetary origin of this signal, Q09 point out that its phase is consistent with the CoRoT ephemeris. As an alternative to the pre-whitening procedure, they also modelled the activity signal by fitting a sum of three sinusoids at , and to the data. Because the active regions evolve rapidly (this is manifested both in the light curve and in the RV data itself, whose scatter changes significantly from observing run to observing run), this ‘3-harmonic filter’ was adjusted using a sliding window of duration d, which effectively introduces many more degrees of freedom to the fitting process. In both cases, they later fit a two-planet Keplerian model to the residuals, fixing the period and phase of the transiting planet to the CoRoT ephemeris. Having established that both filtering procedures could reduce the amplitude of a putative planetary signal at the period of CoRoT-7b by as much as 50%, they corrected for this by multiplying the amplitude derived from the filtered data by a factor two. Finally, they averaged the results of the two approaches to obtain a final semi-amplitude for each planet, but adopted final uncertainties which are smaller than those derived from either method. This implicitly assumes that the two approaches give independent estimates of the semi-amplitudes, which is not the case.
Hatzes et al. (2010) re-analysed the HARPS radial velocity (RV) data using a pre-whitening procedure similar to that of Q09, finding results marginally consistent with Q09 for the masses of CoRoT-7b and c, but interpreting the signal at 9.03 d as being due to a third planet. This interpretation was not supported by Lanza et al. (2010), who modelled the host star’s activity by fitting a spot model to the CoRoT light curve, finding evidence for significant differential rotation. The signal at 9.03 d is then readily interpreted as the second harmonic of the rotation period. Lanza et al. (2010) also simulated the activity-induced RV signal corresponding to their best-fit spot model, which they then resampled at the sampling of the HARPS observations. They used multiple realisations of these simulated time-series to confirm that the ‘3-harmonic’ filter of Q09 adequately removes most of the activity signal (though it would be surprising if it did not, given its large number of free parameters), and to put upper limits of and m s-1 on the activity-induced signal which survives the 3-harmonic filter at the periods of CoRoT-7b and c respectively. However, the CoRoT and HARPS observations were not simultaneous but separated by one year. Given the rapid evolution of the active regions on CoRoT-7, one cannot be certain that the RV time-series simulated by Lanza et al. is representative of the real activity signal at the time of the HARPS observations.
Bruntt et al. (2010) also re-determined the fundamental parameters of the host star CoRoT-7 by re-analysing the HARPS spectra of Q09, and re-fit the CoRoT light curve using the updated stellar parameters, resulting in a slightly smaller radius estimate for CoRoT-7b, as well as smaller formal errors (), which exacerbates the apparent discrepancy between the compositions of CoRoT-7b and GJ 1214b.
Our approach
The goal of this paper is to re-assess the mass constraints on the CoRoT-7 planet(s), with some key differences to previous studies with similar goals.
First, we make use of all available information in our analysis. The data derived from the HARPS spectra consist not only of radial velocities, but other parameters derived from the cross-correlation function (CCF), particularly the bisector span and the full-width at half-maximum (FWHM), of the CCF. Both are activity diagnostics: rotating spots affect the wings of the spectral lines and hence modify the bisector (Boisse et al., 2009, hereafter B09), and the FWHM because it is a diagnostic of the stellar photospheric temperature (Santos et al., 2002), which is affected by changes in the spotted fraction of the stellar disk (since the total luminosity and radius are constant). Q09 discussed those indicators, as well as the Ca ii H & K chromospheric activity index, but did not directly use them. Yet any realistic model for the activity-induced RV variations must also account for the behaviour of these parameters.
Second, we avoid the use of pre-whitening and harmonic filtering techniques. The sampling of the HARPS data is very irregular, consisting of some isolated points, some runs of a week or so with one point per night, and some more intensive runs with up to three points per night, spanning more than four months in total. The unique decomposition of arbitrary functions into sines and cosines, which forms the basis for Fourier analysis and techniques such as pre-whitening, does not apply to very irregularly sampled data, when sines and cosines no longer form an orthogonal basis. Filtering out specific frequencies in the CoRoT-7 HARPS data unavoidably affects other frequencies, including those corresponding to the planetary orbital periods of interest, and it is extremely difficult to quantify the uncertainty in the final semi-amplitudes. This is particularly acute in the case of CoRoT-7b, whose orbital period (or rather its alias, since the period itself is above the approximate Nyquist limit of the observations) is very close to the third harmonic of the stellar rotation period. Furthermore, the typical lifetimes of active regions on Sun-like stars are comparable with their rotation periods (typically –, Mosser et al. 2009). As a result, the frequency content of the activity is highly complex, implying that pre-whitening or harmonic filters must either be extended to a large number of frequencies, or be made adaptive, and in any case have a very large number of free parameters.
On the other hand, we wish to construct a realistic model of the activity of the star during the HARPS observations. Spot models can reproduce the light curves of the Sun (Lanza et al., 2003; Lanza et al., 2004) and of CoRoT active planet-host stars (Mosser et al., 2009; Lanza et al., 2009; Lanza et al., 2010) to a high degree of accuracy, as well as the RV curves of active stars (see e.g. Bonfils et al., 2007, B09). In spite of this success, those models suffer from strong degeneracies between, for example, the contrast, size and number of spots and facular areas. More recently, spot models built from solar magnetograms were used to produce forward models of the photometric and RV variations of the Sun, which are in excellent agreement with the observations (Lagrange et al., 2010; Meunier et al., 010a, 010b). However, in the case of CoRoT-7, we have already seen that the CoRoT light curve is of limited use because it is not simultaneous with the RV data. Instead, we build our activity model from the HARPS data itself, using the CCF FWHM as a photometric proxy. Q09 demonstrated a very tight correlation between the FWHM and photometry obtained simultaneously with the 1.2m Euler telescope, though they did not use it directly in their analysis. We model this proxy photometry using large numbers of spots, with minimal assumptions on their properties. Because of the inherent degeneracies in spot models, it is standard practice to limit the number of spots to a few, but typical CoRoT light curves are more representative, in a statistical sense, of many-spot models (see Aigrain et al. in prep.). Following a maximum entropy logic, we use multiple realisations which fit the data well to account for, rather than attempt to circumvent, the degeneracy inherent in many-spot models.
Finally, we also consider the possibility of systematics in the RV data, i.e. of noise not accounted for by the formal errors. HARPS is optimized and calibrated primarily for ultra-high precision RV monitoring of very bright () stars, and its stability down to the m s-1 level is well established in that magnitude range (see e.g. Mayor et al., 2009). On the other hand, the HARPS uncertainties become significantly larger, and highly dependent on factors such as moonlight and weather, for faint stars, as seen during the follow-up of OGLE transit candidates (Bouchy et al., 2005). As we will discuss in Section 3, this trend is seen at low signal-to-noise ratio across a wide range of target types and instruments. At , CoRoT-7 falls in the intermediate SNR regime for HARPS, and the possibility of systematics should at least be considered.
2 The activity signal
Characteristics of activity-induced signals
Stellar activity induces photometric variations, primarily via the rotational modulation of dark spots on its surface. Although there are exceptions, these star spots typically have lifetimes on the scale of one to a few stellar rotation periods (Mosser et al., 2009). As a result, the lightcurves of active stars are often highly complex, although they usually display some periodicity at the rotation period or a low-order multiple thereof.
Star spots also have an effect on RV measurements. The first-order effect is due to the spots occulting either the receding or approaching half of the visible hemisphere, thus modifying the shape of the spectral lines and causing a shift in the apparent disk-averaged RV. The difference in temperature and convective upwelling velocity between the spots and the rest of the surface of the star also has an effect, which will depend on the wavelength range used to measure the RVs, and the spectral lines included in the measurement. Again, the activity-induced RV ‘jitter’, as it has come to be known, can be very complex and hard to interpret, partly because of spot evolution and partly because of the irregular time sampling of ground-based RV data.
Aside from the Sun, one of the stars with the best studied RV jitter is HD 189733, which was the target of intensive simultaneous photometric and RV monitoring, with the MOST satellite and SOPHIE instrument respectively (B09). Like CoRoT-7, HD 189733 is an active K-dwarf with a close-in planetary companion, although the star is much brighter and the planet much more massive. B09 showed that simple models of the rotational modulation of dark spots account for most of the observed photometric and RV variations of HD 189733 (once the planetary signal is removed), as well as for other activity diagnostics such as the CCF bisector span and emission in the cores of the Ca ii H & K and H lines. The bisector span, which measures the mean RV offset between the core and the wings of spectral lines, appears to be a particularly robust jitter indicator. B09 used the correlation between RV and bisector span to correct the SOPHIE RV time-series of HD 189733 for the effects of activity down to the m s-1 level, at which point the RV data became limited by instrumental systematics.
We have undertaken an investigation of stellar activity in the CoRoT light curves, which will form the subject of a forthcoming paper (Aigrain et al. in prep.). One point from that study which is particularly relevant to the present work is the fact that typical CoRoT light curves are better described by models including many spots (–) than a few (–). Few-spot models can reproduce specific cases, but in general they tend to predict time intervals of near-constant flux, corresponding to times when no large spot is present on the visible hemisphere. Such intervals are almost completely absent from the CoRoT light curves, which suggests that, as in the case of the Sun111See monthly average sunspot numbers as tabulated by the Solar Influences Data Analysis Center, http://www.sidc.oma.be., the surfaces of Sun-like stars may be peppered with tens to hundreds of small spots, rather than a few large ones.
Activity modelling for CoRoT-7
Activity of CoRoT-7
The CoRoT lightcurve of CoRoT-7 shows variability at the percent level, with a rotation period of days, and rapidly-evolving activity features (no feature is reproduced unchanged after one rotation period, and the lightcurve becomes unrecognisable after merely 2–3 periods). The RV data reported in Q09 show variations at the 20 m s-1 level. The dominant periodicity changes from run to run between , and , which again implies rapid evolution of the activity features. Similar variations are observed in the accompanying activity indicators (bisector span and Ca ii H & K index), although they are more sensitive to measurement errors.
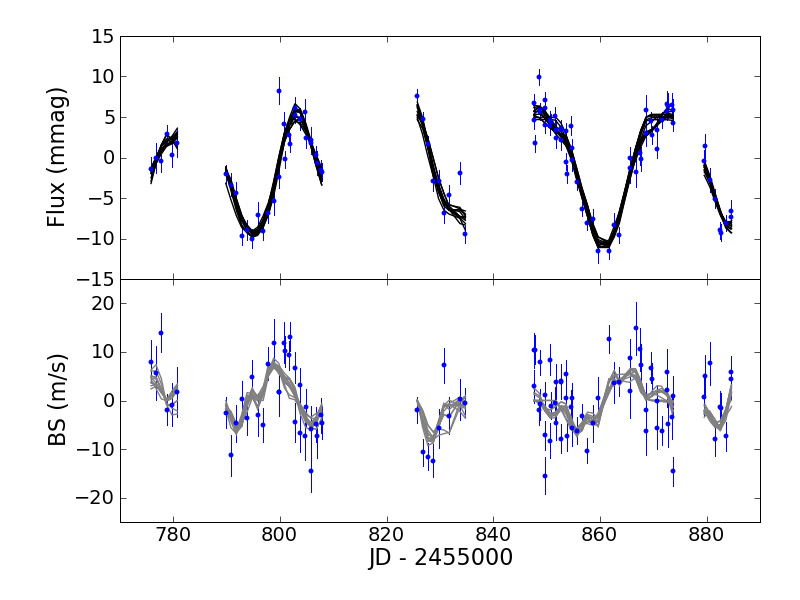
We do not have direct observations of the photometric variability of CoRoT-7 at the time of the HARPS observations. However, Q09 demonstrated the existence of a tight, linear correlation between the HARPS CCF FWHM and simultaneous photometry obtained with the Euler 1.2-m telescope. This correlation implies that the FWHM can be used to reconstruct the brightness variations to a very impressive precision, 0.1% or better. We thus used the FWHM data and conversion relation from Q09 to reconstruct the light curve of CoRoT-7 during the HARPS observations. The results are shown in the top panels of Figures 1 and 2, alongside the RV and bisector span data which were directly taken from Q09. The amplitude and dominant periodicity of the variations in the reconstructed light curve are similar to those observed by CoRoT nearly a year earlier, although the variations are more sustained in the former. The RV data clearly show significantly more variability on timescales of a few days and below than either the proxy photometry or the CoRoT light curve.
Q09 did not directly make use of this proxy photometry. However, it is very constraining. Any self-consistent model for the RV variations in terms of activity plus planetary signals must also account for the FWHM and bisector span variation. Adaptive harmonic or pre-whitening filters such as those used by Q09 and Hatzes et al. (2010) can readily account for rapid RV variations, but unless those coincide with corresponding features in the proxy photometry or bisector span data, they cannot safely be assumed to be due to activity.
Our rotating time-evolving spot model
We model the activity signal with a set of spots, each characterised by a scale factor , which is equal to the fraction of the stellar flux it would ‘hide’ if it were at the centre of the stellar disk. To allow for spot evolution, the scale factor varies with time according to a Gaussian function (to account for growth and decay of the spot area). The Gaussian function is parameterised by the peak intensity , peak epoch , and lifetime (the half-width at half-maximum of the Gaussian). Each spot has longitude , and rotates with the surface of the star. The effect of the spots on the stellar brightness, RV and bisector span is simulated using a simple analytical model described in Aigrain et al. (in prep.). Although we treat each spot as point-like, the effect of large active regions can be readily reproduced with several spots close together. We use a linear limb-darkening law with (e.g. Sing, 2010), and assume that the star’s equator coincides with the line of sight. The effects of faculae and convective blueshift are not included222the good agreement of predicted and observed bisector information suggest that the spot shading effect is dominant..
We use the proxy photometry, and optionally the bisector span data, to constrain the spot parameters, and predict the activity-induced variations in bisector span (if not used to constrain the fit) and RV. The spot parameters , , , and , are set at random at the beginning of each realisation, and a fit to the data is found by gradient minimisation of the statistic. The number of spots can vary between 3 and 200 (but is kept fixed for any given realisation). and are free to vary linearly, and and logarithmically. We allow a certain amount of differential rotation, leaving each spot to have its own rotation period , where is the equatorial rotation period. This differential rotation is constrained by adding a penalty term to the .
For each value of , there are many possible realisations that are compatible with the data. There is generally a value of below which the actual lightcurve cannot be reproduced within the uncertainties, and a value above which adding new spots does not make a visible difference. We find that in the case of CoRoT-7, spot numbers between 12 and 20 reproduce the light-curve within the uncertainties. With less than 6 spots, flat spot-free regions are left in the model light-curve that are not visible in the reconstructed one. We run the downhill minimisation for steps, and accept the fit if the residuals are lower than twice the adopted values of and . By varying the initial parameters for the spots and running many realisations, we aim to explore the most likely regions in parameter space. This approach contrasts with models using a low number of large spots, which are finding only one possible inversion of the data, and is similar in spirit to the maximum-entropy reconstruction method used for instance in Lanza et al. (2010). We verify that the values of and include not only random noise but also the uncertainties in the modelling procedure, so that the model will not tend to use additional spots to over-fit the observed light-curve and bisector data.
Based on the spot configuration, the photometric signal is easily obtained through a simple integration of the flux over the visible hemisphere. The RV and bisector signals are a little more complex and are obtained through an integration which takes into account the Doppler shift of each point of the visible stellar surface (e.g. Dall et al., 2006)333The correlation between the RV signal and the bisector variation can be used as a first-order correction to the RV data (Boisse et al., 2009). However, the relation between RV and bisector is not tight: a large spot close to the centre of the stellar disc has the same RV effect as a small spot close to the edge but a very different bisector signature. As a result the RV-bisector correlation will be complex (e.g. Santos et al., 2000, 2003) and a more sophisticated model of the variability is desirable when attempting to study a signal of lower amplitude than the activity signal..
Results
To test the suitability of the model, we first fit the light curve data only and use it to predict the bisector span variations. Fig. 1 shows the results of ten representative realisations, with varying from 12 to 200, days and set to 5%. The agreement with the observed bisector span variations is remarkable. This indicates that the spot model is essentially adequate, and that the effects which we neglected (faculae and convective blueshift) are of secondary importance. A few detailed features vary from one model to the next, but overall all realisations with similar goodness of fit give essentially identical photometric and bisector span variations, regardless of . In other words, one should not read too much into the individual spot parameters of each model, but the predictions in terms of photometric and spectroscopic variations are very robust, particularly over the stretches with relatively tight and regular sampling.
We also estimated the variations in Ca ii H & K expected for a given spot model. We take the expected strength of the Ca ii H & K signal to be proportional to the visible spot surface. We find this indicator to be compatible with the flux and bisector data, but significantly noisier. As a result, the comparison does not add much in the way of constraining information, and it is not included in the rest of the analysis.
Predicting the activity-induced RV variations
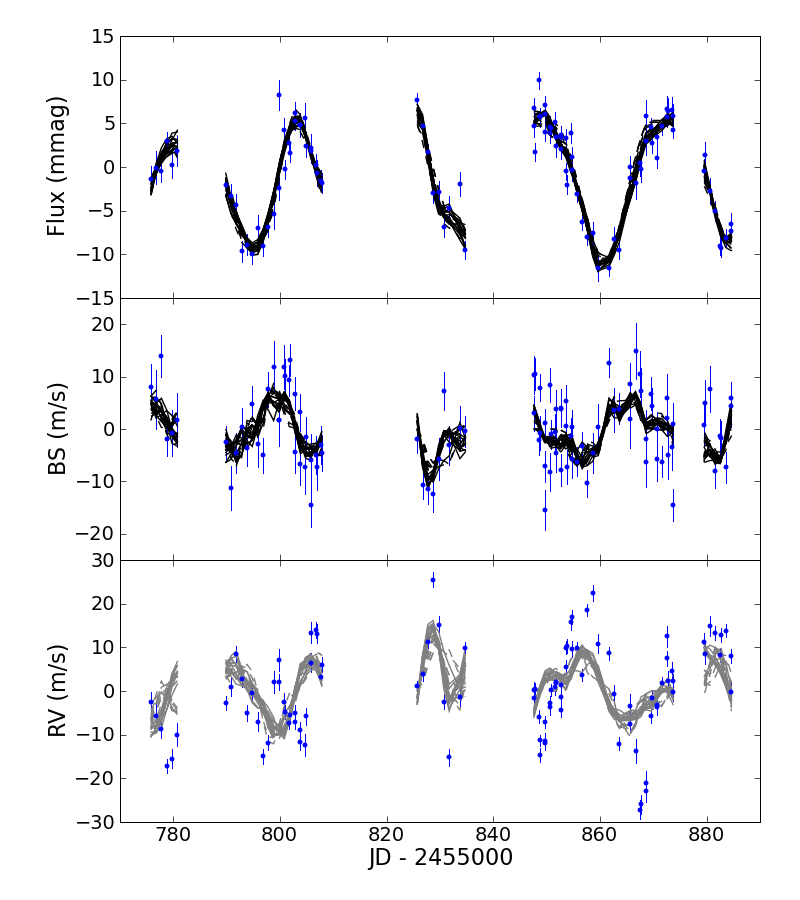
We repeated the fits using both the proxy light curve and the bisector span data to constrain the spot model, and predicted the corresponding RV variations for each realisation. To do this, one must define a relative weight between the photometry and bisector span data. We used inverse variance weighting with % for the light curve and m s-1 for the line bisector as the default values, as well as days and =1.2 days. The values of and were chosen to reflect the level at which we believe the spot model can be regarded as accurate. We explored the effects of varying these assumptions by computing solutions with from 22.0 to 25.0 days, %, and without using the bisector information.
Figure 2 shows the result of 14 different realisations, covering a wide range of and spot parameters, with the corresponding RV predictions. There are always multiple good fits to the light curve and bisector data, whatever the value of and the relative weighting given to the two constraining datasets. The RV predictions reproduce the overall features of the RV data quite well, showing that activity is the dominant source of RV signal for CoRoT-7. However, there are notable departures from our predictions: features in the RV data that are clearly not accounted for by any of the activity models. The question that remains to be answered is: what is the origin of these features?
3 Analysing the non-activity-induced RV signal
Residual RV features

Figure 3 shows the RV data with the median of our activity model curves subtracted. Two different colours have been used to distinguish measurements based on spectra with low and high signal-to-noise ratio (SNR). Data with SNR lower than the median are displayed in white. The bottom panels of Fig. 3 zoom in on the two most densely-covered periods, and overplots the expected planetary signal from the two-planet solution in Q09.
Figure 3 shows that the RV data contain features that cannot be accounted for by the activity signal responsible for the light curve and bisector variations, nor by the two-planet model of Q09. Of particular note are the m s-1 jumps at , 806 and 868. These jumps occur over the space of one day, with no corresponding feature in the light curve and bisector data. It is very difficult to imagine how activity could cause such a sudden change in RV without leaving a detectable signature in the photometric or bisector span data444It is of course conceivable that such an effect exists, but in that case it is indistinguishable from instrumental systematics, and effectively plays the same role, so we will treat it as such.. Since the semi-amplitude of the two putative planets is m s-1 at most, they could not produce jumps of this amplitude either, even if they were perfectly in phase with them.
Figure 3 also shows that the features in the RV residuals are strongly correlated with the SNR of the spectra. This suggests that the variations unaccounted for by activity are caused by uncertainties beyond the formal error bars, increasing with lower SNR. As discussed in the introduction and in the next section, there are reasons to believe that such uncertainties may be present in HARPS data, at the required level of m s-1 r.m.s. The SNR is principally determined by the observing conditions. Observing conditions at observatories vary strongly over one night for a given object, as the airmass changes with the apparent motion of the object in the sky, as well as on the time scale of a few days, due to ‘weather’. This is clearly a potential difficulty for planet detection, especially with irregular time sampling, and can induce apparent variability on sub-day and few-day time scales, as is observed here. If we acknowledge that instrumental systematics, or any other cause, can produce sudden RV jumps of order 20 m s-1 , we must treat with extreme caution any claims to measure the semi-amplitudes of one or more planetary companions at sub-m s-1 precisions.
Possible sources of RV systematics
As discussed in the introduction, the precision of RV measurements degrades very rapidly and non-linearly at low SNR. This statement is based on experience accumulated over the past two decades (see e.g. Pont et al., 1994, 1997; Bouchy et al., 2005; Pont et al., 2005), over a wide range of targets (from the Sun-like targets of transit surveys such as OGLE, SuperWASP, HATnet and CoRoT to Galactic Cepheids and extra-galactic red giants) and instruments (CORAVEL, ELODIE and SOPHIE on the Observatoire de Haute Provence 1.93-m telescope, EMMI on the New Technology Telescope and HARPS on the La Silla Observatory 3.6-m telescope, and UVES on the Very Large Telescope). Other groups report similar experiences with the same or other instruments (VLT/UVES follow-up of SWEEPS candidates, Sahu et al. 2006, Keck/HIRES follow-up of transiting planets, M. Endl, J. Winn, priv. comm.). In all cases, the RV precision drops with decreasing SNR significantly faster than expected from photon noise and errors in the wavelength calibration alone, or from increased errors in fibre positioning for faint stars. For example, RV residuals for SOPHIE RVs typically depart from photon-noise expectations below , and uncertainties at the level of 100 m s-1 or more appear when .
If one wishes to speculate about the possible causes of this phenomenon, the most promising direction might be detector and background effects. The SNR that is typically quoted is the SNR per pixel at the centre of the central order in the echelle spectra used to derive the RVs. However, the SNR varies strongly from order to order, because the stellar continuum, the CCD response and the spectrograph throughput are all strongly wavelength dependent. This typically results in SNRs which are an order of magnitude lower in the blue half of the spectrum than in the red, particularly for the relatively cool targets of typical planet searches. As the overall SNR decreases, the signal in the blue half of the spectrum approaches the level of the various detector noise sources more rapidly than that in the red half of the spectrum. This has a disproportionate effect on the RV uncertainty because most of the thin metallic lines used to compute CCFs for solar-type stars are in the blue part of the spectrum. A 1 m s-1 RV accuracy corresponds to a displacement of the order of a thousandth of a CCD pixel. The wavelength calibration for individual lines is far from this accuracy, which can only be reached by combining – effectively, averaging over – thousands of lines. At low SNR, the weighing of this average is modified, resulting in non-random radial velocity offsets. Another source of non-random radial velocity uncertainty is the presence of background light around the object, particularly when due to diffused moonlight (see e.g. Pepe & Lovis, 2008). This is a well-known source of offsets in radial-velocity measurements for faint objects, and can be difficult to identify and correct at low contamination levels.
The case of HARPS
HARPS is optimized to obtain extremely precise radial velocities from high-SNR spectra, and it is mainly used in that mode, to search for low-mass planets around relatively bright stars (typically ). Assessing the possible amplitude of instrumental uncertainties at lower SNR is difficult, because such data is relatively sparse. However, HARPS was used for the brightest transit candidates of the OGLE transit survey, at (Bouchy et al., 2005), as well as part of the CoRoT and SuperWASP follow-up efforts ( and respectively). The data are currently public only for confirmed planets.
Among these, a few cases are of particular interest. The planetary nature of the transiting companion to CoRoT-1 () was established with SOPHIE (Barge et al., 2008), but relatively low-SNR HARPS spectra were later acquired to measure the spectroscopic transit (SNR=9–12) and these show residuals significantly larger than the formal uncertainties (unpublished CoRoT mission follow-up data), up to 40 m s-1 . CoRoT-5 and CoRoT-4 (=14.0 and 13.7) were also observed with HARPS (Moutou et al., 2008; Rauer et al., 2009) with SNRs of 50–60 in the red half of the spectrum and 40–15 in the red and blue halves of the spectra, respectively. The residual r.m.s. around the best-fit planet models are 10 m s-1 and 18 m s-1 respectively. WASP-6 is the only SuperWASP case with a sufficient number of published measurements to study the issue555Only 6 HARPS measurements are available for WASP-22, at . They are almost perfectly fitted by the best-fit planet model (r.m.s. 4 m s-1 ), but little can be read into this, given the that there are almost as few data points as degrees of freedom of the fit. (Gillon et al., 2009). Its -magnitude is V=11.9, similar to that of CoRoT-7. The HARPS measurements for WASP-6 have a residual r.m.s. of 12 m s-1 around the best-fit planet solution, while the mean formal uncertainty is 7 m s-1 , indicating an unknown source of noise at the 10 m s-1 level. For some objects, the residuals could be due to an intrinsic cause, such as stellar activity. The lightcurve of CoRoT-4 shows that it is fairly active. However, there is no sign of significant activity in either the spectroscopic indicators or photometric monitoring of WASP-6, CoRoT-1 and CoRoT-5.
On the whole, there is a mounting body of evidence that unexplained variations at the 5–10 m s-1 level may exist in HARPS RVs for targets in the brightness range of CoRoT-7. Until their origin can be explained, the only safe course of action is to work on the assumption that the CoRoT-7 data itself may contain systematics at a similar level.
We now examine the CoRoT-7 HARPS data for possible systematics in more detail. One line of evidence in that direction comes from the bisector span data. As shown in Figs. 1 and 2, these data are entirely compatible with our simple spot model in its overall evolution. However, contrarily to proxy photometry derived from the CCF FWHM, the bisector span data display a point-to-point random variation that is clearly larger than their uncertainties. The bisector span is measured by comparing the radial velocity at the top and the bottom of the CCF: its uncertainties are thus related to the RV uncertainties in a rather straightforward way. On bright targets, the bisector span uncertainty is expected – and shown – to be about twice the RV uncertainty. In the case of CoRoT-7, the scatter of the bisector span about the best-fit activity models is significantly larger than twice the formal RV uncertainty, suggesting that the latter are underestimated.
Finally, we look at the RV data themselves. The calculation of the formal uncertainties assumes that the RV errors scale linearly with the inverse of the spectrum SNR (Bouchy et al., 2001). On the other hand, we suspect that the dependency of the errors on the SNR is stronger than linear. To test this, we divided the RV residuals shown in Fig. 3 by the SNR of the corresponding spectra. The scatter of the lower-SNR data points is significantly larger than that of the high-SNR points, by a much larger amount than indicated by the formal error bars. The same holds for the residuals relative to the mean. This observation clearly indicates that the dependency of the uncertainties on SNR is underestimated. It can be modelled by assuming the presence of additional instrumental uncertainties with a steep dependence on SNR, at the m s-1 level near the median SNR, increasing to about m s-1 at the low end of the SNR range.
4 Evidence for and mass constraints on the planet(s)

The CoRoT-7b RV signal and its amplitude
The standard way of searching for the signature of planetary orbits in RV data is to use a Lomb-Scargle or generalized periodogram (Horne & Baliunas, 1986; Press & Rybicki, 1989; Zechmeister & Kürster, 2009). The periodogram of the HARPS RV data for CoRoT-7 is highly complex. In the course of their pre-whitening analysis, Q09 identify no less than eleven peaks, all of them highly ‘significant’ in the sense that they correspond to low formal false alarm probabilities. However, on should bear in mind that the false alarm probability expresses the probability that a given peak is due to Gaussian white noise, but neither activity nor instrumental noise are expected to be white or Gaussian. The very irregular sampling of the data also implies that one or more of the peaks may arise from signal at a single, apparently unrelated frequency. Nonetheless, the main peaks in the RV periodogram are clearly related to the signal from activity, being near the rotation period, its harmonics, and their one-day aliases. There is also a peak corresponding to the period of the transit signal detected in the CoRoT photometry, d.
Fig. 4 shows the semi-amplitude of the best-fit sinusoid at the period and phase of the photometric transit, as a function of SNR threshold, as measurements derived from low-SNR spectra are progressively discarded, starting with the lowest SNR. For the most stringent threshold (), about one third of the measurements remain. We performed this calculation with both the raw RV, and the residuals from our activity models. The stellar rotation and planetary orbital frequencies are widely separated, but the latter is close to the one-day alias of the third harmonic of the former. As a result, it is not clear a priori whether correcting for the activity signal improves the semi-amplitude measurements, or on the contrary adds noise to them.
Fortunately, the two methods give very similar results. In both cases, the measured orbital semi-amplitude depends strongly on the SNR threshold: including lower-SNR measurements favours a higher value. Low-SNR measurements are more likely to be outliers (as their formal uncertainties are underestimated), and would favour a higher amplitude for all fitted features: the higher number of measurements is offset by their poorer quality. It is therefore not clear whether the most reliable value of is the one derived from all the RV measurements, or from only the best third or half. The monotonic trend in versus SNR threshold suggests that SNR-dependent effects play a large role in the detected amplitude. Figure 5 shows the radial-velocity data corrected by one of our variability models and phased to the transit signal, together with the best-fit Keplerian orbit with and without an SNR cut.

To evaluate the effect of the steeper rise in the total uncertainty at the lower end of the SNR range, we re-calculate the constraints on in the following way: we add a new term to the radial-velocity uncertainties, with a quadratic rather than linear dependence on the inverse of the signal-to-noise ratio. We set the magnitude of this term so that the reduced of the residuals of the best-fit model (including activity and the orbit of CoRoT-7b) is unity. The resulting value of , averaged over all spot models, is m s-1. We then estimate the uncertainty on this value using a bootstrap on the individual measurements. This provides an error estimate that is independent on the assumptions regarding the nature of the sources of uncertainties and their distribution. We find m s-1. The corresponding mass range for CoRoT-7b is MEarth.
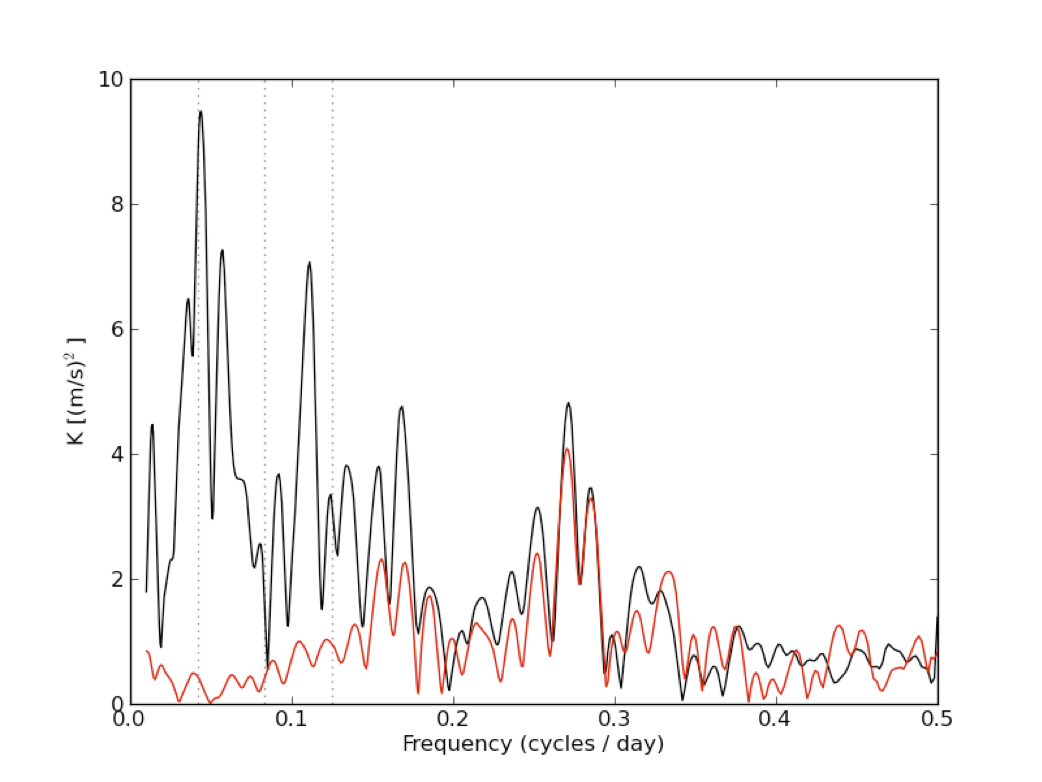
Our uncertainty is significantly larger than that quoted by Q09 (m s-1). Q09 estimate that their pre-whitening filter induces a systematic uncertainty of up to 1 m s-1, but they do not incorporate this in their final uncertainty. Similarly, they noted that the adaptive harmonic filter significantly reduces the amplitude of the signal at the period of CoRoT-7b, and correct for this by multiplying both the semi-amplitude measured after applying that filter and its formal uncertainty by a factor of two. For comparison, we have reproduced the adaptive harmonic filtering used in Q09. The result is shown on Fig. 6. We find that it reduces the signal at the period of CoRoT-7b by 2 m s-1 (from to m s-1). Since there is no compelling way of assessing how much of the signal that was filtered out arose from activity, and how much was of planetary origin, we estimated that the systematic uncertainty induced by the Q09 filtering process is m s-1.
Additional planets?
The RV data are dominated by strong and highly complex activity-induced jitter. In addition, we have shown that it also contains unrecognised features, probably instrumental in origin, with unknown spectral characteristics, and amplitudes in the range 5–10 m s-1. Given this, we believe it is not warranted to assess the possible presence of the low-mass planets at d and d considered by Q09 and H10.
We did investigate the possible detection of a signal from CoRoT-7b, because the transits provide a-priori knowledge of its period and phase, placing relatively strong constraints on its RV signature. However, no such constraints exist for non-transiting planets. The combined effect of activity, additional uncertainties in the low-SNR data, and irregular sampling, could easily give rise to periodogram features of amplitude similar to the semi-amplitudes expected for Neptune-mass planets around CoRoT-7 at periods in the – d range. We recall that typical timescales for weather-induced effects fall in that range, and that both we and Lanza et al. (2010) find evidence for differential rotation as well as rapid active region evolution, which further the range of periodicities at which activity can be expected to contribute to the signal.

Is CoRoT-7b detected in RV?
The detection of a planetary RV signal at the period of CoRoT-7b is only significant at the level. Nevertheless, the RV periodogram does contain a peak at the photometric period, and the RV orbital solution is in phase with the transit solution of the CoRoT photometry. While it is difficult to quantify this evidence, it does seem to add credibility to the hypothesis of the planet existence and the likelihood of a significant RV planet detection. On the other hand, it is important to keep in mind that the observations of CoRoT-7 were not collected in a ‘blind’ way. Instead, they were obtained with the specific aim of searching for a low-mass planet signal at the period and phase of the transits. This induces a subjective bias in the observations: additional HARPS measurements were scheduled until a signal of amplitude deemed sufficient was apparent in the noise. This ‘noise-enhanced detection’ effect makes it difficult to apply statistical arguments to assess the phase coincidence.
To summarise, the RV data is at best a marginal confirmation of the planetary nature of the eclipsing companion. We note that the rest of the follow-up effort reported by Léger et al. (2009) excluded most, but not all, blended eclipsing binary scenarios. A blend would also give rise to sinusoidal variations at the period and phase of the transits (Torres et al., 2004). There are several cases in the literature where RV confirmation of transiting planets has proved tricky and announcements were made on the basis of marginal RV detections. Some of these were later shown to be spurious (Dreizler et al., 2003; Konacki et al., 2003), while some are widely considered to remain unsolved (SWEEPS-4 and 11, Sahu et al. 2006). In this context, it is difficult to be confident that CoRoT-7b meets the requirements for planetary confirmation.
The nature of CoRoT-7b
Let us for now take the measurement of the RV semi-amplitude of CoRoT-7b at face value, and estimate the resulting constraints on its mass, .
Figure 7 shows the position of the equiprobability contours in the mass-radius diagram corresponding to our results. The most likely value for the density of the planet corresponds to a water/ice composition (or a rocky core and a large H/He envelope, as the two are degenerate, as pointed out by e.g. Rogers & Seager, 2010). This composition is marginally favoured (at the level) over a rocky planet, or a much lighter H2O or Hydrogen-rich planet. As the RV detection is marginal, negligible masses (undetectable with the present data) cannot be firmly excluded.
Compared to other extra-solar planets in the 1– range, the updated position of CoRoT-7b raises an interesting possibility, which was seemingly excluded by the Q09 value. All the extra-solar planets in this mass range, including CoRoT-7b, seem most consistent with a composition dominated by water ice, similar to Neptune and Uranus. The same positions are consistent with a primarily rocky composition with a large gas envelope, but fine-tuning would be required for such planets to have mean densities identical to those expected from a Uranus/Neptune-like composition. This suggests that those transiting planets, now on very close-in orbits, may all have been formed beyond the snow line. CoRoT-7b could be a ’mini-Neptune’ rather than a ’Super-Earth’, although such speculation remains subject to the proviso that the confirmation of its planetary nature is not as firm as that of the other planets in the low-mass transiting sample.
5 Conclusions
We have performed a detailed analysis of the HARPS observations of CoRoT-7 published by Q09, constructing a realistic model of the activity-induced stellar signal, making use of all the available data, and exploring the possibility of errors beyond the formal RV uncertainties.
We find that the signal from stellar activity during the HARPS observations can be robustly modelled by dark spots rotating on the surface of the star, using the CCF width and bisector information to constrain the model. We also find clear evidence of systematics in the RV data, in the form of large jumps (of order 20 m s-1) which are significantly larger than the formal uncertainties and are explained neither by activity nor by the putative planetary signal. As these unaccounted-for effects depend strongly on the SNR of the spectra, we attribute them to instrumental uncertainties operating in the mid-SNR regime, and which are also seen in other stars observed at similar SNR with HARPS and other high-precision RV spectrographs.
Allowing for the SNR-dependent uncertainties, we estimate the semi-amplitude of the signal at the period and phase of CoRoT-7b to be m s-1, a detection at the level. This value corresponds to a companion mass of , with the 95% confidence interval encompassing the full 0–5 range. Given the presence of strong variations of stellar and instrumental origin with unknown spectral characteristics, we argue that the data cannot be used to search for additional (non-transiting) planets in the – d period range, and that claims of the detection of such planets (’CoRoT-7c’ and ’CoRoT-7d’) does not stand scrutiny.
We conclude that the data provides at best marginal evidence for the presence of a planet in orbit around CoRoT-7 at the period of the transits detected in the CoRoT data. If the planetary hypothesis is adopted, the data allow for a range of compositions, and favour a somewhat lower mean density than previously stated, implying that the rocky nature of CoRoT-7b is far from certain.
In the future, the Kepler and CoRoT missions are expected to yield more terrestrial planet candidates. Our analysis of the case of CoRoT-7b demonstrates the importance of securing simultaneous RV and photometry follow-up especially for those cases of active host stars. The basic many-spot model which we used can be further elaborated in several directions, such as introducing Bayesian analysis techniques or more sophisticated modelling of the stellar surface. We suggest it may prove to be a basic item in the analysis toolbox for those cases, both in cases where simultaneous photometry exists or when proxy photometry through the CCF has to be used (Aigrain et al., in prep.)
More RV measurements are needed to confirm the planetary nature of CoRoT-7b beyond reasonable doubt and to improve observational constraints on its mass to a level where it can be usefully compared to theoretical models. This could be done on a larger telescope, for instance Keck/HIRES, in a reasonable time and at higher signal to noise – thus testing the SNR-dependence of the RV uncertainties, and hopefully circumventing the issue. If systematics at the level of a few m s-1 can be excluded, and a reliable brightness indicator collected at the time of the observations, a few measurements per night during a few nights should be sufficient to measure the short-timescale component of the signal with reasonable accuracy.
In the meantime, we caution that models building on the rocky nature of CoRoT-7b may be built on sand.
Acknowledgements
We wish to acknowledge the support of a STFC Advanced Fellowship (FP), an STFC Standard Grant ST/G002266/1 (SA),and the Israel Science Foundation / Adler Foundation for Space Research Grant No. 119/07 (SZ).
References
- Aigrain et al. (2009) Aigrain S., Pont F., Fressin F., Alapini A., Alonso R., Auvergne M., Barbieri M., Barge P., Bordé P., Bouchy F., et al. 2009, A&A, 506, 425
- Baglin (2003) Baglin A., 2003, Adv. Sp. Res., 31, 345
- Bakos et al. (2010) Bakos G. Á., Torres G., Pál A., Hartman J., Kovács G., Noyes R. W., Latham D. W., Sasselov D. D., Sipőcz B., Esquerdo G. A., Sári P., 2010, ApJ, 710, 1724
- Barge et al. (2008) Barge P., Baglin A., Auvergne M., Rauer H., Léger A., Schneider J., Pont F., Aigrain S. andAlmenara J., Alonso R., Barbieri M., 2008, A&A, 482, L17
- Barnes et al. (2010) Barnes R., Raymond S., Greenberg R., Jackson B., Kaib N., 2010, ApJL, 709, L95
- Boisse et al. (2009) Boisse I., Moutou C., Vidal-Madjar A., Bouchy F., Pont F., Hébrard G., Bonfils X., Croll B., Delfosse X., Desort M., et al. 2009, A&A, 495, 959
- Bonfils et al. (2007) Bonfils X., Mayor M., Delfosse X., Forveille T., Gillon M., Perrier C., Udry S., Bouchy F., Lovis C., Pepe F., Queloz D., Santos N., Bertaux J.-L., 2007, A&A, 474, 293
- Bordé et al. (2003) Bordé P., Rouan D., Léger A., 2003, A&A, 405, 1137
- Borucki et al. (2010) Borucki W., Koch D., Brown T., Basri G., Batalha N., Caldwell D., Cochran W., Dunham E., Gautier T., Geary J., et al. 2010, ApJL, 713, L126
- Bouchy et al. (2001) Bouchy F., Pepe F., Queloz D., 2001, A&A, 374, 733
- Bouchy et al. (2005) Bouchy F., Pont F., Melo C.ãndSantos N., Mayor M., Queloz D., Udry S., 2005, A&A, 431, 1105
- Bruntt et al. (2010) Bruntt H., Deleuil M., Fridlund M., Alonso R., Bouchy F., Hatzes A., Mayor M., Moutou C., Queloz D., 2010, A&A, in press
- Charbonneau et al. (2009) Charbonneau D., Berta Z., Irwin J., Burke C., Nutzman P., Buchhave L., Lovis C., Bonfils X., Latham D., Udry S., et al. 2009, Nature, 462, 891
- Dall et al. (2006) Dall T. H., Santos N. C., Arentoft T., Bedding T. R., Kjeldsen H., 2006, A&A, 454, 341
- Dreizler et al. (2003) Dreizler S., Hauschildt P. H., Kley W., Rauch T., Schuh S. L., Werner K., Wolff B., 2003, A&A, 402, 791
- Dvorak et al. (2010) Dvorak R., Schneider J., Eybl V., 2010, eprint arXiv, 1004, 4129
- Gillon et al. (2009) Gillon M., Anderson D. R., Triaud A. H. M. J., et al., 2009, A&A, 501, 785
- Gillon et al. (2007) Gillon M., Pont F., Demory B.-O., Mallmann F., Mayor M., Mazeh T., Queloz D., Shporer A., Udry S., Vuissoz C., 2007, A&A, 472, L13
- Hatzes et al. (2010) Hatzes A., Dvorak R., Wüchterl G., Guterman P., Hartmann M., Fridlund M., Gandolfi D., Guenther E., Päetzold M., 2010, A&A, submitted
- Horne & Baliunas (1986) Horne J. H., Baliunas S. L., 1986, ApJ, 302, 757
- Jackson et al. (2009) Jackson B., Barnes R., Greenberg R., 2009, ApJ, 698, 1357
- Jackson et al. (2010) Jackson B., Miller N., Barnes R., Raymond S., Fortney J., Greenberg R., 2010, MNRAS, in press
- Konacki et al. (2003) Konacki M., Torres G., Sasselov D. D., Jha S., 2003, ApJ, 597, 1076
- Lagrange et al. (2010) Lagrange A.-M., Desort M., Meunier N., 2010, A&A, 512, 38
- Lanza et al. (2010) Lanza A., Bonomo A., Moutou C., Pagano I., Messina S., Leto G., Cutispoto G., Aigrain S., Alonso R., Barge P., et al. 2010, A&A, in press
- Lanza et al. (2010) Lanza A., Bonomo A., Pagano I., Leto G., Messina S., Cutispoto G., Moutou C., Aigrain S., Alonso R., Barge P., et al. 2010, A&A, in press
- Lanza et al. (2009) Lanza A., Pagano I., Leto G., Messina S., Aigrain S., Alonso R., Auvergne M., Baglin A., Barge P., Bonomo A., et al. 2009, A&A, 493, 193
- Lanza et al. (2004) Lanza A., Rodonò M., Pagano I., 2004, A&A, 425, 707
- Lanza et al. (2003) Lanza A., Rodonò M., Pagano I., Barge P., Llebaria A., 2003, A&A, 403, 1135
- Lanza et al. (2010) Lanza A. F., Bonomo A. S., Moutou C., Pagano I., Messina S., Leto G., Cutispoto G., Aigrain S., Alonso R., Barge P., Deleuil M., Auvergne M., Baglin A., Collier Cameron A., 2010, ArXiv e-prints
- Léger et al. (2009) Léger A., Rouan D., Schneider J., Barge P., Fridlund M., Samuel B., Ollivier M., Guenther E., Deleuil M., Deeg H., et al. 2009, A&A, 506, 287
- Mayor et al. (2009) Mayor M., Bonfils X., Forveille T., Delfosse X., Udry S., Bertaux J.-L., Beust H., Bouchy F., Lovis C., Pepe F., Perrier C., Queloz D., N. S., 2009, A&A, 507, 487
- Meunier et al. (010a) Meunier N., Desort M., Lagrange A.-M., 2010a, A&A, 512, 39
- Meunier et al. (010b) Meunier N., Lagrange A.-M., Desort M., 2010b, A&A, in press
- Mosser et al. (2009) Mosser B., Baudin F., Lanza A., Hulot J., Catala C., Baglin A., Auvergne M., 2009, A&A, 506, 245
- Moutou et al. (2008) Moutou C., Bruntt H., Guillot T., Shporer A., Guenther E., Aigrain S., Almenara J. M., Alonso R., Auvergne M., Baglin A., Barbieri M., Barge P., Wuchterl G., 2008, A&A, 488, L47
- Pepe & Lovis (2008) Pepe F. A., Lovis C., 2008, Physica Scripta Volume T, 130, 014007
- Pont et al. (2005) Pont F., Bouchy F., Melo C., Santos N., Mayor M., Queloz D., Udry S., 2005, A&A, 438, 1123
- Pont et al. (1994) Pont F., Mayor M., Burki G., 1994, A&A, 285, 415
- Pont et al. (1997) Pont F., Queloz D., Bratschi P., Mayor M., 1997, A&A, 318, 416
- Press & Rybicki (1989) Press W. H., Rybicki G. B., 1989, ApJ, 338, 277
- Queloz et al. (2009) Queloz D., Bouchy F., Moutou C., Hatzes A., Hébrard G., Alonso R., Auvergne M., Baglin A., Barbieri M., Barge P., et al. 2009, A&A, 506, 303
- Rauer et al. (2009) Rauer H., Queloz D., Csizmadia S., Deleuil M., Alonso R., Aigrain S., Almenara J. M., Auvergne M., Baglin A., Barge P., Bordé P., Bouchy F., Triaud A. H. M. J., Wuchterl G., 2009, A&A, 506, 281
- Rogers & Seager (2010) Rogers L., Seager S., 2010, ApJ, 712, 974
- Sahu et al. (2006) Sahu K., Casertano S., Bond H., Valenti J., Smith T., Minniti D., Zoccali M., Livio M., Panagia N., Piskunov N., et al. 2006, Nature, 443, 534
- Santos et al. (2002) Santos N., Mayor M., Naef D., Pepe F., Queloz D., Udry S., Burnet M., Clausen J., Helt B., Olsen E., Pritchard J., 2002, A&A, 392, 215
- Santos et al. (2000) Santos N. C., Mayor M., Naef D., Pepe F., Queloz D., Udry S., Blecha A., 2000, A&A, 361, 265
- Santos et al. (2003) Santos N. C., Udry S., Mayor M., Naef D., Pepe F., Queloz D., Burki G., Cramer N., Nicolet B., 2003, A&A, 406, 373
- Sing (2010) Sing D. K., 2010, A&A, 510, A21+
- Torres et al. (2004) Torres G., Konacki M., Sasselov D. D., Jha S., 2004, ApJ, 614, 979
- Valencia et al. (2010) Valencia D., Ikoma M., Guillot T., Nettelmann N., 2010, A&A, 516, 20
- Zechmeister & Kürster (2009) Zechmeister M., Kürster M., 2009, A&A, 496, 577