Discovery of Quasi-Periodic Oscillations in the Recurrent Burst Emission
from SGR 1806-20
Abstract
We present evidence for Quasi-Periodic Oscillations (QPOs) in the recurrent outburst emission from the soft gamma repeater SGR 1806-20 using NASA’s Rossi X-ray Timing Explorer (RXTE) observations. By searching a sample of 30 bursts for timing signals at the frequencies of the QPOs discovered in the 2004 December 27 giant flare from the source, we find three QPOs at 84, 103, and 648 Hz in three different bursts. The first two QPOs lie within 1 from the 92 Hz QPO detected in the giant flare. The third QPO lie within 9 from the 625 Hz QPO also detected in the same flare. The detected QPOs are found in bursts with different durations, morphologies, and brightness, and are vindicated by Monte Carlo simulations, which set a lower limit confidence interval . We also find evidence for candidate QPOs at higher frequencies in other bursts with lower statistical significance. The fact that we can find evidence for QPOs in the recurrent bursts at frequencies relatively close to those found in the giant flare is intriguing and can offer insight about the origin of the oscillations. We confront our finding against the available theoretical models and discuss the connection between the QPOs we report and those detected in the giant flares. The implications to the neutron star properties are also discussed.
Subject headings:
pulsars: individual (SGR 1806-20) — stars: flare — stars: neutron — stars: oscillations— stars: magnetic field1. INTRODUCTION
Soft Gamma Repeaters (SGRs) and Anomalous X-ray Pulsars (AXPs) are widely believed to be magnetars, i.e. neutron stars with intense magnetic field of the order of Gauss (Duncan & Thompson, 1992; Woods & Thompson, 2006). Magnetars are characterized by the repetitive emission of bright bursts of low-energy gamma-rays with short durations ( 0.1 s) and peak luminosities reaching up to 1041 erg s-1, well above the classical Eddington luminosity 21038 erg s-1 for a neutron star. Magnetars are also persistent X-ray pulsars with slow spin periods ( s) and rapid spin-down rate ( msyr). Less frequently, magnetars produce enormously energetic giant flares with peak luminosities of the order of 1044 - 1046 erg s-1, followed by pulsating tail lasting for hundreds of seconds. At present, there are 18 magnetars: 8 SGRs and 10 AXPs555See the McGill SGR/AXP Online Catalog (http://www.physics.mcgill.ca/pulsar/magnetar/main.html) (see Mereghetti (2008) for a review).
The magnetar model postulates that the dominant source of energy of magnetars is their intense magnetic field. The persistent X-ray emission is attributed to magnetospheric currents driven by twists in the magnetic field. The short bursts are produced as a result of outward propagation of Alfvén waves through the magnetosphere. The giant flares are triggered by sudden catastrophic reconfiguration of the magnetic field that causes a large scale crustquake (Thompson & Duncan, 1995, 1996, 2001; Schwartz et al., 2005).
On 2004 December 27, SGR 1806-20 emitted its first recorded giant flare that was observed by a number of satellites as the most powerful giant flare from a magnetar. The flare reached a peak luminosity of the order of 1046 erg s-1 in the first 0.2 s (Hurley et al., 2005; Palmer et al., 2005), causing a strong perturbation in the Earth’s ionosphere and saturation of most satellite detectors (Terasawa et al., 2005). The initial spike was followed by s tail modulated at the s spin period of the SGR. Using RXTE Proportional Counter Array (PCA) observations, Israel et al. (2005) discovered three QPOs at 18, 30, and 92 Hz in the decaying tail. With Ramaty High Energy Solar Spectroscopic Imager (RHESSI), Strohmayer & Watts (2005) confirmed the 18 and 92 Hz QPOs and reported two additional QPOs at 26 and 626 Hz. Subsequently, Watts & Strohmayer (2006) re-analyzed the RXTE observations and confirmed the 26 and 626 Hz QPOs detected with RHESSI and reported additional QPOs at 150 and 1840 Hz. Two more QPOs at 720 and 2384 Hz were reported at a lower significance.
Strohmayer & Watts (2005) also studied the RXTE observations of the 1998 August 27 giant flare from SGR 1900+14 and discovered four QPOs at 28, 53, 84, and 155 Hz in the flare’s pulsating tail. In both sources the QPOs were detected in part of the tail and were only seen at a specific rotational phase. They were identified as a sequence of toroidal modes associated with seismic vibrations in the neutron star crust. Other models were also suggested, e.g. Glampedakis et al. (2006); Levin (2006); Beloborodov & Thompson (2007); Samuelsson & Andersson (2007); Ma et al. (2008); Shaisultanov & Eichler (2009).
Motivated by these findings, we undertook the task of searching for similar signatures in the typical and more common emission of magnetars: the recurrent bursts. Here we present the results from SGR 1806-20. Our results from SGR 1900+14 are forthcoming.
2. DATA ANALYSIS & RESULTS
RXTE first observed SGR 1806-20 during 1996 November 5-18. We obtained the PCA observations in 2–60 keV and reduced the data with HEAsoft 6.6 to obtain the burst light curves. The observations with the most bursts were taken in the event-mode configuration with time resolution s and 256 energy channels. All 5 proportional counter units (PCUs) of the PCA were fully functional. Photons from all PCUs and all detector anodes were combined to maximize the signal-to-noise ratio and the artificial event-mode time markers were removed. We screened out very faint bursts that do not have sufficient counts and very bright bursts that would cause significant pile-up and dead-time effects and selected 30 bursts for our timing analysis. We binned each burst at the smallest time resolution allowed by the data configuration (s) and applied Fast Fourier Transformation (FFT) to the binned photon arrival times to obtain a power spectrum for each burst. The frequency resolution = ranged from 1.72 to 14.63 Hz, depending on the burst duration, and the Nyquist frequency was 4096 Hz. The power spectra were normalized using Leahy normalization method (Van der Klis, 1989; Israel & Stella, 1996) and we searched each burst power spectrum for timing signals in the frequency range of the QPOs found in the 2004 giant flare. Candidate QPOs were fitted to a Lorentzian function to calculate their properties, and their significance was investigated using Monte Carlo simulations.
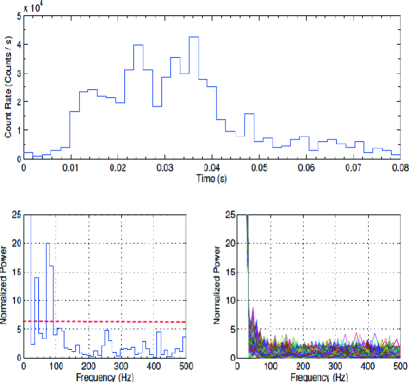
In a short ( s), moderately bright burst (total counts ), we find a QPO candidate around 84 Hz with single trial null probability of 3.410-5 (see Fig. 1 top panel). The QPO has a centroid frequency Hz and a half width at half maximum Hz, corresponding to a coherence value Q / of 4.84.
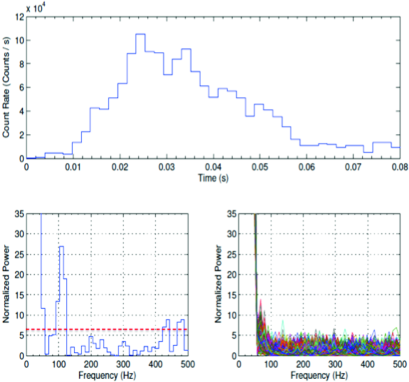
In another short, bright burst with a gradual rise (duration s and total counts 3.07 , see Fig. 1 middle panel), we detect a candidate QPO at 103 Hz at a null probability of 1.4310-6. This QPO has a centroid frequency Hz, width Hz, and coherence value 5.
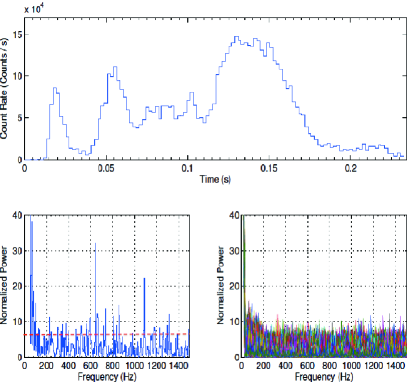
In the bottom panel of Fig. 1, we show a long ( s), bright burst (total counts 1.37 ) with a pair of QPO candidates at around 648 and 1096 Hz with a single trial probability of 2.3310-7 and 1.3710-5, respectively. Fitting each to a Lorentzian function yields Hz, Hz, and for the first QPO and Hz, Hz, and for the second.
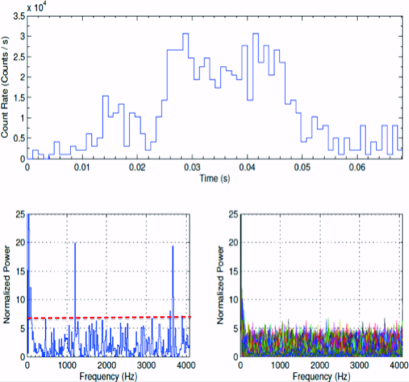
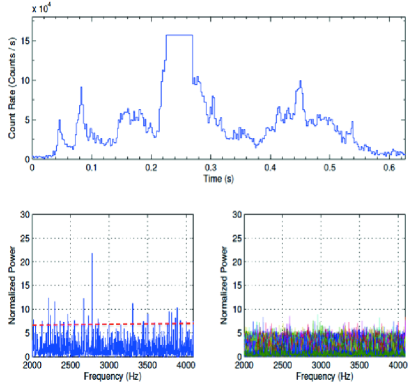
In the other bursts we did not find significant QPOs at the previously detected frequencies. Extending our search to other frequencies, we detect two high frequency QPO candidates in the short, relatively dim burst (duration 0.07 s and total counts 700) shown in Fig. 2 (upper burst) at and Hz. Forming the null hypothesis results in a single trial probability of 3.4 for each feature. We estimate that the 1230 and 3690 Hz features have = 8.00 0.48 and 8.37 0.79 Hz respectively and corresponding coherence values of 76 and 220. Another high frequency QPO candidate around 2785 Hz is found in the long, intense burst (duration 0.63 s and total counts 2.00 ) shown in Fig. 2 (bottom burst), at a single trial probability of 7.96. The QPO is centered at Hz and has a width Hz and coherence .
Since our strategy was to search for QPOs at the previously reported frequencies, the number of trials for the 84, 103, and 648 Hz QPOs takes into account the number of bursts (30 bursts) and the number of frequency bins between the QPOs we detect and those discovered in the giant flare (0.72 bins for the 84 Hz QPO, 0.96 bins for the 103 Hz QPO, and 5.51 bins for the 648 Hz QPO). This brings their null probabilities to 7.34, 4.14, and 3.85, respectively. For the high frequency QPOs at 1096, 1230, 2785 and 3690 Hz, we had no prior knowledge of these frequencies and we must account for the total number of frequency bins in the power spectra as well as the number of bursts. The number of frequency bins accounted for in the case of the 1096, 1230, 2785 and 3690 Hz QPOs is 960, 280, 2376 and 280 bins respectively. This brings the chance probability to higher than , thus ruling out these QPOs on the basis of the null hypothesis alone.
A more cogent approach to assessing the statistical significance is through utilizing Monte Carlo simulation. For each of the above bursts, we generated a simulated light curve at the same time resolution (s) by fitting the burst light curve to a high-order polynomial function. We then determined the number of photons in each time bin by seeding a Poisson distributed random number generator whose mean value is the number of counts we obtain from the fitting function. We used this approach to obtain 50,000 simulated light curves for each real burst and we generated a power spectrum for each simulated burst using the same technique we used to find the QPOs in the bursts above. In Fig. 1 and 2, the right panel under each burst shows the accumulated power spectra of the 50,000 simulated bursts222The number of simulated bursts was set by the available CPU and memory resources to carry out the Monte-Carlo simulation.. We find none to have shown a structure at or near the frequencies of the candidate QPOs with similar or higher power, yielding a null probability lower limit of 2 (or a confidence level interval ) for the QPOs reported above.
The statistical significance arrived at from the two independent approaches above gives a secure detection for the 84, 103, and 648 Hz QPOs and a marginal significance for the kHz QPOs.
3. Discussion
Our search for QPOs in the recurrent bursts from SGR 1806-20 revealed QPOs of interesting similarities to those discovered in the giant flares from the source and from SGR 1900+14 (Israel et al., 2005; Strohmayer & Watts, 2005; Watts & Strohmayer, 2006). We found three intriguing QPOs at , , and Hz. The 84 Hz QPO lies within 1 from the Hz QPO from the same source and coincides with the 84 Hz QPO discovered in the SGR 1900+14 giant flare. The 103 Hz feature lies within 1 from the Hz feature from the source. The high frequency QPO at Hz is within 9 from the and Hz QPOs detected from the source with RXTE and RHESSI, respectively. Those QPOs are detected in bursts with different duration, luminosity, rise time, and light curve morphology, and thus cannot be due to artifacts in the light curves. Their statistical significance is further confirmed by the Monte-Carlo simulations.
Torsional shear mode mechanism on the neutron star crust is a promising framework for interpreting magnetar QPOs since the observed low frequencies fit comfortably within theoretical models predictions and are associated with a sequence of modes, while the high frequency QPOs are interpreted as modes with higher order radial displacement eigenfunction ( 1). As a consequence of the twisting of the magnetic field lines and the outward propagation of the Alfvén waves, stresses build up in the neutron star crust, which is very likely to excite toroidal vibrational modes in the neutron star crust (Ruderman, 1991; Ruderman et al., 1998; Schwartz et al., 2005). The excited frequency modes depend on the neutron star mass and radius, crustal composition and the magnetic field (Duncan, 1998; Hansen & Cioffi, 1980; McDermott et al., 1988; Messios et al., 2001; Piro, 2005; Schumaker & Thorne, 1983; Strohmayer, 1991).
In the context of global seismic vibrations, Duncan (1998) estimated the eigenfrequency of the fundamental toroidal mode =2, =0 denoted to be
| (1) |
Where km and . If a twisted magnetic field is embedded throughout the neutron star crust, one needs to account for the magnetic field correction and the eigenfrequencies are modified to Hz, where is the non-magnetic eigenfrequency, 41015 Gauss and 1 is the density in the deep crust in units of 1014 g cm-3. The higher order mode eigenfrequencies (=0 & 2) were shown to be scaled as (Hansen & Cioffi, 1980) and were derived by Strohmayer & Watts (2005) under the assumption that the magnetic tension boosts the field isotropically. One must note that the degree to which the magnetic field modifies the eigenfrequency is highly dependent on the magnetic field configuration and other non-isotropic effects which could alter this correction significantly (Messios et al., 2001). The eigenfrequencies of the higher order toroidal modes are given by
| (2) |
The QPOs at 92.5 and 30 Hz discovered in SGR 1806-20 giant flare are attributed to the and modes, respectively while the 626.5 Hz QPO was modeled as =1 toroidal mode where the choice of is irrelevant. In this context, the 84 and 103 Hz QPOs that we report correspond to and respectively. It was recently suggested that a number of peaks can be seen in the in the 78 105 Hz frequency range of the power spectrum of SGR 1806-20 giant flare that could be attributed to magnetic splitting under the perturbative condition (Shaisultanov & Eichler, 2009). In that view, the two QPOs at 84 and 103 Hz may be the result of magnetic splitting of a degenerate mode.
The 648 Hz QPO we report may be interpreted in terms of =1 toroidal mode irrelevant of the choice of . For such high frequency QPOs, the 1 torsional modes in the neutron star crust is a more plausible interpretation and they fall within the frequency range suggested for the search for higher frequency QPOs by Piro (2005).
The detection of QPOs in magnetars has triggered a boost in the theoretical modeling that included attempts to construct more refined models that consider crust/core coupling, magnetic field geometry, elastic properties of the crust and other effects. Glampedakis et al. (2006) used a simple global MHD toy model to calculate the global magneto-elastic modes taking into consideration the magnetic coupling between the elastic crust and the fluid core under the assumption that the magnetic field is uniform. The model provides intriguing results and indicates that the system has a rich spectrum of global modes and it will naturally excite modes that minimize the energy transfer between the crust and the core. The excited modes frequencies are similar to those of the observed QPOs, where the modes that survive are those for which the coupling is minimum and have very weak amplitudes in the core. This model further supports the global seismic vibrations interpretation of the observed QPOs and it also accommodates for the 18 and 26 Hz QPOs seen in the SGR 1806–20 giant flare. A general relativistic formulation using the Cowling approximation, which does not include any correction for the magnetic field yielded a set of analytic estimates of the eigenfrequency modes based on numerical calculations (Samuelsson & Andersson, 2007). This model yields a different scaling with than the previous scaling, which leads to different mode assignments. Futhermore, the assumption of an isotropic magnetic field is inadequate as recent MHD simulations of the evolution of the magnetic field and its geometry in magnetars have indicated that magnetars have a strong dipole field component and a possible strong internal poloidal field (Braithwaite & Spruit, 2006). Since the QPOs we report and those observed in the giant flare are about 8 years apart, the observed frequencies can offer insight on the magnetic field decay of the neutron star. If we assume that the 103 and 92 Hz QPOs are attributed to the =7 mode, we infer that the magnetic field strength of SGR 1806-20 has decayed from 2 in 1996 to 3.5 G in 2004.
Magnetospheric oscillation models were suggested as a possible interpretation for the origin of magnetar QPOs. Ma et al. (2008) argued that the low frequency range QPOs could be modeled using the standing sausage mode oscillations of flux tubes in the magnetar corona. It is assumed that part of the plasma ejected during the giant flare is trapped by the magnetic field and then forms magnetic flux tube structures similar to what is seen in the solar corona. The tube oscillation model cannot accommodate the high frequency QPOs in SGR 1806-20. For the very high frequency QPOs, Beloborodov & Thompson (2007) suggested that the inner electric current in magnetar corona will induce very high frequency QPOs 10 kHz where the corona self organizes itself into quasi steady state. Such high frequency QPOs remain to be detected while the lower frequency oscillations would involve the outer corona where the emission in this region is not intense enough to excite the observed QPOs. The QPOs we report are detected in short ( s), relatively dim bursts and in long ( s), bright bursts that would produce different signatures in the magnetosphere. Since the short, weak bursts may not produce a fireball at all or be of magnetospheric origin, this casts doubts on magnetospheric models as an origin for the QPOs in magnetars.
A number of theoretical models postulated that AXPs and magnetars are neutron stars surrounded by fossil disks that were acquired during supernova collapse or during a common-envelope interaction (Chatterjee et al., 2000; Chatterjee & Hernquist, 2000; Perna et al., 2000). Wang et al. (2006) reported evidence for a debris disk around the AXP 4U 0142+61, which led to the suggestion that the magnetar QPOs could be due to a possible disk as in the case of accreting neutron stars, which exhibit kHz QPOs that are believed to originate in the accretion disk (Van der Klis, 2006). The reported QPOs are detected during the bright X-ray emission of the bursts and are not seen in the decaying phase, thus arguing against arising from a possible passive debris disk around the magnetar. Furthermore, this interpretation is mainly ruled out by the fact that we have no evidence for the existence of a fallback debris disk around SGRs. Watts & Strohmayer (2007) pointed out that for neutron stars that exhibit extremely high frequency QPOs, the inner disk radius of the debris disk is comparable to that of the neutron star. In the case of magnetars, the inner disk radius would have to be several solar radii to induce the observed magnetar QPOs, which rules out the modes of a debris disk mechanism as a viable interpretation for the magnetar QPOs.
Levin (2006) argued against the global seismic vibrations as a viable interpretation for the QPOs in magnetars and suggested that the QPOs could be associated with MHD elastic modes of the neutron star. However, the toy model employed by Levin assumed a rather simplified model for the geometry of the neutron star and the boundary conditions. Watts & Strohmayer (2007) offered a detailed critique and casted doubts about Levin’s conclusions except for the crust/core coupling effect which needs to be well accounted for in future models.
Observing QPOs in both the giant flares and the recurrent burst emission from magnetars is an important development in our understanding of neutron star physics. Further observations, analysis of archival data, and model developments are key to shedding further insight on the underlying phenomena.
4. ACKNOWLEDGEMENTS
We would like to thank Anna Watts and Philip Kaaret for their insightful comments and Gianluca Israel and Craig Markwardt for the useful suggestions. A.M. is grateful to Kent Wood and Christopher Thompson for advice and useful discussions during the Neutron Stars and Gamma Ray Bursts Conference that was held in Cairo and Alexandria, Egypt in 2009. We acknowledge the MIT Kavli Institute of Astrophysics and Space Research where this work was partly carried out. A.M is funded by AUC research grant. A.I. acknowledges support from the Fulbright Commission.
References
- Beloborodov & Thompson (2007) Beloborodov, A. M., & Thompson, C., 2007, ApJ, 657, 967
- Braithwaite & Spruit (2006) Braithwaite, J. & Spruit H. C. 2006, A&A, 450, 1097
- Chatterjee & Hernquist (2000) Chatterjee, P., & Hernquist, L., 2000, ApJ, 543, 368
- Chatterjee et al. (2000) Chatterjee, P., Hernquist, L., & Narayan, R., 2000, ApJ, 534, 372
- Duncan (1998) Duncan, R. C., 1998, ApJ, 498, L45
- Duncan & Thompson (1992) Duncan, R. C., & Thompson, C., 1992, ApJ, 392, L9
- Glampedakis et al. (2006) Glampedakis, K., Samuelsson, L., & Andersson, N., 2006, MNRAS, 371, L74
- Hansen & Cioffi (1980) Hansen, C. J., & Cioffi, D. F., 1980, ApJ, 238, 740
- Hurley et al. (2005) Hurley, K., et al., 2005, Nature, 434, 1098
- Israel et al. (2005) Israel, G. L., et al., 2005, ApJ, 628, L53
- Israel & Stella (1996) Israel, G. L., & Stella, L., 1996, ApJ, 468, 369
- Levin (2006) Levin, Y., 2006, MNRAS, 368, L35
- Ma et al. (2008) Ma, B., Li, X. D., & Chen, P. F., 2008, ApJ, 686, 492
- Mereghetti (2008) Mereghetti, S., 2008, A&A Rev., 15, 225
- McDermott et al. (1988) McDermott, P. N., van Horn, H. M., & Hansen, C. J., 1988, ApJ, 325, 725
- Messios et al. (2001) Messios, N., Papadopoulous, D. P., & Stergioulas, N., 2001, MNRAS, 328, 116
- Palmer et al. (2005) Palmer, D. M., et al., 2005, Nature, 434, 1107
- Park et al. (2005) Park, J., et al., 2005, Science, 308, 1139
- Perna et al. (2000) Perna, R., Hernquist, L., & Narayan, R., 2000, ApJ, 541, 344
- Piro (2005) Piro, A. L., 2005, ApJ, 634, L153
- Ruderman (1991) Ruderman,M., 1991, ApJ, 382, 587
- Ruderman et al. (1998) Ruderman, M., Zhu, T., & Chen, K., 1998, ApJ, 492, 267
- Ruderman (1991) Ruderman,M., 1991, ApJ, 382, 587
- Samuelsson & Andersson (2007) Samuelsson, L., & Andersson, N., 2007, MNRAS, 374, 256
- Schumaker & Thorne (1983) Schumaker, B. L., & Thorne, K. L., 1983, MNRAS, 203, 457
- Schwartz et al. (2005) Schwartz, S. J., et al., 2005, ApJ, 627, L129
- Shaisultanov & Eichler (2009) Shaisultanov, R., & Eichler, D., 2009, ApJ, 702, L23
- Strohmayer (1991) Strohmayer, T. E., 1991, ApJ, 372, 573
- Strohmayer & Watts (2005) Strohmayer, T. E., & Watts, A. L., 2005, ApJ, 632, L111
- Terasawa et al. (2005) Terasawa, T., et al., 2005, Nature, 434, 1110
- Thompson & Duncan (1995) Thompson, C., & Duncan, R. C., 1995, MNRAS, 275, 255
- Thompson & Duncan (1996) Thompson, C., & Duncan, R. C., 1996, ApJ, 473, 322
- Thompson & Duncan (2001) Thompson, C., & Duncan, R. C., 2001, ApJ, 561, 980
- Van der Klis (1989) Van der Klis, M., 1989, In Timing Neutron Stars, NATO ASI, series C, eds. H.Ogelmann & E.P.J. van den Heuvel, Dordrecht:Reidel.
- Van der Klis (2006) Van der Klis, M. Rapid X-Ray Variability in Compact Stellar X-ray Sources, ed. W. H. G. Lewin & M. Van der Klis, Cambridge Astrophysics Series 39, Cambridge University Press, Cambridge
- Wang et al. (2006) Wang, Z., et al., 2006, Nature, 440, 772
- Watts & Strohmayer (2006) Watts, A. L., & Strohmayer, T. E., 2006, ApJ, 637, L117
- Watts & Strohmayer (2007) Watts, A. L., & Strohmayer, T. E., 2007, Advances in Space Research, 40, 1446
- Woods & Thompson (2006) Woods, P. M., & Thompson, C., 2006, Soft Gamma Repeaters and Anomalous X-ray Pulsars: Magnetar Candidates in Compact Stellar X-ray Sources, ed. W. H. G. Lewin & M. Van der Klis, Cambridge Astrophysics Series 39, Cambridge University Press, Cambridge