* E-mail: ogk@astro.caltech.edu, Telephone: 1 626 395 4197
The C-Band All-Sky Survey: Instrument design, status, and first-look data
Abstract
The C-Band All-Sky Survey (C-BASS) aims to produce sensitive, all-sky maps of diffuse Galactic emission at 5 GHz in total intensity and linear polarization. These maps will be used (with other surveys) to separate the several astrophysical components contributing to microwave emission, and in particular will allow an accurate map of synchrotron emission to be produced for the subtraction of foregrounds from measurements of the polarized Cosmic Microwave Background. We describe the design of the analog instrument, the optics of our 6.1 m dish at the Owens Valley Radio Observatory, the status of observations, and first-look data.
keywords:
Polarimetry, CMB, cosmological foregrounds, galactic emission, synchrotron emission, polarized emission1 INTRODUCTION
The fluctuations in the Cosmic Microwave Background (CMB) contain a vast amount of information on the history and composition of our universe. In particular, the angular power spectra of the fluctuations contain rich detail about our early universe, significantly constraining the cosmological parameters in our current models of the universe. The latest cosmological data firmly support an inflationary CDM cosmology for our Universe, with a minimal 6 parameter model (the “concordance cosmology”)[1]. The next challenge in cosmology is to probe the physics of the inflationary period by looking for the signature of primordial gravitational waves in the polarized CMB.
CMB polarization was generated at last scattering by perturbations in the primordial fluid, caused by scalar and tensor perturbations[2]. The tensor perturbations result from the “stretching” of space by gravitational wave fluctuations, while scalar perturbations result from the same density fluctuations in the primordial fluid that result in the CMB temperature anisotropy. The ratio of the tensor perturbation amplitude to the scalar perturbation amplitude, , is a key tracer of the physics of the inflationary epoch.
A local quadrupole anisotropy in the radiation field at the time of decoupling would cause the CMB in that region to become very slightly linearly polarized (of order ), through Thomson scattering by electrons[3, 4]. The linear polarization of the CMB is described by the Stokes parameters and . However, and are orientation dependent, and hence produce a rotationally-variant polarization power spectrum. The CMB (,) polarization can be decomposed[5, 6] into two rotationally invariant quantities, called E and B. The E- and B-modes are often described as the curl-free and divergence-free modes of the polarization vector respectively. The CMB B-mode is a direct tracer of the tensor perturbations caused by gravitational waves in the inflationary period of the universe. It has consequently been dubbed the “smoking gun” of inflation.
However, the Galactic foreground emission can have any mixture of E- and B-modes. Measurements of the E- and B-modes of the WMAP polarization spectra show that the CMB B-mode is obscured by the B-mode of polarized Galactic synchrotron emission at all angular scales when averaged over the whole sky[7]. There are, however, small ( square degree) low-emission regions of the sky where the CMB polarization is expected to dominate.
The early small-area, high-latitude, experiments which measured the EE power spectrum of the CMB[8, 9, 10, 11, 12] focused on low foreground emission areas of the sky where foreground subtraction was not necessary. However, a robust detection of the much-fainter B-mode power spectrum is likely to require data from large areas of the sky and hence some form of foreground removal, particularly if the tensor-to-scalar ratio is small ().

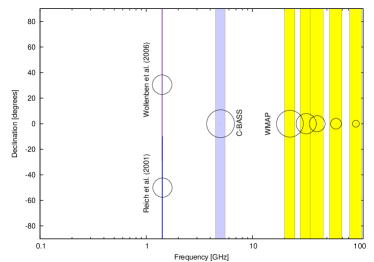
The dominant source of polarized emission at CMB frequencies accessible from the ground is Galactic synchrotron emission. This emission is from high-energy charged particles spiraling around Galactic magnetic field lines, and is strongly linearly polarized. The polarized Galactic synchrotron emission is currently poorly characterized; the current status of moderate-resolution, large sky area surveys is shown in Figure 1. The WMAP 23 GHz polarization map[16] has a low signal-to-noise ratio over much of the sky, while the 1.4 GHz polarization surveys[17, 18] are expected to be badly affected by Faraday rotation at low Galactic latitudes.
C-BASS aims to provide sensitive, all-sky maps of both total intensity and linear polarization at 5 GHz. This frequency is high enough that we will not be unduly affected by Faraday rotation over most of the sky, and low enough that we can reach a good sensitivity in a reasonable amount of time. In addition to being useful for polarized foreground subtraction from CMB measurements, C-BASS will provide a wealth of data on the nature of the Galactic magnetic field, firm constraints on polarized “anomalous” emission, and additional data on the Galactic cosmic ray electron population. C-BASS will allow, for the first time, an accurate separation of synchrotron, free-free, and anomalous emission. In particular, it will constrain any flatter spectrum components that could be responsible for both the WMAP haze and anomalous dust emission.
2 RECEIVER DESIGN
The C-BASS receiver is a novel hybrid of a pseudo-correlation radiometer and a pseudo-correlation polarimeter, covering the 4.5 to 5.5 GHz band in a single analog channel. A schematic diagram of the receiver is shown in Figure 2. This receiver architecture was chosen to provide stable measurements of both total intensity (Stokes ) and linear polarization (Stokes and ). The detector diode voltages are digitized and processed in a custom-designed digital backend.

Total intensity is measured by pseudo-correlating both orthogonal circular polarizations against independent reference loads. This style of radiometer has been used in both the WMAP[19] and Planck[20] receivers. Like the Planck receiver, we compare orthogonal circular polarization signals against electrical refence loads, rather than signals from a second horn à la WMAP. This allows us to preserve the optical purity of the receiver by having an on-axis optical system. The electrical reference loads are temperature controlled RF terminations. Suppression of receiver gain drifts, given unequal sky and reference load temperatures, can be improved through the use of an r-factor correction[21].
We expect that the diffuse Galactic synchrotron emission will have a negligible circularly polarized component. In this case, each orthogonal circular polarization measured by the receiver will be a noise-independent measure of the sky signal total intensity. The pseudo-correlation radiometer provides a more stable measurement of total intensity, at the expense of increased receiver noise.
The receiver measures both Stokes and simultaneously in a pseudo-correlation fashion. When and , the left-circular and right-circular polarization voltages respectively, are pseudo-correlated using a hybrid we obtain Stokes . When they are pseudo-correlated with a hybrid we obtain Stokes . In the C-BASS receiver and are pseudo-correlated in all possible combinations to provide two measures of each linear polarization parameter.
We now discuss some aspects of the receiver in greater detail.
2.1 Optics
The C-BASS receiver will be installed on telescopes at sites in both the Northern and Southern hemispheres. The telescopes and chosen sites are a 6.1 m diameter dish designed by JPL as a prototype for the DSN replacement network[22], located at the Owens Valley Radio Observatory (OVRO), near Big Pine in California; and a 7.6 m diameter former satellite communications antenna located at the MeerKAT support site, near Carnarvon in South Africa.
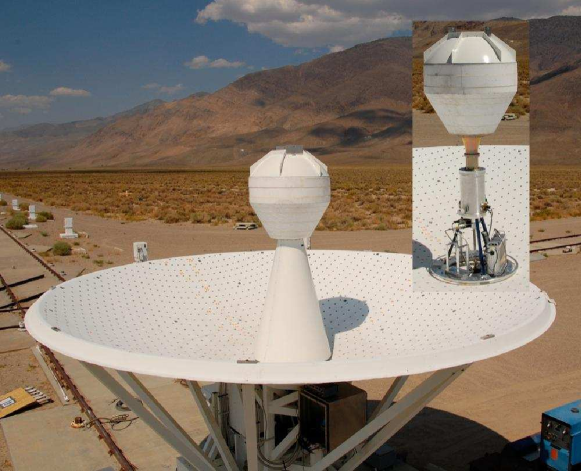
A significant feature of the optical systems of both telescopes is that the secondary mirrors are not supported by metal legs running up from the dish surface [23]. Metal support legs scatter the incoming wave and introduce an unwanted spurious polarization to the signal and uncontrolled signal contamination by ground pick-up. The secondary mirrors are, instead, supported on a cone of radio-transparent foam fixed to the receiver shroud, as shown in Figure 3. The foam was Plastazote LD45111http://zotefoams.com/pages/EN/datasheets/LD45.HTM, a closed-cell, cross-linked, nitrogen-inflated polyethylene foam. Stress modelling indicates that the foam is rigid enough that only 0.92 mm of deflection is seen when it is tipped at an angle of .


Both telescopes have shaped, i.e. non-parabolic, primary mirrors and were originally equipped with unsuitable secondary mirrors and horns. The new optical systems use the same profiled corrugated horn with new custom secondary mirrors. The secondary mirrors are shaped such that both telescopes have the same beam shape, as shown in Figure 4. In the JPL dish the secondary has a Gregorian form, while the South African secondary has a Cassegrain form. The beams have a HPBW of about .
A ray-trace analysis revealed spillover past the secondary mirror. In order to reduce the resulting sidelobe, and a second far-out sidelobe, absorbing tunnels will be placed around the primary and secondary of the JPL dish. This is not necessary for the South African dish, as we under-illuminate the larger primary. The simulated beam pattern of the JPL dish, with absorbing tunnels around both the primary and secondary, is shown in Figure 4. We see a significant reduction in the far-out sidelobes at the lower end of our band.
2.2 Polarimeter
The C-BASS receiver, as shown in Figure 2, is divided into three sections: the cold receiver, the warm receiver, and the digital readout system. The cold receiver consists of the LNAs and pre-LNA components – kept cold (at 4 K) to keep the noise penalty of any loss low – housed in a cryostat. The warm receiver is housed in a separate box beneath the cryostat and consists of all the components from after the LNAs to the detector diodes. The readout system filters and digitizes the detector diode outputs.
The C-BASS cryostat is “dry”, using a Sumitomo Heavy Industries SRDK-408D2 cold head to provide cooling. The cold head provides two stages of cooling: W at 40 K and W at 4.2 K. The cryostat consists of an outer cylindrical body which forms part of the mechanical structure of the telescope, an inner 40 K heat shield to reduce thermal loading on the second stage, and a 4 K second stage.

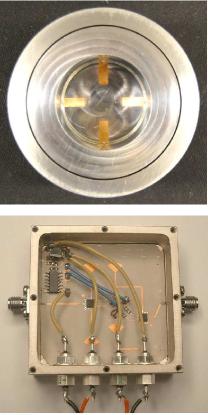
The warm receiver, consisting of the components between the LNAs and the detector diodes, was implemented as a single analog channel covering the 4.5 to 5.5 GHz band. An image of the warm receiver is shown in Figure 5. This box is housed in the space between the cryostat and the dish surface (see Figure 3). The broad fractional bandwidth, limited budget, and stringent performance requirements required us to develop a number of novel components. Among these were a compact, broad-band, and low cross-polarization orthomode transducer[24], and novel broad-band phase switches, shown in Figure 5.
2.3 Digital Readout
The digital backend performs post-detection processing of the analog channels in preparation for archiving by the control computer. Two cards are used: an analog filterboard, and an ADC/FPGA-based, digital card. The ADC board was designed for the LiCAS particle physics experiment[25], but after some modifications to the filters and a re-programming of the FPGA, it met the C-BASS requirements.
As well as post-detection processing, the backend is also responsible for control of the phase switching signals and the noise diode. The processing itself is comprised of low-pass filtering, digitization, demodulation, integration, and preparation for transfer to the control computer. The last three steps are performed on the Xilinx Spartan-3 FPGA, and data are transferred to the computer via USB.
3 FIRST-LOOK DATA
The C-BASS project is currently in a hybrid observing mode. Commissioning and active development of the data reduction pipeline are ongoing. We have begun test survey observations to supply data to the data reduction pipeline and map making routines.

First light on the C-BASS receiver was achieved in December 2009. The raw detector diode outputs from a scan through the moon are shown in Figure 6. The traces which show a large fluctuation are total intensity. The remaining traces are linear polarization, uncorrected for instrumental leakage.
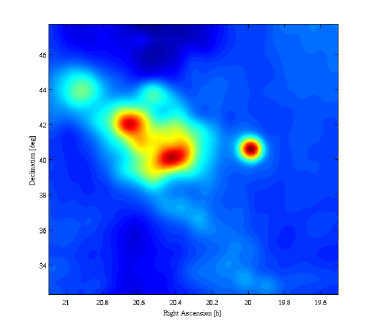
We present, in Figure 6, a map of the Cygnus region in uncalibrated total intensity. The compact source on the right is the radio galaxy Cygnus-A, which is dominated by synchrotron emission. The diffuse emission to the left of Cygnus-A is the Cygnus-X region of the Galactic plane, which is dominated by free-free emission[26]. The image was made by raster scanning the region with scans in azimuth. Linear baselines were removed from each azimuth scan, RFI-contaminated data was removed, and the data was binned on a sparse grid and then convolved with the C-BASS beam. The data were taken on three successive nights, with 1.6 hours of observing contributing to the final map.
4 TIMELINE AND SECOND RECEIVER
We plan to build a second receiver for C-BASS. It will cover the same band as the first receiver, but will use digital hardware to perform the necessary correlations. It will produce spectral measurements of the 4.5 to 5.5 GHz band for RFI mitigation purposes. The spectra will be collapsed into a single bin to match the data produced by the analog instrument.

A schematic diagram of the second C-BASS receiver is shown in Figure 7. Orthogonal circular polarizations from the horn are combined with reference load signals, amplified, phase switched, and filtered. The 4.5 to 5.5 GHz RF signals are mixed down to the DC to 0.5 GHz and 0.5 to 1 GHz bands for digitization and processing. The digital signal capture and processing will be performed on CASPER222http://casper.berkeley.edu/wiki/ROACH hardware, specifically iADC analog to digital convertors and the Xilinx Virtex 5 based ROACH board. This design environment is able to take advantage of the robust and well supported CASPER software toolflow, facilitating both rapid design and deployment as well as remote reconfigurability.
We expect to move gradually from the present hybrid commissioning/observing mode to a dedicated observing mode over the next quarter. The first published data from the Northern survey are not expected until 2011, with the Southern survey data to follow in 2012.
5 CONCLUSIONS
The analog 4.5 to 5.5 GHz C-BASS receiver has been built and is installed at the Owens Valley Radio Observatory in California. A number of beam maps have been performed to verify the optical performance of the receiver. It is currently in a hybrid commissioning/observing mode, with the data reduction pipeline in active development. We present here a map in uncalibrated total intensity of the Cygnus region. We plan to build a second receiver with a digital spectral backend covering the same band for installation at the Southern telescope in South Africa. We expect to release the Northern survey data in 2011, with the Southern survey data to follow in 2012.
Acknowledgements.
The C-BASS project is a collaboration between Caltech/JPL in the US, Oxford and Manchester Universities in the UK, and Rhodes University and the Hartebeesthoek Radio Astronomy Observatory in South Africa. It is funded by the NSF (AST-0607857) and the participating institutions. We would like to thank the Xilinx University Programme for their donation of FPGAs to this project. http://www.astro.caltech.edu/cbass/References
- [1] Komatsu, E., Dunkley, J., Nolta, M. R., Bennett, C. L., Gold, B., Hinshaw, G., Jarosik, N., Larson, D., Limon, M., Page, L., Spergel, D. N., Halpern, M., Hill, R. S., Kogut, A., Meyer, S. S., Tucker, G. S., Weiland, J. L., Wollack, E., and Wright, E. L., “Five-year Wilkinson microwave anisotropy probe observations: Cosmological interpretation,” ApJS 180, 330 (2009).
- [2] Baumann, D., Jackson, M. G., Adshead, P., Amblard, A., Ashoorioon, A., Bartolo, N., Bean, R., Beltran, M., de Bernardis, F., Bird, S., Chen, X., Chung, D. J. H., Colombo, L., Cooray, A., Creminelli, P., Dodelson, S., Dunkley, J., Dvorkin, C., Easther, R., Finelli, F., Flauger, R., Hertzberg, M., Jones-Smith, K., Kachru, S., Kadota, K., Khoury, J., Kinney, W. H., Komatsu, E., Krauss, L. M., Lesgourgues, J., Liddle, A., Liguori, M., Lim, E., Linde, A., Matarrese, S., Mathur, H., McAllister, L., Melchiorri, A., Nicolis, A., Pagano, L., Peiris, H. V., Peloso, M., Pogosian, L., Pierpaoli, E., Riotto, A., Seljak, U., Senatore, L., Shandera, S., Silverstein, E., Smith, T., Vaudrevange, P., Verde, L., Wandelt, B., Wands, D., Watson, S., Wyman, M., Yadav, A., Valkenburg, W., and Zaldarriaga, M., “CMBPol mission concept study: Probing inflation with CMB polarization,” AIP Conf. Proc. 1141, 10–120 (2009).
- [3] Hu, W., Hedman, M. M., and Zaldarriaga, M., “Benchmark parameters for CMB polarization experiments,” Phys. Rev. D 67, 43004 (2003).
- [4] Rees, M. J., “Polarization and spectrum of the primeval radiation in an anisotropic universe,” AJ 153, L1 (1968).
- [5] Kamionkowski, M., Kosowsky, A., and Stebbins, A., “Statistics of cosmic microwave background polarization,” Phys. Rev. D (Particles) 55, 7368 (1997).
- [6] Zaldarriaga, M. and Seljak, U., “All-sky analysis of polarization in the microwave background,” Phys. Rev. D (Particles) 55, 1830 (1997).
- [7] Page, L., Hinshaw, G., Komatsu, E., Nolta, M. R., Spergel, D. N., Bennett, C. L., Barnes, C., Bean, R., Doré, O., Dunkley, J., Halpern, M., Hill, R. S., Jarosik, N., Kogut, A., Limon, M., Meyer, S. S., Odegard, N., Peiris, H. V., Tucker, G. S., Verde, L., Weiland, J. L., Wollack, E., and Wright, E. L., “Three-year Wilkinson microwave anisotropy probe (WMAP) observations: Polarization analysis,” ApJS 170, 335 (2007).
- [8] Readhead, A. C. S., Myers, S. T., Pearson, T. J., Sievers, J. L., Mason, B. S., Contaldi, C. R., Bond, J. R., Bustos, R., Altamirano, P., Achermann, C., Bronfman, L., Carlstrom, J. E., Cartwright, J. K., Casassus, S., Dickinson, C., Holzapfel, W. L., Kovac, J. M., Leitch, E. M., May, J., Padin, S., Pogosyan, D., Pospieszalski, M., Pryke, C., Reeves, R., Shepherd, M. C., and Torres, S., “Polarization observations with the cosmic background imager,” Science 306, 836 (2004).
- [9] Barkats, D., Bischoff, C., Farese, P., Fitzpatrick, L., Gaier, T., Gundersen, J. O., Hedman, M. M., Hyatt, L., McMahon, J. J., Samtleben, D., Staggs, S. T., Vanderlinde, K., and Winstein, B., “First measurements of the polarization of the cosmic microwave background radiation at small angular scales from CAPMAP,” AJ 619, L127 (2005).
- [10] Leitch, E. M., Kovac, J. M., Halverson, N. W., Carlstrom, J. E., Pryke, C., and Smith, M. W. E., “Degree angular scale interferometer 3 year cosmic microwave background polarization results,” AJ 624, 10 (2005).
- [11] Montroy, T. E., Ade, P. A. R., Bock, J. J., Bond, J. R., Borrill, J., Boscaleri, A., Cabella, P., Contaldi, C. R., Crill, B. P., Bernardis, P. D., Gasperis, G. D., Oliveira-Costa, A. D., Troia, G. D., Stefano, G. D., Hivon, E., Jaffe, A. H., Kisner, T. S., Jones, W. C., Lange, A. E., Masi, S., Mauskopf, P. D., Mactavish, C. J., Melchiorri, A., Natoli, P., Netterfield, C. B., Pascale, E., Piacentini, F., Pogosyan, D., Polenta, G., Prunet, S., Ricciardi, S., Romeo, G., Ruhl, J. E., Santini, P., Tegmark, M., Veneziani, M., and Vittorio, N., “A measurement of the CMB ¡EE¿ spectrum from the 2003 flight of BOOMERanG,” AJ 647, 813 (2006).
- [12] Sievers, J. L., Achermann, C., Bond, J. R., Bronfman, L., Bustos, R., Contaldi, C. R., Dickinson, C., Ferreira, P. G., Jones, M. E., Lewis, A. M., Mason, B. S., May, J., Myers, S. T., Oyarce, N., Padin, S., Pearson, T. J., Pospieszalski, M., Readhead, A. C. S., Reeves, R., Taylor, A. C., and Torres, S., “Implications of the cosmic background imager polarization data,” AJ 660, 976 (2007).
- [13] Haslam, C. G., Klein, U., Salter, C. J., Stoffel, H., Wilson, W. E., Cleary, M. N., Cooke, D. J. and Thomasson, P., “A 408 MHz all-sky continuum survey. I - Observations at southern declinations and for the North Polar region,” A&A 100, 209 (1981).
- [14] Jonas, J. L., Baart, E. and Nicolson, G., “The Rhodes/HartRAO 2326-MHz radio continuum survey,” MNRAS 297, 977 (1998).
- [15] Reich, W., “A radio continuum survey of the northern sky at 1420 MHz. I.” A&AS 48, 219 (1982).
- [16] Gold, B., Bennett, C. L., Hill, R. S., Hinshaw, G., Odegard, N., Page, L., Spergel, D. N., Weiland, J. L., Dunkley, J., Halpern, M., Jarosik, N., Kogut, A., Komatsu, E., Larson, D., Meyer, S. S., Nolta, M. R., Wollack, E., and Wright, E. L., “Five-year Wilkinson microwave anisotropy probe observations: Galactic foreground emission,” ApJS 180, 265–282 (2009).
- [17] Reich, P., Testori, J. C., and Reich, W., “A radio continuum survey of the southern sky at 1420 MHz. The atlas of contour maps,” A&A 376, 861 (2001).
- [18] Wolleben, M., Landecker, T. L., Reich, W., and Wielebinski, R., “An absolutely calibrated survey of polarized emission from the northern sky at 1.4 GHz,” arXiv astro-ph/0510456 (2005).
- [19] Jarosik, N., Bennett, C. L., Halpern, M., Hinshaw, G., Kogut, A., Limon, M., Meyer, S. S., Page, L., Pospieszalski, M., Spergel, D. N., Tucker, G. S., Wilkinson, D. T., Wollack, E., Wright, E. L., and Zhang, Z., “Design, implementation, and testing of the microwave anisotropy probe radiometers,” ApJS 145, 413 (2003).
- [20] Davis, R. J., Wilkinson, A., Davies, R. D., Winder, W. F., Roddis, N., Blackhurst, E. J., Lawson, D., Lowe, S. R., Baines, C., Butlin, M., Galtress, A., Shepherd, D., Aja, B., Artal, E., Bersanelli, M., Butler, R. C., Castelli, C., Cuttaia, F., D’Arcangelo, O., Gaier, T., Hoyland, R., Kettle, D., Leonardi, R., Mandolesi, N., Mennella, A., Meinhold, P., Pospieszalski, M., Stringhetti, L., Tomasi, M., Valenziano, L., and Zonca, A., “Design, development and verification of the 30 and 44 GHz front-end modules for the Planck low frequency instrument,” Journal of Inst. 12, 12002 (2009).
- [21] Mennella, A., Bersanelli, M., Seiffert, M., Kettle, D., Roddis, N., Wilkinson, A., and Meinhold, P., “Offset balancing in pseudo-correlation radiometers for CMB measurements,” A&A 410, 1089 (2003).
- [22] Imbriale, W. and Gama, E., “Antennas for the array-based deep space network: current status and future designs,” Aerospace Conference, 2005 IEEE , 1140 – 1149 (2005).
- [23] Holler, C. et al, “Circular symmetric antenna design with high polarization purity and low spillover,” (in prep.).
- [24] Grimes, P., King, O., Yassin, G., and Jones, M., “Compact broadband planar orthomode transducer,” Electronics Letters 43, 1146 – 1147 (2006).
- [25] Reichold, A. for the LiCAS Collaboration, “The LiCAS-RTSR - a survey system for the ILC,” in [Proceedings of the 10th biennial European Particle Accelerator Conference ], http://cern.ch/AccelConf/e06/PAPERS/MOPCH195.PDF (2006).
- [26] Davies, R. D., “On the nature of the Cygnus-X radio source as derived from observations in the continuum and at the hydrogen-line frequency,” MNRAS 117, 663 (1957).