Multiwavelength properties of a new Geminga-like pulsar: PSR J2021+4026
Abstract
In this paper, we report a detailed investigation of the multiwavelength properties of a newly detected ray pulsar, PSR J2021+4026, in both observational and theoretical aspects. We firstly identify an X-ray source in the XMM-Newton serendipitous source catalogue, 2XMM J202131.0+402645, located within the confidence circle of PSR J2021+4026. With an archival Chandra observation, this identification provides an X-ray position with arcsecond accuracy which is helpful in facilitating further investigations. Searching for the pulsed radio emission at the position of 2XMM J202131.0+402645 with a 25-m telescope at Urumqi Astronomical Observatory resulted in null detection and places an upper-limit of 0.1 mJy for any pulsed signal at 18 cm. Together with the emission properties in X-ray and ray, the radio quietness suggests PSR J2021+4026 to be another member of Geminga-like pulsars. In the radio sky survey data, extended emission features have been identified in the ray error circle of PSR J2021+4026. We have also re-analyzed the ray data collected by FERMI’s Large Area Telescope. We found that the X-ray position of 2XMM J202131.0+402645 is consistent with that of the optimal timing solution. We have further modeled the results in the context of outer gap model which provides us with constraints for the pulsar emission geometry such as magnetic inclination angle and the viewing angle. We have also discussed the possibility of whether PSR J2021+4026 has any physical association with the supernova remnant G78.2+2.1 (Cygni).
keywords:
stars: neutron: pulsars: individual (PSR J2021+4026)—supernovae: individual: (G78.2+2.1)1 Introduction
The successful launch of the FERMI Gamma-Ray Space Telescope has led us into a new era of high-energy astrophysics. The sensitivity of the Large Area Telescope (LAT) on the spacecraft is much higher than that of its predecessor, the Energetic Gamma-Ray Experiment Telescope on the Compton Gamma-Ray Observatory. This enables very efficient searches for ray pulsars. Shortly after its launch, it has already expanded the population of ray pulsars considerably (Abdo et al. 2009a,b,c). Abdo et al. (2009a) has further reported the detections of 16 pulsars with high significance in a blind search, including PSR J2021+4026.
The ray detection of PSR J2021+4026 was firstly reported in the FERMI bright source list with a signal-to-noise ratio (Abdo et al. 2009d). The nominal ray position of PSR J2021+4026 is located at the edge of the supernova remnant G78.2+2.1 (Abdo et al. 2009d; Green 2009). Using the first 6 months of the LAT data, the timing ephemerides of the pulsar were recently reported by Abdo et al. (2009c). It has a spin period of ms and a spin-down rate of s s-1. These spin parameters imply a characteristic age of kyr, a surface magnetic field of G and a spin-down luminosity of erg s-1.
Apart from studying the pulsar properties in the ray regime, the effort in searching for counterparts in other wavelengths is also very important. The broadband emission properties of pulsars, from radio to ray, are crucial in discriminating different competing models (e.g. see the recent reviews by Cheng 2009; Harding 2009). This will definitely shed detailed light on many unsettled debates, such as whether the high-energy emission and radio emission are originated from the same accelerating region.
In this paper, we report the results from the investigation of the multiwavelength properties of PSR J2021+4026. In Section 2, we describe the searches for the possible X-ray and radio counterpart for the pulsar with both archival and dedicated observations. We have also analyzed all the first-year ray data collected by LAT in order to constrain its spectral and temporal properties. In Section 3, we model the emission properties of PSR J2021+4026 in the context of the outer gap model. We have further discussed if it is possible that PSR J2021+4026 has any association with G78.2+2.1. Finally, we summarize our results in Section 4.
2 Data Analysis
2.1 X-ray analysis of the point sources in the error circle of PSR J2021+4026
In order to search for possible X-ray counterparts of PSR J2021+4026 detected in a blind search with FERMI LAT, we firstly cross-correlated the second XMM-Newton serendipitous source catalogue (hereafter XMM SSC) (Watson et al. 2009) with the FERMI LAT bright -ray source list, in which PSR J2021+4026 is denoted as 0FGL J2021.5+4026 (Abdo et al. 2009a). XMM SSC is the largest catalogue ever constructed in X-ray astronomy, which contains 221012 unique sources 111The incremental version of this catalogue is used throughout in this study which is available at http://xmmssc-www.star.le.ac.uk/Catalogue/xcat_public_2XMMi.html. In particular, we search for all the X-ray sources in XMM SSC which are located within its confidence circle.
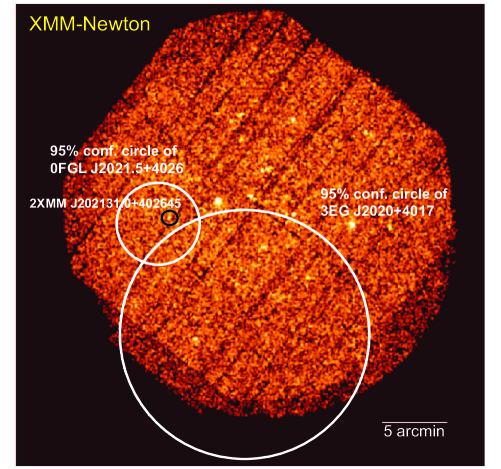
In this search, we have identified only one X-ray object, 2XMM J202131.0+402645, in the error circle of PSR J2021+4026 with a radius of . This X-ray source is located less than 1 arcmin away from the reported ray position of the LAT pulsar. The corresponding XMM-Newton observation was carried out on 1 December 2003 with MOS1/2 (Metal Oxide Semicondutor) and EPIC-PN (the European Photon Imaging Camera-Positive Negative) detectors operated in full frame mode (Obs. ID: 150960801). This observation was pointed to the geometrical center of the supernova remnant G78.2+2.1 with 2XMM J202131.0+402645 located arcmin off-axis. Examining this dataset for times of high background, we notice that this observation was contaminated by soft-proton flares. Cleaning the data by removing these flares results in the effective exposure of ks and ks in MOS1/2 and PN detectors respectively. The combined MOS1/2+PN image of the full field-of-view is displayed in Figure 1 with the error circles of PSR J2021+4026 and 3EG J2020+4017 illustrated. An arcmin2 close-up view centered at the nominal position of PSR J2021+4026 is displayed in Figure 2. 2XMM J202131.0+402645 is located just outside the confidence circle of 3EG J2020+4017 (see Fig. 1) which is the brightest unidentified -ray source discovered by EGRET (Hartman et al. 1999).

Searches for X-ray counterparts of 3EG J2020+4017 have been reported by Becker et al. (2004) and Weisskopf et al. (2006) with Chandra Advanced CCD Imaging Spectrometer (ACIS) spectro-imaging observations. The observation made by Weisskopf et al. (2006) partly covered the error circle of PSR J2021+4026. This Chandra ACIS-I observation took place on 6 February 2005 with an effective exposure time of ksec (Obs. ID: 5533). The ACIS-I image centered at the nominal ray position of PSR J2021+4026 is displayed in Figure 3, which has the same field-of-view as that in Figure 2. The position of source S21 (as labeled in Weisskopf et al. 2006) is found to be consistent with that of 2XMM J202131.0+402645, and hence we concluded that they are the same object. As it is located outside the error circle of 3EG J2020+4017, it did not receive enough attention in Weisskopf et al. (2006).
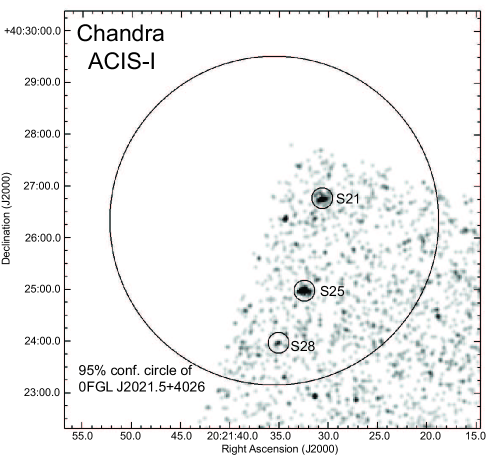
We note that two other X-ray sources detected by Weisskopf et al. (2006), namely S25 and S28 in their paper, are also found to be located within the error circle of PSR J2021+4026 (see Fig. 3). As a number of important parameters in characterizing these sources, such as the estimate of the source extent and the spectral properties, were not reported by Weisskopf et al. (2006), we decided to re-analyze this dataset. We have independently performed the source detection with the Chandra data by means of a wavelet algorithm. To constrain their source positions accurately, aspect offset, which is a function of the spacecraft roll angle, has been carefully checked and corrected prior to the analysis. The source detection reports the signal-to-noise ratios of S21, S25 and S28 to be , and respectively. All three sources are found to have their spatial extents comparable with the estimated size of the point spread function (PSF) at their off-axis angles in the CCD. Therefore, based on this Chandra observation, no evidence for any extended structure is found to associate with these sources.
We noted that the X-ray emission from S25 is found to be highly variable in the exposure of Chandra (see Figure 4). Its long-term variability is further supported by the non-detection of any source at its position in the XMM-Newton observation. S28 is a faint X-ray source close to the detection threshold and found to have an optical counterpart (cf. Weisskopf et al. 2006). These properties make these two sources very unlikely have any association with a neutron star/rotation-powered pulsar (see the discussion in Hui & Becker 2009). On the other hand, no optical counterpart has been identified with S21 (cf. Tab. 5 in Weisskopf et al. 2006). Also, we do not find any convincing evidence of temporal/spectral variability for this source. Therefore, with the existing data, S21 remains to be the only promising X-ray counterpart of PSR J2021+4026 located in the confidence circle of the -ray pulsar.

Utilizing the Chandra data, the X-ray position of S21 is constrained to be RA (J2000) , Dec (J2000) . The corresponding positional error in each direction reported by our source detection are RA=1.11” and Dec=0.73” respectively. To avoid under-estimating the uncertainties, we have to further consider the nominal pointing uncertainty of the spacecraft. The uncertainty can be estimated from the distribution of aspect offset for a sample of point sources with accurately known celestial positions222http://cxc.harvard.edu/cal/ASPECT/celmon/. There is of 70 sources imaged on ACIS-I have offsets smaller than . We adopted this value as the astrometric uncertainty and added to the aforementioned quoted errors in quadrature for each coordinate. This gives the resultant positional errors as RA=1.18” and Dec=0.84”.
Although the search for the optical counterpart of S21 by Weisskopf et al. (2006) yield null-detection, we independently looked for any optical identification of this X-ray source in the United States Naval Observatory (USNC)-B1.0 catalogue (Monet et al. 2003) and the Digitized Sky Survey with the improved X-ray position. Within our estimated X-ray positional uncertainty, we cannot identify any optical counterpart of S21 down to the limiting magnitude of USNO-B1.0 catalogue (i.e. 21; cf. Monet et al. 2003). This confirms the result reported by Weisskopf et al. (2006).
To examine the X-ray emission nature of 2XMM J202131.0+402645 (S21), we make use of both XMM-Newton and Chandra observations that cover it. We extract the source counts from a circle with a radius of 15 arcsec and 20 arcsec in Chandra and XMM-Newton datasets respectively. The extraction regions are chosen to optimize the signal-to-noise ratio which correspond to an encircled energy fraction of and at its location in the corresponding detectors in Chandra and XMM-Newton respectively. The background spectrum is extracted from a nearby source-free circular region with a radius of 40 arcsec in the corresponding detectors. After the background subtraction, there are and net source counts available from the Chandra and XMM-Newton respectively. We compute the response files with the XMMSAS tasks RMFGEN and ARFGEN for XMM-Newton and with the CIAO tools MKACISRMF and MKARF for Chandra.
With the aids of PIMMS, we can compare the count rates from different detectors. Adopting the best-fit spectral parameters (cf. Tab. 1), we found the count rates obtained from different detectors are consistent. However, as the parameters are poorly constrained, it is difficult to properly constrain the source variability. While the nominal observed flux is about erg cm-2 s-1, the upper limit is at the level of erg cm-2 s-1. Therefore, ascribing to the limited photon statistics of the existing data, we are not able to unambiguously conclude whether there is any flux variability from 2XMM J202131.0+402645.
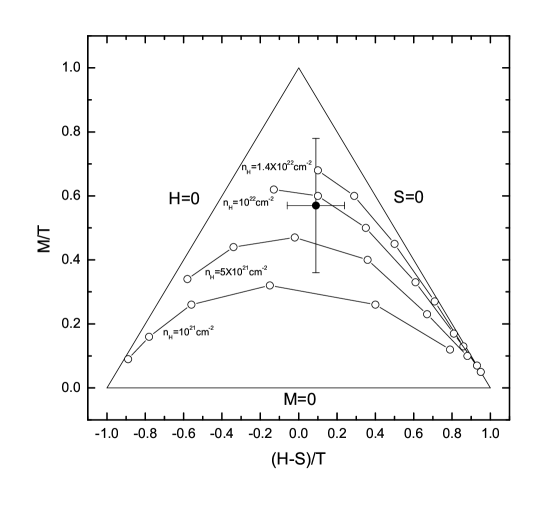
To further investigate whether this source is a promising pulsar candidate, we examined its hardness ratio and constrain its properties by means of a color-color diagram with the combined net counts obtained from both satellites. Following Elsner et al. (2008), we used three energy bands in this analysis ( keV), ( keV) and ( keV). Figure 5 shows the plot of versus , where is the energy band keV. The filled circle with the error bars attached represents the location of 2XMM J202131.0+402645 in this plot. We have also computed the predicted values for a power-law spectrum with photon index varying from to for different values of hydrogen column absorption. The results are plotted as the curves in Figure 5. By definition, all classes of X-ray sources should lie in the triangular boundary formed by . The soft sources which lie close to the line are most likely field stars in the Milky Way, and the hard sources lie close to the line are likely the background active galactic nuclei (AGNs) or pulsars with non-thermal dominant X-ray emission. 2XMM J202131.0+402645 is marginally located at the right side of the color-color diagram yet close to the center. Its hardness is found to be too hard for a field star. On the other hand, its location in the color-color diagram shows that it is modeled by a power-law with photon index generally larger than 3. This suggests that the X-ray emission of 2XMM J202131.0+402645 is unlikely to be non-thermal dominant. The same inference is obtained from the spectral analysis (see below).
Owing to the small numbers of the collected photons, we adopt the statistic (Cash 1979) for the spectral analysis which is insensitive to the binning. The spectral analysis is performed with XSPEC 12.5 in the energy band of keV and keV for the data obtained from XMM-Newton and Chandra respectively. In view of the small photon statistics, we limited our spectral analysis with simple single component model. The best-fit parameters of all the tested models are tabulated in Table 1. All the quoted uncertainties of the parameters are with 1 parameter of interest.
We found that a single power-law model yields a photon index of which is found to be too steep to be physically reasonable. The large value does suggest the X-ray emission from 2XMM J202131.0+402645 is rather soft which is consistent with the inference resulted from the aforementioned hardness analysis.
We have also fitted the spectrum with thermal plasma models, namely MEwe-KAstra-Liedahl (MEKAL) and thermal bremsstrahlung. MEKAL is the code that models the plasma in collisional ionization equilibrium which is widely utilized to describe the shock-heated plasma of early-type stars (e.g. Sana et al. 2007; Stelzer et al. 2005). With the metal abundances fixed at solar values, the model yields a plasma temperature of keV. However, we note that there are systematic fitting residuals in keV. Repeating the analysis with metal abundances at and of the solar values, we found the systematic residuals still present. Furthermore, the inferred column density is which is found to be higher than the total Galactic neutral hydrogen absorption of (Dickey & Lockman 1990), unless the metal abundance is below of the solar values. It is possible that multiple temperature model might improve the fitting. Nevertheless, the limited photon statistic does not allow us to do so with the existing data. In view of its inadequacy in modeling the X-ray spectrum, we will no longer consider this model further in this paper.
For the thermal bremsstrahlung model, it provides a better description of the data in comparison with MEKAL. This model provides the description of the continuum of the coronal emission from a late-type star, which is presumably heated by the magnetic reconnection (cf. Dopita & Sutherland 2003). It yields a plasma temperature of keV. The unabsorbed flux inferred by the best-fit model is erg cm-2 s-1 in keV. If the X-ray emission is indeed from a late-type star, the upper-bound of its distance is estimated to be pc by comparing the best-fit flux to the saturated X-ray luminosity of erg s-1 for the late-type stellar population (Pizzolato et al. 2003). Adopting this estimate, we convert the limiting magnitude, , of the USNO catalog to an absolute magnitude of which suggests the star should not be more massive than a M-star. A deeper optical observation will certainly provide a key role in confirming or refuting this scenario.
For the blackbody model, assuming the source is a pulsar, it provides a description for the polar cap heating from the return current in the outergap (Cheng & Zhang 1999). The blackbody model yields an effective temperature of keV. Interestingly, this value is well consistent with the theoretical value of the polar cap temperature computed by the outergap model (i.e. equation 58 in Cheng & Zhang 1999), which is 0.34 keV for the rotational period and the magnetic field of PSR J2021+4026. The X-ray spectrum of 2XMM J202131.0+402645 with the best-fit absorbed blackbody model is displayed in Figure 6. The best-fit parameters of the blackbody model yield an unabsorbed flux of erg cm-2 s-1 in keV. Comparing the best-fit X-ray flux with the ray flux (see below), the flux ratio is found to be which is consistent with the typical values of ray pulsars (e.g. Geminga). On the other hand, with the limiting magnitude of , the nominal X-ray-to-optical flux ratio is . This appears to be higher than that of a field star which typically has a ratio (Maccacaro et al. 1988). However, simply on the basis of the X-ray-to-optical flux ratio, the limit found for 2XMM J202131.0+402645 is too low to rule out the possibility of an AGN which typically has a ratio of (Stocke et al. 1991). Therefore, a deep optical observation would be important to tightly constrain its source nature.
Although the blackbody model can yield a physically reasonable best-fit temperature and the flux for the interpretation of pulsar emission, one should notice that the spectral parameters and hence the fluxes are poorly constrained. Therefore, and cannot be tightly determined. Hence, we have to admit that the source nature of 2XMM J202131.0+402645 cannot be determined unambiguously. In the spectral analysis, we are not allowed to discriminate the pulsar interpetation from that of a star. As the flux variability cannot be well-constrained with the existing data, we also cannot completely exclude the possibility of the source as an AGN. To further probe its X-ray emission nature, besides the aforementioned deep optical observation, a dedicated X-ray observation is very important in constraining the spectral properties, variability, as well as the flux ratios with respect to the ray and optical results.
Apart from yielding the physically reasonable temperature and the flux for the interpretation of pulsar emission, the blackbody model also provides relatively the least residuals among all the tested models though cannot be discriminated unambiguously with the small number of counts. In view of these merits, we are going to use the results inferred from this model for further discussion in Section 3.
The robustness of the results quoted in this paper is checked by repeating the analysis by incorporating the background spectrum sampled from different source-free regions. It is found that within the confidence intervals the spectral parameters inferred from independent fittings are all consistent with each other.
| Model a | stat | D.O.F. | / | (0.3-10 keV) | |
|---|---|---|---|---|---|
| cm-2 | / keV | erg cm-2 s-1 | |||
| BB | 7.42 | 11 | |||
| BREMSS | 7.64 | 11 | |||
| PL | 8.09 | 11 | |||
| MEKAL | 8.63 | 11 |
a PL = power-law; BB = blackbody; BREMSS = thermal bremsstrahlung;
MEKAL = hot diffuse gas model based on Mewe et al. (1985, 1986), Kaastra (1992) and Liedahl (1995)

Although the detection of X-ray pulsations at the location of 2XMM J202131.0+402645 would provide us an unambiguous evidence that it is associated with a ray pulsar, the small photon statistics and the large frame time of the existing data do not allow any meaningful timing analysis.
2.2 Radio observations of PSR J2021+4026
2.2.1 Coherent radio pulsation search
The identification of 2XMM J202131.0+402645 as a possible X-ray counterpart of PSR J2021+4026 does provide us a position with arc-second accuracy. This is very helpful in facilitating further multiwavelength investigations. With this precise position, we have searched for any coherent radio pulse emission.
The radio pulsation search at the position of 2XMM J202131.0+402645 has been carried out by using the 25-m radio telescope at Nanshan, operated by Urumqi Astronomical Observatory (UAO). The observing system has a dual-channel cryogenic receiver that receives orthogonal linear polarizations at 18 cm. After mixing down to an intermediate frequency, the two polarizations are each fed into a filter bank of 128 contiguous channels, each of width 2.5 MHz. The outputs from the channels are then square-law detected, filtered and one-bit sampled at 0.5 ms interval. The data streams of all 256 channels are written to disk for subsequent off-line processing. For more details about this system, please refer to Wang et al. (2001).
In our observation, we did not find any convincing signal and we placed an upper-limit for any pulsed radio emission of 0.1 mJy at the position of 2XMM J202131.0+402645.
2.2.2 Search for radio emission feature from NRAO/VLA Sky Survey (NVSS)
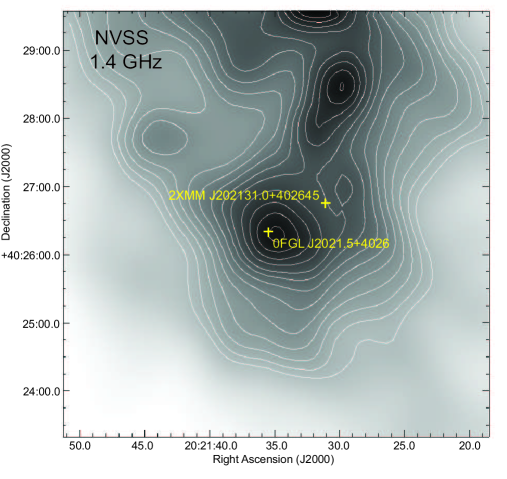
We have also searched for any radio counterpart for PSR J2021+4026 with the data from the NVSS database. (Condon et al. 1998). Interestingly, we have identified radio excesses within the ray error circle of PSR J2021+4026 (see Figure 7). A arcmin2 close-up view centered on the nominal ray position of PSR J2021+4026 reported in Abdo et al. (2009a) is displayed in Figure 8. Radio contours calculated at the levels between mJy/beam are overlaid. We have identified a feature with a size of about 3 arcmin1.5 arcmin in the center of this radio map. The peak of this radio feature is found to be at the south-east from the position of 2XMM J202131.0+402645. Apart from the aforementioned feature, another radio excess extends for arcmin from 2XMM J202131.0+402645 to the north-west. Adopting the FWHM of the beam and the rms fluctuation of the image of 45 arcsec and 0.45 mJy/beam respectively (cf. Condon et al. 1998), we estimated the flux densities at 1.4 GHz of the southeastern and the northwestern features to be mJy and mJy respectively. These correspond to ergs cm-2 s-1 and ergs cm-2 s-1 for an effective bandwidth of 42 MHz respectively.
It is interesting to notice that 2XMM J202131.0+402645 is located approximately in between this two features. If such alignment is confirmed, this will suggest a possible bipolar outflow from the pulsar. Unfortunately, the limited angular resolution of NVSS data does not allow us to conclude this possible alignment. Future observation with the dedicated high resolution aperture synthesis by VLA can help us to confirm (or refute) this suggested scenario.

2.3 ray analysis of PSR J2021+4026
With the already publicly available data of the FERMI ray LAT All-Sky survey we have carried out an analysis of PSR J2021+4026 centered at the accurate X-ray position derived by analyzing Chandra data (see Sec 2.1). We have studied its ray spectral and temporal properties in details. In order to get the most significant results for the spectral analysis we took all available events from the start of the LAT All-Sky survey 4 August 2008 until 26 September 2009, which leads to a total effective exposure time of 13246 ksec as the observatory scans the entire sky once every three hours. Events have been chosen in the energy range of 100 MeV to 300 GeV as the effective area is changing rapidly with energy at less then 100 MeV and because of residual uncertainties in the instrument response (Porter 2009). For general filtering purposes of the extracted data we used the LAT Pass6 Version 3(P6_V3) instrument response functions as we are interested in point source analysis. We extracted the events within a circle of radius centered at 2XMM J202131.0+402645 in order to minimize the contamination by other sources and kept the photon containment fraction for photons with energies GeV. We have further excluded the events with a zenith angle larger than 105∘ as recommended by the standard filtering of the FERMI data group 333Please refer to http://fermi.gsfc.nasa.gov/ssc/ for further details.. This is due to the fact that the maximum zenith angle selection is applied to exclude time periods when the region of interest is too close to the Earth’s limb, resulting in elevated background levels. We finally ensured that only diffuse class photons were used by setting event_class=3. Good time intervals have been chosen by using the spacecraft data file to ignore all events acquired during the passage of the South Atlantic Anomaly and allow only data_qual=1 events. After filtering for diffuse background emission there are 22162 total source counts available.
As PSR J2021+4026 is the brightest of the 16 newly found pulsars by LAT we were able to study its spectrum with superior photon statistic (Abdo et al. 2009a). We notice that the data above 10 GeV are highly fluctuated which can possibly be due to the fact of a non-negligible background contamination from charged particles.444cf. http://fermi.gsfc.nasa.gov/ssc/data/analysis/LATcaveats.html With these considerations, we choose an energy range of GeV for the spectral analysis. The response file was computed using the gtrspgen task and the spectrum was grouped with a binning of 100 logarithmically uniform energy bins.
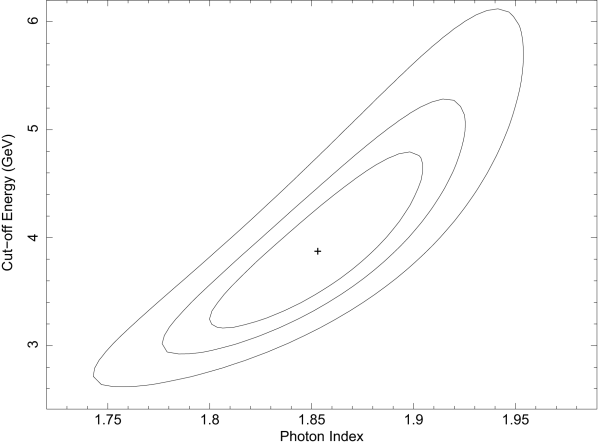
The ray spectrum of PSR J2021+4026 can be well-described by an exponentially cut-off model with of 0.9997 for 97 degrees of freedom (see Figure 9). The best-fit model yields a photon index of with a cut-off energy GeV. The given errors are at the 1 confidence level for single parameter.
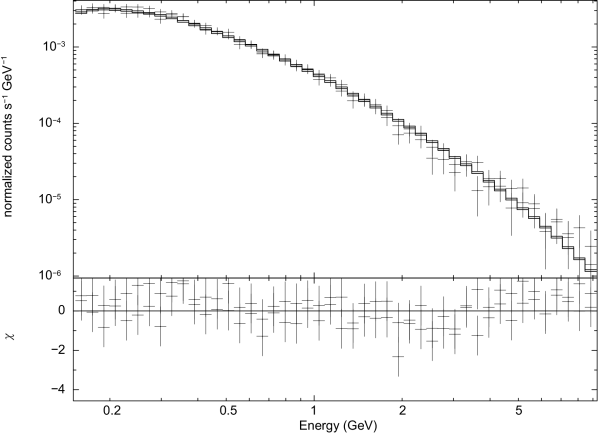
We have also computed the error contours to demonstrate the relative parameter dependency of the photon index versus the cut-off energy and plotted this in Figure 10. Taking these parameters into consideration the ray flux is found to be erg cm-2 s-1 in the range of GeV. The spectral properties inferred from the whole-year LAT data are consistent with those reported by Abdo et al. (2009c) within .
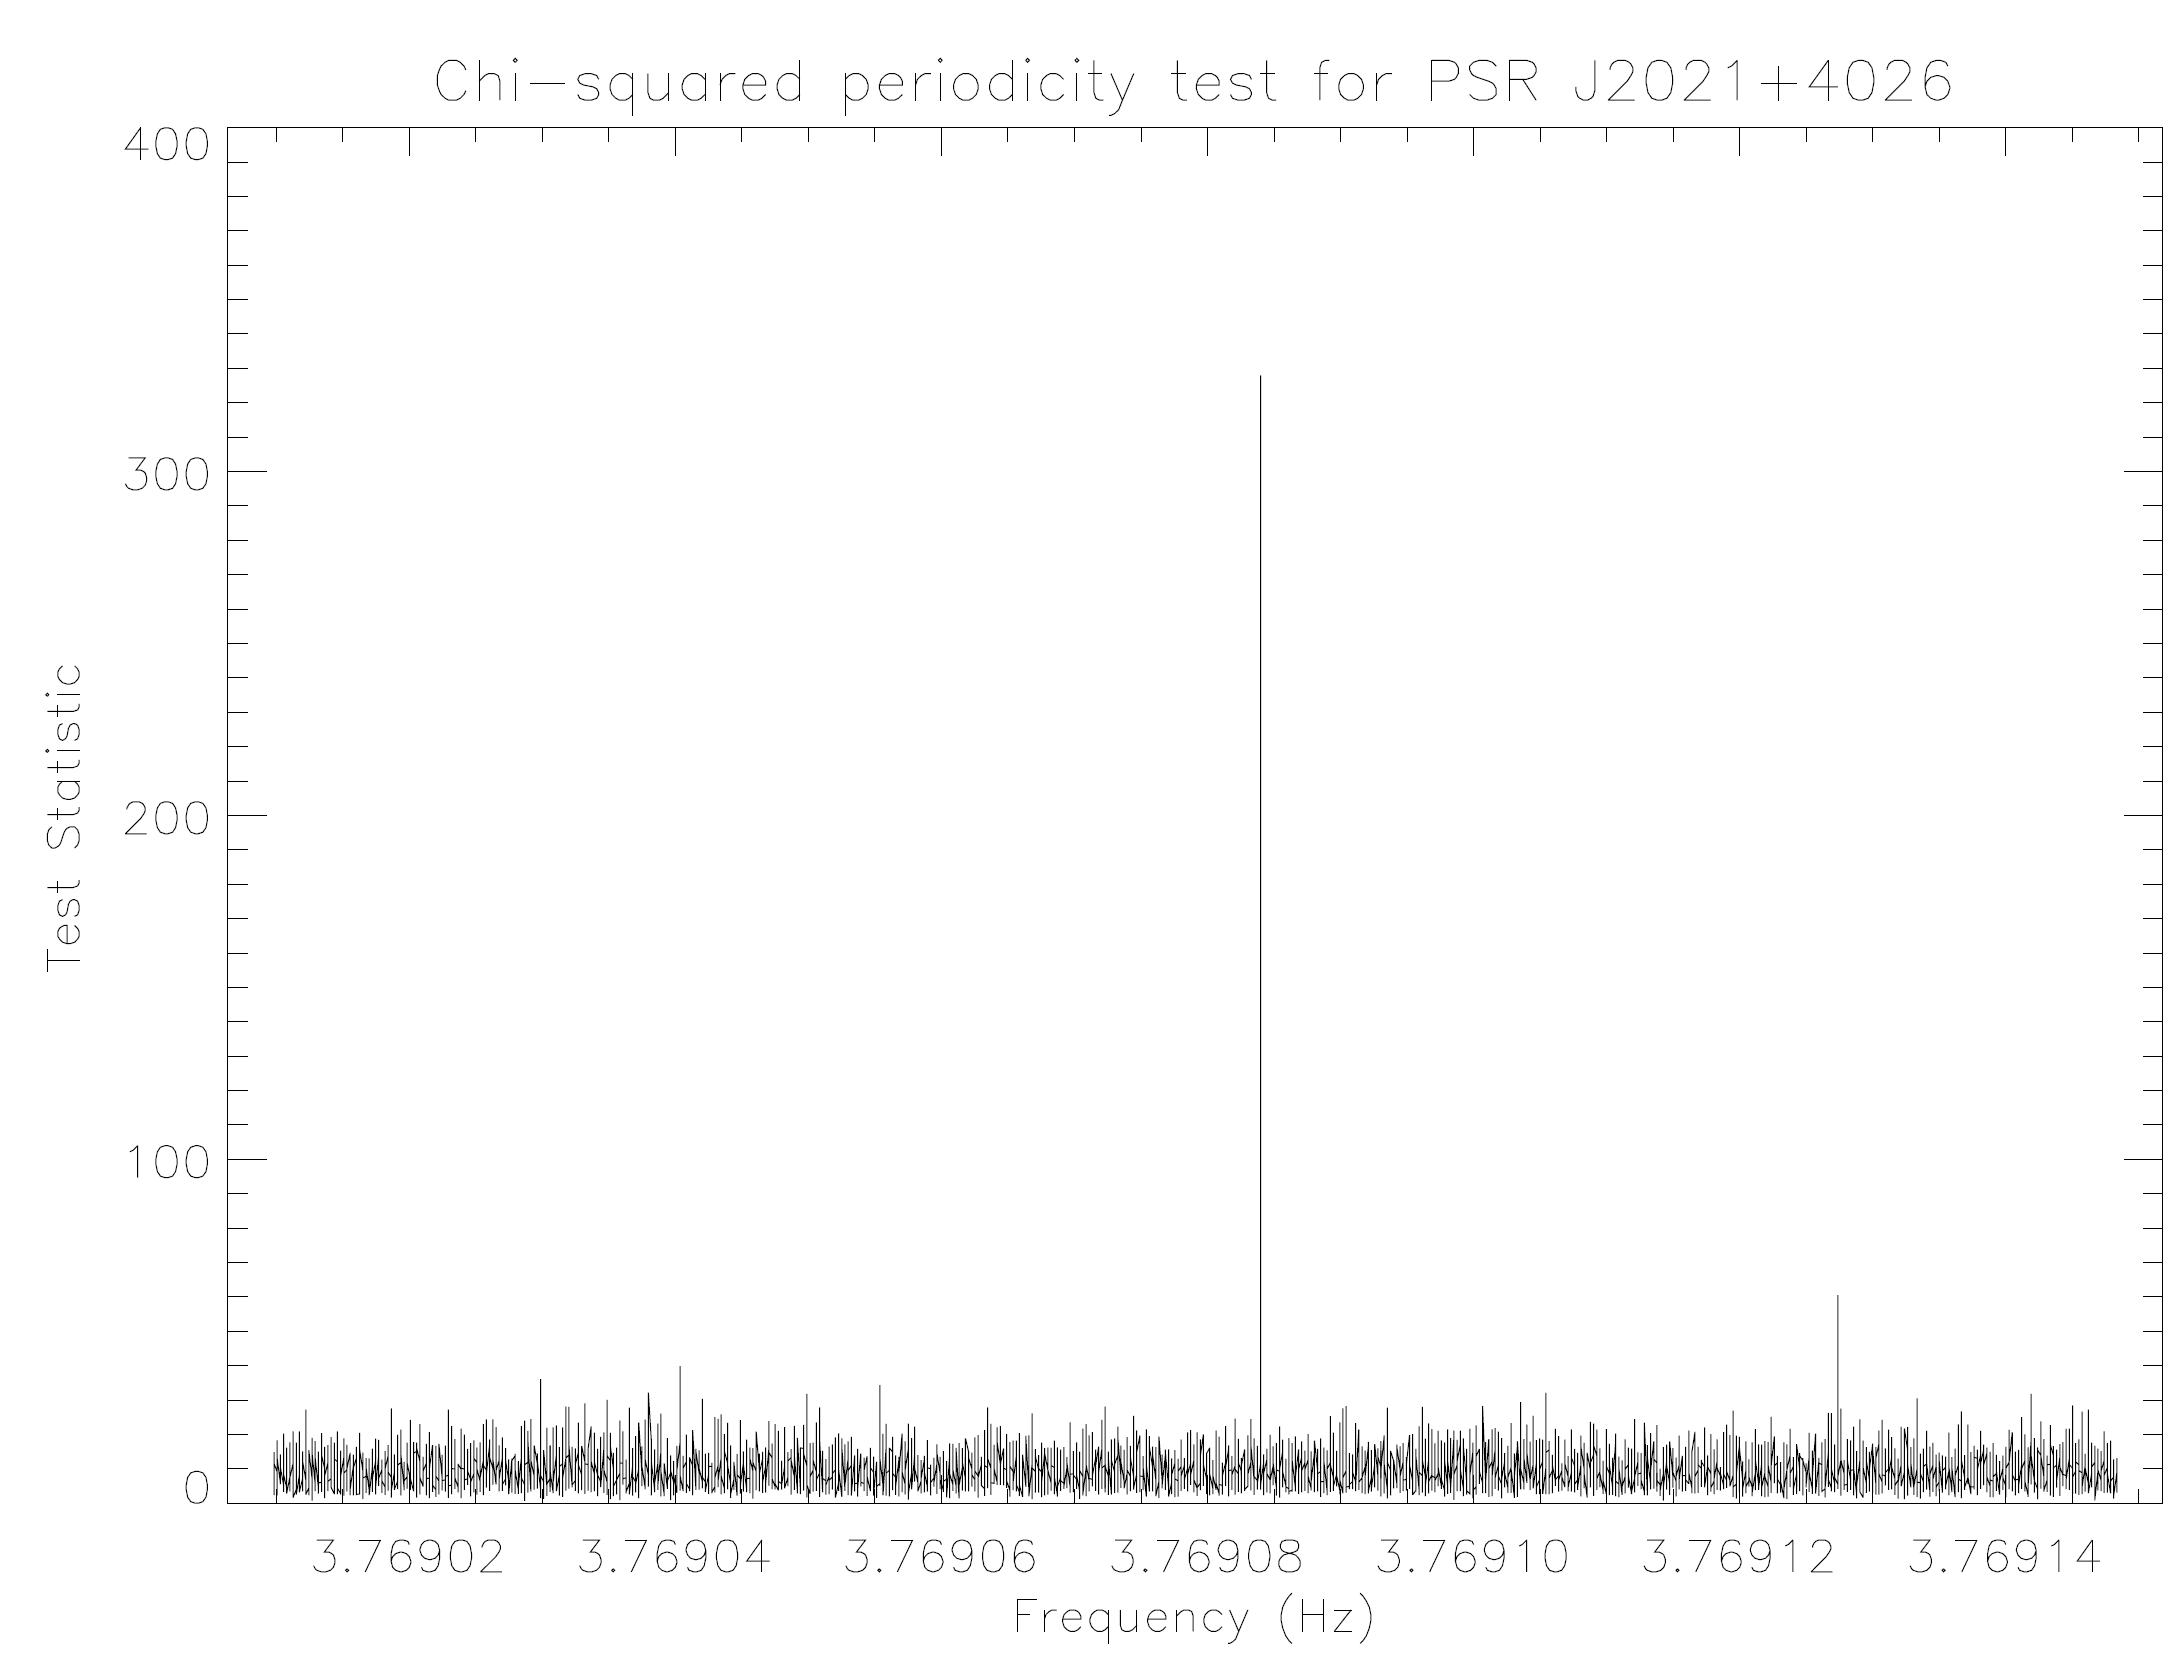
To further investigate the nature of PSR J2021+4026, we have independently performed a temporal analysis. The results of this analysis will be further taken as inputs for a modeling in the context of outergap model in §3. We have iterated the temporal analysis with different sizes of extraction region. We found that the signal-to-noise ratio of the pulse profile is optimized with an extraction radius of 1∘, therefore we adopted this region for the subsequent analysis. The retrieved event file was then processed in the same way as aforementioned with events in the energy range of 0.1 GeV - 300 GeV. For the barycentric correction, we adopt the precise position provided by 2XMM J202131.0+402645. For the pulsation search the gtpsearch task of the FERMI analysis software was used with the test statistics. We used 10 phase bins for the test with a step size of 0.5 in units of Fourier resolution that lead us to a number of 5000 independent trials. By checking a frequency range from 3.76885824639721 to 3.76929999373175 Hz and using Hz s-1 we found the most probable frequency to be 3.76908389(3) Hz at a test statistic of with 9 degree of freedom (see Figure 11). The number in the parenthesis is the uncertainty of the last digit of the quoted frequency which corresponds to the Fourier resolution. We have also performed the analysis by combining test and test, where is the numbers of harmonics (Buccheri et al. 1983; De Jager, Swanepoel, & Raubenheimer 1989). With this independent analysis, we reported the periodic signal with a frequency equal to the aforementioned. Using the -test, we found that is maximized for 2 harmonics. The calculated is 309.7 which implies a nominal chance probability of .
We have also repeated the analysis with different positions within the ray error circle adopted for barycentric correction. Among all the tested positions, the X-ray position of 2XMM J202131.0+402645 results in the best test statistics. For example, the nominal ray position provided by Abdo et al. (2009a) results in a of 280.9 which is lower than that resulted from adopting the X-ray position. This provides another support for the possible association between 2XMM J202131.0+402645 and PSR J2021+4026.
The ray pulse profile folded at the aforementioned period is shown in Figure 12. We found that PSR J2021+4026 has a double peaked light curve with the peak separation of or , depending on which peak is leading. In computing the pulsed fraction of the resultant light curve, we found that about 54% of the collected photons are pulsed. This light curve provides us a crucial input for modeling the emission geometry of this pulsar (see below).

With the data collected from a period somewhat longer than one year, it is also instructive to investigated if there is any unusual spin-down behavior of PSR J2021+4026, such as glitches. We have divided the data into segments with equal time-span and analyzed these sub-datasets independently. Our inferred spin-down rate is found to be steady and fully consistent with the value reported by Abdo et al. (2009c). Therefore, we concluded that there is no evidence for any unusual spin-down behavior of PSR J2021+4026 in the last year. Therefore, the frequency derivative is fixed at Hz s-1 throughout the aforementioned analysis.
3 Discussion

3.1 Viewing geometry
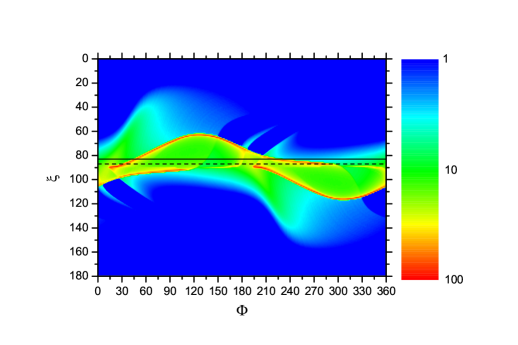
Figures 13 and 14 represent the phase-plots of the -ray emissions from the outer gap accelerator (e.g. Tang et al. 2008) for the inclination of and , respectively. The color represents the intensity of the emissions. In the model, we assume that the outer gap extends between the radial distance of ten times the stellar radius and the light radius.
The -ray emission from PSR J2021+4026 is observed with double peak structure with a wide phase separation between the two peaks (Figure 12). On the other hand, because of the lack of radio pulses from PSR J2021+4026, there is an ambiguity on the phase separation of the two peaks in -ray emission, that is, or , depending on which peak is leading. With the phase-separation of or , the outer gap accelerator model predicts the viewing angle close to . For example, if we assume the inclination angle of , the viewing angles of (solid horizontal line in Figure 13) and (dashed horizontal line) provide the phase-separation of and , respectively. For the inclination angle , the phase-separation of can be explained by the viewing angle of , while the phase-separation of can not be produced by any viewing angle. Although the observed large phase-separation can constrain the viewing angle close to , a wide range of the viewing angle is allowed. To resolve the ambiguity on the inclination angle, it will require a more detailed study (in particular the spectrum) of the -ray emission, which will be a purpose of the subsequent theoretical paper.
3.2 Association among PSR J2021+4026, 2XMM J202131.0+402645 and SNR G78.2+2.1
PSR J2021+4026 is a very bright newly uncovered ray pulsar. The non-detection of any radio pulsed signal and its high energy emission properties suggest the pulsar to be another example of Geminga-like pulsars. Recent observations with the Milagros ray Observatory have found a TeV excess in the error circle of PSR J2021+4026 (Abdo et al. 2009e). The reported TeV flux of this feature is TeV-1 cm-2 s-1. The presence of the multiwavelength features from radio to TeV regime have further made it an interesting target. PSR J2021+4026 and X-ray source, 2XMM J202131.+402645 can be observed at vicinity of the edge of the supernova remnant (SNR) G78.2+2.1, which may be the origin of the TeV emission. In the following, we will argue that the present results of the X-ray and -ray analysis indicate an association among PSR J2021+4026, 2XMM J202131.+402645 and SNR G78.2+2.1.
First we discuss the ages of SNR G78.2+2.1 and PSR J2021+4026. Using ASCA observations, Uchiyama et al. (2002) deduced the shock velocity of the shell of SNR G78.2+2.1 to be 800 . Given the angular size of and distance kpc (Landecker, Roger & Higgs 1980), the adiabatic age gives 6.6(d/1.5kpc) kyr, which is in agreement with the age deduced from the optical observations (Mavromatakis 2003). We find that the age of SNR G78.2+2.1 is about one order magnitude smaller than the spin-down age of kyr for PSR J2021+4026. However, the discrepancy between the real age and the spin down age may be expected, if PSR J2021+4206 was born with a spin period close to current one. It can be expected that PSR J2021+4026 is much younger than the age inferred from the spin down age, such as PSR J0538+2817, which has a spin down age of 620 kyr, but its true age is 40 kyr (Ng et al. 2007). Therefore, the discrepancy between the age of SNR G78.2+2.1 and the spin down age of PSR J2021+4026 does not imply that PSR J2021+4026 and the supernova remnant G78.2+2.1 are not associated with each other.
In fact, we expect that SNR G78.2+2.1 and PSR J2021+4026 are associated with each other, as follows. First, adopting the distance kpc to PSR J2021+4026, the efficiency, , which is defined by the ratio between -ray luminosity and spin down luminosity, is provided as , where is the solid angle. This large efficiency with the distance is consistent with the typical value of the efficiency of the middle spin-down age pulsars such as Geminga, which has . Therefore, the distance to the SNR G78.2+2.1 provides a consistent efficiency with the spin down age. Secondly, PSR J2021+4026 is located arcmin off-axis from the geometrical center of SNR G78.2+2.1. Assuming that off-axis of the location of PSR J2021+4026 is caused by the proper motion in the space, the space velocity of PSR J2021+4026 is estimated to be km/s, which is a typical velocity of observed pulsars (Hansen & Phinney 1997; Hobbs et al. 2005). On these ground, the association between PSR J2021+4026 and SNR G78.2+2.1 is more likely.
Finally, we briefly discuss the association between 2XMM J202131.+402645 and PSR J2021+4026. First, only 2XMM J202131.+402645 is a persistent and relatively bright -ray source located within the 95% ray error circle of PSR J2021+4026 (see section 2). Second, the nominal X-ray flux in 2-10 keV, , of 2XMM J202131.+402645 provides a X-ray luminosity of , where is the solid angle divided by . Comparing the X-ray luminosity of other pulsars (e.g. Possenti et al. 2002), we find that the X-ray luminosity of 2XMM J202131.+402645 is consistent with typical values of the pulsars which have a spin down luminosity similar to that of PSR J2021+4026, erg/s. It is also found that the ratio of the X-ray flux of 2XMM J202131.+402645 deduced from the best-fit blackbody model and -ray flux of PSR J2021+4026, , is consistent with typical values of -ray pulsars with a middle spin-down age like Geminga. On these ground, we suggest that 2XMM J202131.+402645 is the plausible X-ray counter part of PSR J2021+4026.
Although the interpetation of the pulsar nature is tempting, we have to emphasize that small photon statistics of the existing data does not allow us to confirm this unambiguously. Specifically, we cannot tightly constrain the aforementioned flux ratios, spectral parameters as well as the variability. Therefore, we have to admit that we cannot exclude the possible nature of 2XMM J202131.0+402645 as a star or an AGN. Dedicated X-ray and optical observations are most important in discriminating these competing X-ray emission scenarios. Obviously, if X-ray pulsations that consistent with the rotational period of PSR J2021+4026 can be detected in the future, this will certainly provide the most decisive nature of 2XMM J202131.0+402645.
4 Summary
In this study, we have investigated the multiwavelength emission nature of PSR J2021+4026 in details. Searching for the X-ray counterparts of this new and bright ray pulsar, we have identified 2XMM J202131.0+402645 as the promising candidate. We have also examined the ray data collected by FERMI LAT with an exposure somewhat more than one year and tightly constrained its spectral and temporal properties in MeVGeV regime. We found that the X-ray position of 2XMM J202131.0+402645 is consistent with that of the optimal timing solution. We have further modeled the ray light curve in the context of outer gap accelerator model and provided constraints on its emission geometry. The nominal X-ray–to–-ray flux ratio of PSR J2021+4026 is found to resemble that of Geminga. Furthermore, if PSR J2021+4026 was born with a spin period close to the current one, it is likely to be born in the explosion that created SNR G78.2+2.1 and has a projected kick velocity of few hundred km/s which is typical for the known pulsar population. At the distance of SNR G78.2+2.1, the conversion efficiencies in ray and X-ray of this pulsar are both found to be consistent with those of Geminga. Together with the non-detection of any pulsed radio signals, the high energy emission properties of PSR J2021+4026 suggest it to be a new member of Geminga-like pulsars.
Acknowledgments
LT would like to thank DFG for financial support in SFB TR 7 Gravitational Wave Astronomy and the members of the neutron star group at AIU for fruitful discussions and useful comments. KSC is supported by a GRF grant of Hong Kong Government under HKU700908P. The authors would like to thank C.Y. Ng for useful discussion.
References
- (1) Abdo, A. A. et al., 2009a, Science, 325, 840
- (2) Abdo, A. A. et al., 2009b, Science, 325, 848
- (3) Abdo, A. A. et al., 2009c, submitted to ApJS (arXiv:0910.1608v2)
- (4) Abdo, A. A. et al., 2009d, ApJS, 183, 46
- (5) Abdo, A. A. et al. 2009e, ApJ, 700, L127
- (6) Becker, W. et al., 2004, ApJ, 615, 897
- (7) Buccheri, R. et al., 1983, A&A, 128, 245
- (8) Cash, W., 1979, ApJ, 229, 939
- (9) Cheng, K. S., 2008, in W. Becker ed., Astrophysics and Space Science Library, Neutron Stars and Pulsars, Springer, Berlin, p.481
- (10) Cheng, K. S., & Zhang, L. 1999, ApJ, 515, 337
- (11) Condon, J. J. et al., 1998, AJ, 115, 1693
- (12) De Jager, O. C., Swanepoel, J. W. H., & Raubenheimer, B. C. 1989, A&A, 221, 180
- (13) Dickey, J. M., & Lockmann, F. J., 1990, ARA&A, 28, 215
- (14) Dopita, M. A., & Sutherland, R. S. 2003, Astronomy and Astrophysics Library Astrophysics of the Diffuse Universe, Springer, Berlin
- (15) Elsner, R. F. et al., 2008, ApJ, 687, 1019
- (16) Green D.A., 2009, A Catalogue of Galactic Supernova Remnants (2009 March version). Mullard Radio Astronomy Observatory, Cambridge
- (17) Hansen, B. M. S.; Phinney, E. S., 1997, MNRAS, 291, 569
- (18) Harding, A. K., 2008, in W. Becker ed., Astrophysics and Space Science Library, Neutron Stars and Pulsars, Springer, Berlin, p.521
- (19) Hartman, R. C. et al., 1999, ApJS, 123, 79
- (20) Hobbs, G., Lorimer, D. R., Lyne, A. G., & Kramer, M. 2005, MNRAS, 360, 974
- (21) Hui, C. Y., & Becker, W. 2009, A&A, 494, 1005
- (22) Kaastra, J.S. 1992, An X-Ray Spectral Code for Optically Thin Plasmas, Internal SRON-Leiden Report, updated version 2.0
- (23) Landecker, T. L.; Roger, R. S.; Higgs, L. A., 1980, A&AS, 39,133
- (24) Liedahl, D.A., Osterheld, A.L., and Goldstein, W.H. 1995, ApJ, 438, L115
- (25) Maccacaro, T., Gioia, I. M., Wolter, A., Zamorani, G., & Stocke, J. T. 1988, ApJ, 326, 680
- (26) Mavromatakis, F., 2003, A&A, 408, 237
- (27) Mewe, R., Gronenschild, E.H.B.M., and van den Oord, G.H.J. 1985,A&AS, 62, 197
- (28) Mewe, R., Lemen, J.R., and van den Oord, G.H.J. 1986, A&AS, 65, 511
- (29) Monet, D., et al. 2003, AJ, 125, 984
- (30) Ng, C.-Y.; Romani, R. W.; Brisken, W. F.; Chatterjee, S; Kramer, M., 2007, ApJ, 654, 487
- (31) Pizzolato, N., Maggio, A., Micela, G., Sciortino, S., & Ventura, P. 2003, A&A, 397, 147
- (32) Possenti, A.; Cerutti, R.; Colpi, M.; Mereghetti, S., 2002, A&A, 387, 993
- (33) Porter, T. A., 2009, arXiv:0907.0294v1
- (34) Sana, H. et al., 2007, in St. Louis N., Moffat A. F. J., eds, ASP Conf. Ser. Vol. 367, Massive Stars in Interactive Binaries. Astron. Soc. Pac., San Francisco, p.109
- (35) Stelzer, B. et al., 2005, ApJS, 160, 557
- (36) Stocke, J. T., Morris, S. L., Gioia, I. M., Maccacaro, T., Schild, R., Wolter, A., Fleming, T. A., & Henry, J. P. 1991, ApJS, 76, 813
- (37) Tang, Anisia P. S.; Takata, J.; Jia, J.J.; Cheng, K. S, 2008, ApJ, 676, 562
- (38) Uchiyama, Y.; Takahashi, T.; Aharonian, F. A.; Mattox, J. R., 2002, ApJ, 571, 866
- (39) Wang, N. et al., 2001, MNRAS, 328, 855
- (40) Watson, M. G. et al., 2009, A&A, 493, 339
- (41) Weisskopf, M. C. et al., 2006, ApJ, 652, 387