Multiwavelength Observations of Pulsar Wind Nebulae
Abstract
The extended nebulae formed as pulsar winds expand into their surroundings provide information about the composition of the winds, the injection history from the host pulsar, and the material into which the nebulae are expanding. Observations from across the electromagnetic spectrum provide constraints on the evolution of the nebulae, the density and composition of the surrounding ejecta, the geometry of the central engines, and the long-term fate of the energetic particles produced in these systems. Such observations reveal the presence of jets and wind termination shocks, time-varying compact emission structures, shocked supernova ejecta, and newly formed dust. Here I provide a broad overview of the structure of pulsar wind nebulae, with specific examples from observations extending from the radio band to very-high-energy -rays that demonstrate our ability to constrain the history and ultimate fate of the energy released in the spin-down of young pulsars.
1 Introduction
The basic structure of a pulsar wind nebula is determined by the spin-down energy injected by the central pulsar and the interaction of the nebula with the interior regions of the supernova remnant (SNR) in which it evolves. Losses from synchrotron radiation in the nebular magnetic field, whose strength depends both on the nature of the injected wind and on the evolving size of the PWN, inverse-Compton (IC) scattering of ambient photons by the energetic electron population within the nebula, and adiabatic expansion as the nebula sweeps up the surrounding supernova ejecta, all combine to determine the emission structure and long-term evolution of the nebula. (See gae06 for a review.) Multiwavelength observations of PWNe provide crucial information on the underlying particle spectrum and strongly constrain both the magnetic field strength and the stage of evolution. Of particular interest is the spectrum of low-energy particles contained in the PWN. These retain the history of early energy losses as well as possible signatures of features in the pulsar injection spectrum.
Complex structure in PWN spectra can originate in a number of ways that are associated with the long-term evolution as well ren84 ; gsz09 . In particular, when the reverse shock compresses the PWN, the resulting increase in the magnetic field initiates a new epoch of fast synchrotron cooling that adds to the population of low energy particles. Models which do not account for the reverse shock interaction will thus underestimate this population and its associated radiation. In addition, recent studies of the spectrum immediately downstream of the wind termination shock show that the injection spectrum itself can deviate significantly from a simple power law sla08 , and particle-in-cell simulations of the acceleration process produce a Maxwellian population with a power law tail spi08 . Any such structure in the injected particle spectrum imprints itself on the broadband emission of the entire nebula. The resulting breaks or regions of curvature in the PWN spectrum, and the frequencies at which they are observed, depend upon the energy at which features appear in the electron spectrum as well as the means by which the photons are produced (e.g. synchrotron radiation or IC emission). To fully understand the nature of the particle injection, as well as the long-term evolution of PWNe, it is thus crucial to study the emission structure over the entire electromagnetic spectrum.
2 Dynamical Evolution of PWNe
The evolution of a PWN within the confines of its host SNR is determined by both the rate at which energy is injected by the pulsar and by the density structure of the ejecta material into which the nebula expands. The location of the pulsar itself, relative to the SNR center, depends upon any motion given to the pulsar in the form of a kick velocity during the explosion, as well as on the density distribution of the ambient medium into which the SNR expands. At the earliest times, the SNR blast wave expands freely at a speed of km s-1, much higher than typical pulsar velocities of km s-1. As a result, for young systems the pulsar will always be located near the SNR center.
The energetic pulsar wind is injected into the SNR interior, forming a high-pressure bubble that expands supersonically into the surrounding ejecta, forming a shock. The input luminosity is generally assumed to have the form (e.g. ps73 )
| (1) |
where
| (2) |
is the initial spin-down time scale of the pulsar. Here is the initial spin-down power, and are the initial spin period and its time derivative, and is the so-called “braking index” of the pulsar ( for magnetic dipole spin-down). The pulsar has roughly constant energy output until a time , beyond which the output declines fairly rapidly with time. In the spherically symmetric case, the radius of the PWN evolves as
| (3) |
where is the energy released in the explosion and is the mass of the ejecta che77 . Thus, at least at early times when the pulsar input is high, the PWN expansion velocity increases with time. The sound speed in the relativistic fluid within the PWN is sufficiently high () that any pressure variations experienced during the expansion are quickly balanced within the bubble; at early stages, we thus expect the pulsar to be located at the center of the PWN. The pressure balance within the PWN results in a termination shock where the energetic pulsar wind meets the more slowly-expanding PWN. Studies of this region of the PWN provide the most direct information available on particles that are being freshly injected into the nebula.
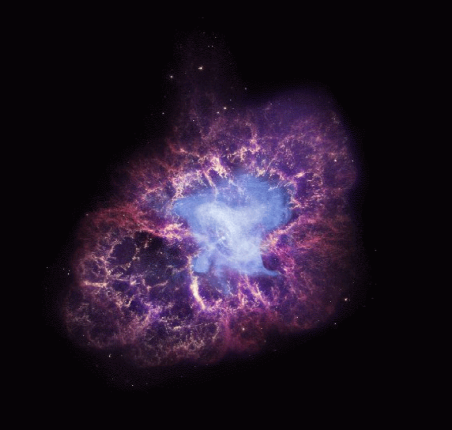
The geometry of the pulsar system results in an axisymmetric wind lyu02 , forming a torus-like structure in the equatorial plane, along with collimated jets along the rotation axis. The higher magnetization at low latitudes confines the expansion here to a higher degree, resulting in an elongated shape along the pulsar spin axis for the large-scale nebula beg92 ; van03 . This structure is evident in Figure 1, where X-ray and optical observations of the Crab Nebula clearly reveal the jet/torus structure surrounded by the elongated wind nebula bounded by filaments of swept-up ejecta. A thorough review of the MHD-driven jet/torus structure is presented by N. Bucciantini in these Proceedings.
Beyond the PWN, the outer blast wave of the SNR drives a shock into the surrounding interstellar/circumstellar medium (ISM/CSM), forming a shell of hot gas and compressed magnetic field. As the shell sweeps up additional mass, and decelerates, a reverse shock (RS) propagates back into the expanding ejecta. When the SNR has swept up an amount of mass that is roughly equal to the mass of the ejecta, the evolution approaches the Sedov phase in which the radius is described by
| (4) |
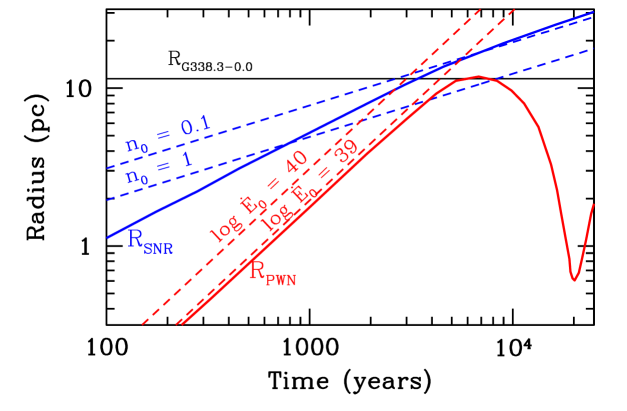
where is the density of the ambient medium. This is illustrated in Figure 2 where dashed lines show and as a function of time using Equations 3 and 4. Here we have assumed and erg, and have used a range of values for and . As indicated, eventually the PWN would overtake the SNR boundary under such conditions. However, because the initial expansion of the SNR occurs more rapidly than in the Sedov phase, and the injection rate from the pulsar is highest at the earliest times, the actual behavior differs from that shown. In addition, as the reverse shock of the SNR propagates inward, it eventually reaches the PWN boundary and begins crushing the nebula. This is indicated in the solid curves in Figure 2, where the early-phase behavior as well as the reverse shock propagation is taken into account (see gsz09 ). Ideally the PWN radius decreases until the nebula pressure is sufficiently high for the system to rebound.
The crushing of the PWN results in an increase in the magnetic field. This causes a rapid burn-off of the most energetic particles in the nebula. The PWN/RS interface is Rayleigh-Taylor (R-T) unstable, and is subject to the formation of filamentary structure where the dense ejecta material is mixed into the relativistic fluid blo01 . The nebula subsequently re-forms as the pulsar injects fresh particles into its surroundings, but a significant relic nebula of mixed ejecta and relativistic gas will persist.
In cases where the pulsar and its PWN have moved considerably from the center of the PWN, or in which the SNR has evolved in a medium of nonuniform density, the reverse shock will interact with the PWN asymmetrically, encountering one portion of the nebula well before another. This results in a complex interaction that leaves a highly distorted relic nebula that may be highly displaced from the pulsar position blo01 .
In the later stages of evolution, the PWN can expand to a very large size, with a correspondingly lower magnetic field strength. As described below, such PWNe may be best identified through their high-energy -ray emission, with only weak X-ray emission observed close to the pulsars.
3 Spectral Evolution of PWNe
As particles are injected from a pulsar into its PWN, the resulting emission is determined by the evolved particle spectrum and magnetic field, as well as the energy density of the ambient photon field.111In addition, emission from ejecta gas and dust swept up by the expanding nebula can be significant – and even dominant in some wavebands. The injected spectrum is often characterized as a power law:
| (5) |
The integrated energy in the electron spectrum is then
| (6) |
where is the ratio of the spin-down power injected in the form of Poynting flux to that in the form of particles. It is important to note one expects the postshock flow of particles to be characterized by a Maxwellian distribution accompanied by a nonthermal tail – a result confirmed by recent particle-in-cell simulations of relativistic shocks spi08 . The development of the nonthermal tail depends on the shock conditions, and the total residence time of the particles in the acceleration region, which may vary at different locations in the inner nebula. Thus, it is reasonable to expect that the injected spectrum may actually deviate considerably from a pure power law form, a point that recent observations may be beginning to illustrate, as we discuss below.
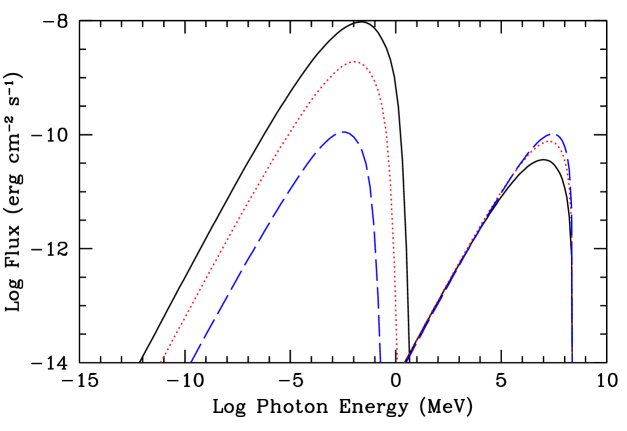
The resulting emission spectrum is found by integrating the electron spectrum over the emissivity function for synchrotron and IC radiation using, respectively, the nebular magnetic field and spectral density of the ambient photon field. As illustrated in Figure 3, the build-up of particles in the nebula results in an IC spectrum that increases with time. The synchrotron flux decreases with time due to the steadily decreasing magnetic field strength associated with the adiabatic expansion of the PWN. This behavior is reversed upon arrival of the SNR reverse shock (not shown in Figure), following which the nebula is compressed and the magnetic field strength increases dramatically, inducing an episode of rapid synchrotron losses. Upon re-expanding, however, IC emission again begins to increase relative to the synchrotron emission. At the latest phases of evolution, when the nebula is very large and the magnetic field is low, the IC emission can provide the most easily-detected signature. As described below, such behavior is seen for a number of PWNe that have been identified based on their emission at TeV energies, and for which only faint synchrotron emission near the associated pulsars is seen in the X-ray band.
The broadband spectrum of a PWN, along with the associated dynamical information provided by measurements of the pulsar spin properties, and the size of the PWN and its SNR, place very strong constraints on its evolution and on the spectrum of the particles injected from the pulsar. Combined with estimates of the swept-up ejecta mass, this information can be used to probe the properties of the progenitor star and to predict the long-term fate of the energetic particles in the nebula. Recent multiwavelength studies of PWNe, combined with modeling efforts of their evolution and spectra, have provided unique insights into several of these areas.
4 Case Studies
A complete summary of recent results on PWNe is well beyond the scope of this paper. Below we discuss four distinct systems for which recent multiwavelength observations have begun to probe both the detailed structure and the underlying particle population in these nebulae.
4.1 3C 58
3C 58 is a flat-spectrum radio nebula (, where ) for which upper limits based on IRAS observations indicate a spectral break between the radio and infrared bands gs92 . The PWN has often been associated with SN 1181 sg05 ; the low break frequency would then suggest an extremely large magnetic field (mG) if interpreted as the result of synchrotron break. This has resulted in a number of different interpretations, including the suggestion that the pulsar in 3C 58 underwent a rapid decline in its output at some early epoch gs92 , the possibility that the low-frequency break is inherent in the injection spectrum from the pulsar, and the suggestion that 3C 58 is not actually associated with SN 1181, but is an older nebula che05 ; bie06 .
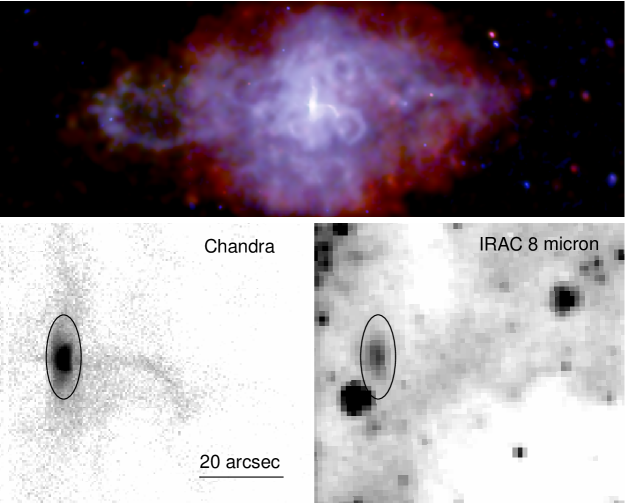
The X-ray emission from 3C 58 (Figure 4) is dominated by a power law component, typical of synchrotron emission. However, a faint thermal component is clearly detected in the outer regions of the PWN, and also contributes to the interior regions boc01 ; sla04 ; ghn06 . The temperature is keV, and enhanced abundances of Ne and Mg are observed, indicative of of ejecta that has been swept up by the PWN. This is much larger than the expected mass if the PWN is associated with SN 1181, and suggests a larger age for the system che05 .

To investigate the evolution of 3C 58, we have carried out Spitzer observations using IRAC sla08 . These observations reveal the PWN in both the 3.6 and 4.5 m bands, representing the first detection of synchrotron emission from this important young PWN anywhere in the five decades of frequency separating the radio and X-ray bands. The morphology of the IR emission from 3C 58 is strikingly similar to that seen in the radio and X-ray bands. The emission extends all the way to the radio boundaries, indicating that no synchrotron loss breaks occur below the band, and some regions of enhanced or diminished emission match well with those seen in the other bands (notably the large cavity on the eastern side), suggesting that we are observing primarily synchrotron radiation. Optical filaments in 3C 58 sla04 ; rf07 , which presumably originate from supernova ejecta overtaken by the expansion of the PWN, do not show a good spatial correspondence with the radio or IR structures, suggesting that the IR emission is not dominated by dust contributions. This is similar to results from Spitzer observations of the Crab Nebula tgw+06 , where emission in the IRAC band is also identified primarily with synchrotron radiation.
The IRAC data also reveal emission from the torus surrounding the pulsar in 3C 58 shm02 in all four bands (Figure 4).222We also show preliminary results from MIPS observations at 24 m where we also detect the torus. Optical emission from the torus is detected as well shi08 . These observations provide new constraints on the evolution of the particles as they flow from the termination shock in 3C 58. There is little question that this emission is synchrotron in nature; there is insufficient dust in the environment of the pulsar termination shock to provide a shocked dust component to the emission. The spectrum (Figure 5) requires a break of some sort between the IR and X-ray bands, suggesting that the synchrotron loss break appears just above the IR band. Most importantly, these results indicate that the spectrum of particles injected into the PWN through the termination shock does not follow an unbroken power law. As a result, structure in the PWN spectrum is, at least in part, the imprint of structure from the injection region.
From Figure 5, it is clear that additional observations of 3C 58, and particularly its torus, at longer wavelengths will be crucially important to understand the nature of the injected particles and the subsequent long-term evolution of the PWN. Deep observations of the central regions of other PWNe are clearly of importance as well.
4.2 Vela X
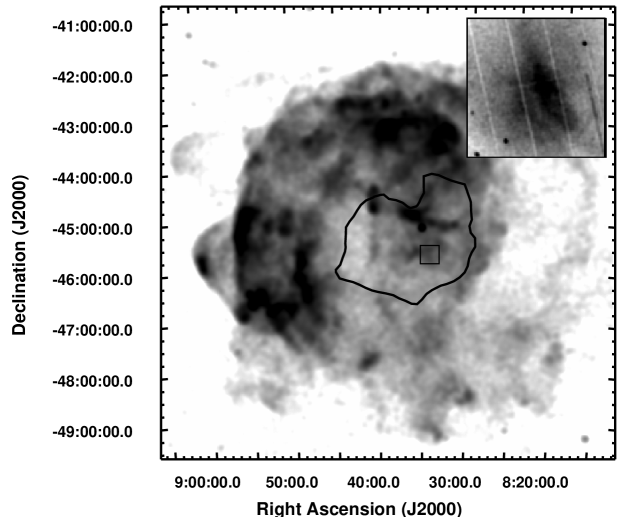
Located at a distance of only 280 pc, the Vela SNR houses a young pulsar that powers the extended nebula Vela X. This nebula lies within a limb-brightened shell of thermal X-rays. The outer shell is cool, and the exceptionally low foreground absorption () allows us to see strong emission lines from O, Ne, and Mg. In X-rays, the overall brightness asymmetry of Vela is evident (Figure 6). The SNR is much brighter in the northeastern hemisphere, toward the Galactic plane. This is apparently the result of large-scale inhomogeneities in the ISM, with in the south boc99 , and on the north side of the SNR dub98 .

Radio observations of the PWN mil80 reveal a morphology concentrated to the south of the pulsar itself, suggesting that the nebula has been disrupted by the impact of the reverse shock which propagated more rapidly from the northeast due to the higher ambient density in this direction. Higher resolution radio images show a network of filamentary structure in the PWN fbm+97 , possibly formed by R-T instabilities in this interaction with the reverse shock. ROSAT observations of the Vela X region mo95 reveal a large emission structure – the so-called “cocoon” – extending to the south of the pulsar. The region is characterized by a hard spectrum and appears to lie along a bright elongated radio structure. ASCA observations established a two-component X-ray spectrum with the hard component adequately described by either a power law or a hot thermal plasma mo97 . The PWN is observed at energies up to keV with BeppoSAX man05 , and observations with H.E.S.S. aha06 reveal extended VHE -ray emission with the brightest emission concentrated directly along the cocoon.
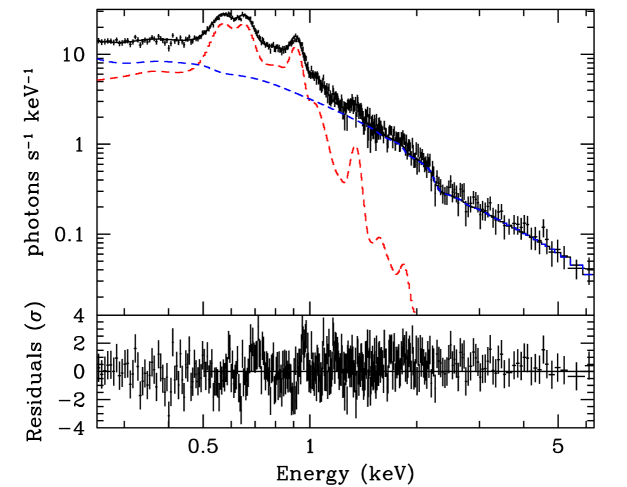
Our initial studies of a small region along the cocoon lsd08 reveal a bright X-ray structure shown as an inset to Figure 6. The emission is concentrated into several distinct regions, at least some of which appear to be filamentary structures. The integrated emission from these regions is characterized by two distinct components – a power law with a spectral index of and a thermal plasma with enhanced abundances of O, Ne, and Mg, presumably associated with ejecta that has been mixed into the PWN upon its interaction with the reverse shock (Figure 7).
It is of particular interest that our broadband modeling of the nonthermal emission from this central region of Vela X indicates a disconnect between the radio-emitting particles and those that produce the X-ray and TeV -ray emission lsd08 . A model with a single spectral break between the bands either underpredicts the radio flux or produces an incorrect radio spectral index (Figure 8), while a model with two breaks can satisfy the data. Treating the poorly-characterized low-energy electron component as a separate population of particles, de Jager, Slane, & LaMassa dsl08 showed that enhanced IC emission from this component could be expected in the GeV band. This has now been confirmed with observations by AGILE pel10 and Fermi abdo10 . Interestingly, a similar excess is observed in Fermi observations of HESS J1640465 sla10 , another evolved PWN that appears to have undergone a RS interaction (see Section 4.4).
The nature of the low-energy particle spectrum in Vela X is poorly understood, but the Fermi studies in particular suggest a difference in the cocoon emission from that of its surroundings; the LAT emission appears to be concentrated distinctly to the west of the TeV emission. Whether or not this emission component is somehow associated with the reverse shock interaction is not clear. An XMM Large Project to map a significant portion of Vela X is underway to investigate the distribution of nonthermal particles and thermal ejecta in the nebula.
4.3 G327.11.1
G327.11.1 is a composite SNR with a bright central PWN whose structure is complex in both the radio and X-ray bands. As shown in Figure 9, the SNR is characterized by a faint radio shell accompanied by a bright radio PWN. The PWN is offset from the SNR center, and a finger-like structure extends toward the west/northwest. The morphology is suggestive of a PWN that has been disrupted by an asymmetric reverse shock interaction that has arrived preferentially from the northwestern direction.
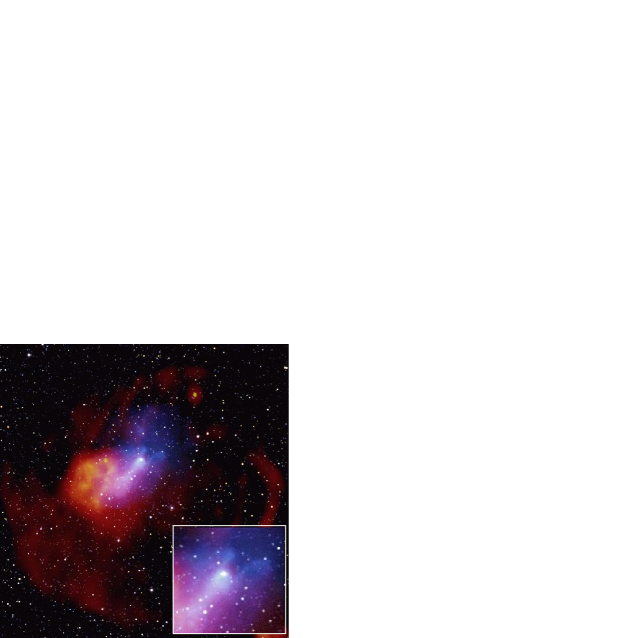
Detailed Chandra observations tem09 appear to confirm this scenario in detail.333See also the contribution by T. Temim in these Proceedings. A compact X-ray source resides at the tip of the radio finger, and a trail of nonthermal X-ray emission extends from the source back into the radio nebula. The compact X-ray source itself is resolved, with possible evidence of a jet or torus structure, and the source is embedded in a cometary nebula whose structure is suggestive of a bow shock. A pair of prong-like structures originate from the vicinity of the compact core and extend out to the west/northwest. Their axes are not aligned with the compact core, and they do not appear to be jets from the pulsar. The most unusual feature in G327.1-1.1 is a large bubble-like structure that extends out from the prongs. The bubble is very faint, but it is apparent in images taken with both Chandra and XMM.
The spectral index in the tail of X-ray emission that extends into the brighter radio PWN appears to vary from to , although significantly better statistics are needed to map this fully. Faint loop-like structures, possibly associated with Rayleigh-Taylor filaments or magnetic loops, are evident in the southern part of the tail and they appear to extend from radio structures inside the relic PWN. Deeper X-ray observations are required to better characterize these and, more importantly, to study the detailed properties of the complex structures seen in the immediate vicinity of the pulsar, and to investigate the apparent upstream diffusion of particles that form the bubble-like structure.
The overall X-ray morphology of the PWN in G327.1-1.1 presents several challenges. It appears clear from the displacement of the radio nebula that the PWN has undergone an interaction with the SNR reverse shock, and that this shock arrived earlier from the northwest, possibly as a result of pulsar motion in this direction. In such a scenario, we expect the ongoing pulsar wind production to begin forming a new PWN around the pulsar, shaped by the surrounding pressure conditions. Radio emission from the displaced relic nebula will persist, but the compression from the reverse shock will temporarily increase the magnetic field in the nebula, causing rapid synchrotron losses for the more energetic particles. The X-ray emission is thus expected to be concentrated closer to the pulsar, as observed. Spectral steeping of the X-ray spectrum in the direction of the relic nebula is expected if the synchrotron loss timescale is shorter than the particle flow timescale; mapping this spectral evolution along the extended X-ray tail thus constrains the conditions in the relic nebula. In the direction from which the reverse shock propagated, the structure of the medium is complicated. The density in the immediate post-shock region is enhanced, but declines downstream due to adiabatic expansion of the SNR. At least qualitatively, this could provide the environment in which freshly-injected wind from the pulsar inflates the observed bubble.
The cometary feature surrounding the putative pulsar complicates the above picture. The morphology is suggestive of a bow shock that forms when the pulsar motion exceeds the sound speed in the the ambient medium, yielding a structure quite different from that of a static PWN. The wind termination shock in such systems is compressed in the direction of motion, and extended in the backward direction. X-ray emission is then observed between the termination shock and the contact discontinuity, and forms three distinct structures: the “head” that surrounds the pulsar; an enhanced region behind the pulsar, associated with the termination shock; and an elongated tail where the swept-back wind is concentrated gae04 ; buc02 . For G327.1-1.1, such a geometry would require a significant pulsar velocity component perpendicular to the plane of the sky, but the overall velocity that would be required ( km s-1) is not unreasonable.
Given the similarity between G327.11.1 and Vela, in the context of both being systems in which an interaction between the PWN and the SNR reverse shock has occurred, it is of considerable interest to determine whether or not G327.11.1, like Vela X, produces -rays. Preliminary investigation of Fermi-LAT data indicates faint emission that is positionally coincident with G327.11.1, but further analysis is required to assess this in detail.
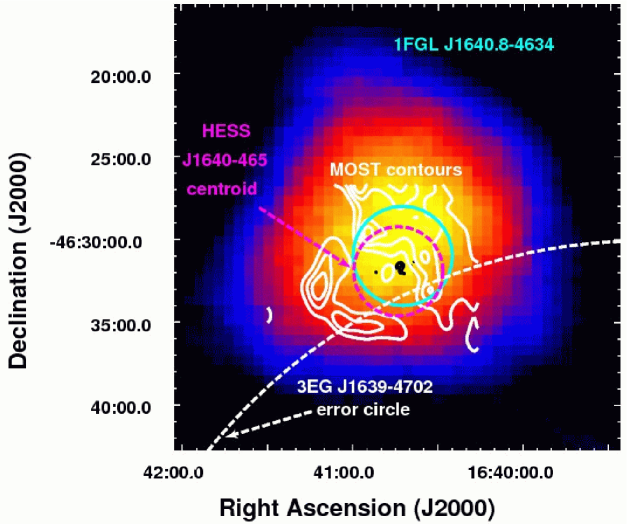
4.4 HESS J1640465
HESS J1640465 (see Figure 10) is an extended source of very-high-energy -ray emission discovered with the High Energy Stereoscopic System (H.E.S.S.) during a survey of the Galactic plane aha06b . Centered within the radio SNR G338.30.0 sg70 , the deconvolved TeV image of the source has an RMS width of arcmin funk07 . HI measurements show absorption against G338.30.0 out to velocities corresponding to the tangent point, indicating a distance of at least 8 kpc lsg+09 , and thus implying a rather large size for the PWN ( pc, where is the distance in units of 10 kpc). X-ray observations with XMM funk07 and Chandra lsg+09 establish the presence of an accompanying X-ray nebula and an X-ray point source that appears to be the associated neutron star. The point source is offset from the center of the PWN, and both are offset from the center of the SNR, suggesting that an asymmetric interaction with the SNR reverse shock has occurred.
We have investigated Fermi-LAT data acquired from the region surrounding HESS J1640465 and detect the source with high significance sla10 . The spectrum is well-described by a power law with and a . We have modeled the emission assuming a 1-zone model in which particles are injected into the nebula with a simple power law distribution. We use a radius of pc for G338.30.0, based on radio observations. The observed extent of HESS J1640465 constrains the radius of the PWN to pc. As indicated in Figure 2, where a horizontal line indicates the radius of G338.30.0, reasonable values for the SNR and PWN parameters indicate that the SNR reverse shock has almost certainly begun to impact the PWN.
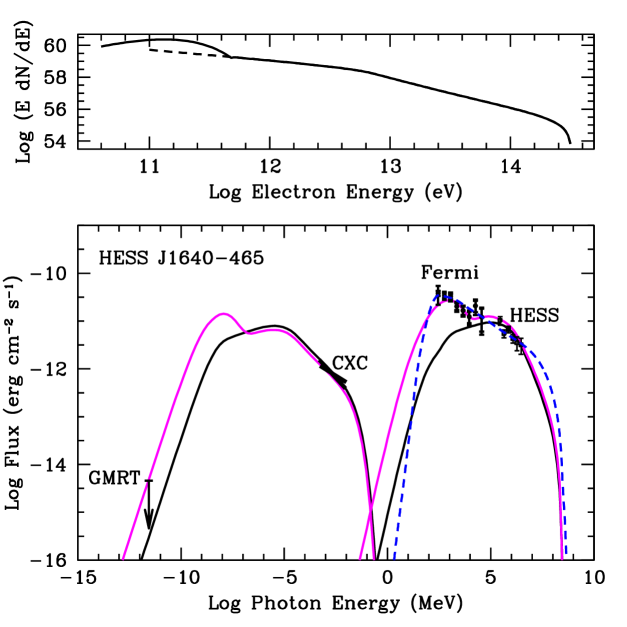
The broadband emission model results are shown in Figure 11 where we plot the Fermi and H.E.S.S spectra along with the radio upper limit from GMRT observations gcd+08 and spectral confidence bands derived from Chandra lsg+09 . The black curves represent the model prediction for the synchrotron (left) and IC (right) emission that best describes the X-ray and TeV -ray spectra, similar to results from lsg+09 ; the parameters for the model are summarized in the caption. As seen in Figure 11, this model significantly underpredicts the observed Fermi-LAT emission. Our spectral fits can formally accommodate up to about of the observed flux in a pulsar-like component characterized by a power law with an exponential cutoff energy between 1 and 8 GeV, and there are several known radio pulsars located within the error circle of HESS J1640465 that could potentially produce observable -ray emission. Even in this case, however, the Fermi-LAT emission still greatly exceeds the predicted flux from HESS J1640465.
As described in Section 4.2, simple power-law models for the particles in Vela X, another evolved PWN, fail to reproduce the observed broadband spectrum. The presence of an excess population of low-energy electrons is inferred, and models for the IC scattering of photons from this population predict an excess of -rays in the GeV range. Motivated by these results from Vela X, we modified the evolved power law spectrum from our model for HESS J1640465 by truncating the lower end of the power law and adding a distinct low-energy component. Based on results from simulations of shock acceleration spi08 , we chose a Maxwellian distribution for this population. Our resulting (ad hoc) particle spectrum is shown in the upper panel in Figure 11, and the resulting broadband emission is shown in the lighter (magenta) curves in the lower panel. Here we have adjusted the normalization of the Maxwellian to reproduce the emission in the Fermi-LAT band, which is produced primarily by upscattered infrared (IR) photons from local dust. We find a mean value of for the electrons in the Maxwellian component, and roughly 5% of the total electron energy in the power law tail, consistent with results from particle-in-cell simulations. Recent work by Fang & Zhang (2010) fz10 uses a similar input distribution to successfully model the emission for several PWNe including HESS J1640465. However, their results for HESS J1640465 underpredict the observed GeV emission from this source, apparently due to use of a slightly lower bulk Lorentz factor and a larger fraction of the total energy in the power law tail than we have used in this analysis.
An alternative scenario for the -ray emission is that it arises from the SNR itself, and not the PWN. The dashed blue curve in Figure 11 represents a model for the emission from the collision of protons accelerated in the SNR with ambient material, leading to -rays from the production and subsequent decay of neutral pions. Assuming a shock compression ratio of 4 and that 25% of the total supernova energy appears in the form of relativistic protons, an ambient density is required to produce the model shown in the Figure. This is much higher than can be accommodated for the observed size of the SNR and the lack of observed thermal X-ray emission from the SNR. Such high densities are found in dense molecular clouds, suggesting that the -rays could be produced by particles that stream away to interact with high-density material outside the SNR. However, only the most energetic particles can escape the acceleration region, which is in conflict with the proton spectrum we require to match the data. Moreover, the observed TeV emission appears to originate from within the SNR boundaries, making such an escaping-particle scenario appear problematic. Based on this, along with the lack of a spectral cutoff that might suggest emission from a central pulsar, we conclude that the GeV -ray emission most likely arises from the PWN.
5 Summary
The broadband spectra of PWNe provide information about both the structure and evolution of these objects. New multiwavelength observations have begun to probe PWNe from the sites of particle injection to the ejecta-laden outer boundaries, providing crucial input for modeling these systems. Observations in the -ray band have uncovered previously unknown systems in the late phase of evolution, while X-ray observations continue to provide detailed information about the geometry and the composition of the pulsar winds. These observations continue to inform theoretical models of relativistic shocks which, in turn, have broad importance across the realm of high-energy astrophysics. At the same time, these recent results have pointed the way to new and deeper observations of PWNe across the electromagnetic spectrum.
Acknowledgements.
I would like to acknowledge the considerable contributions of many colleagues to the work described here, including Bryan Gaensler, David Helfand, Stephen Reynolds, Okkie de Jager, and Stefan Funk. In particular, I would like to thank Yosi Gelfand, Tea Temim, Daniel Castro, Stephanie LaMassa, and Anne Lemiere who, as students as postdocs, led much of the work described here. This work was supported in part by NASA contract NAS8-03060, NASA grants NNX09AT68G, and NNX09AP99G, and Spitzer RSA 1375009.References
- (1) Abdo, A. A., et al. 2010, ApJ, 713, 146
- (2) Aharonian, F. A. et al. 2006, A&A, 448, L43
- (3) Aharonian, F. A. et al. 2006, A&A, 636, 777
- (4) Begelman, M. C., & Li, Z.-Y. 1992, ApJ, 397, 187
- (5) Bietenholz, M. F., Kassim, N. E., & Weiler, K. W. 2001, ApJ, 560, 772
- (6) Blondin, J. M., Chevalier, R. A., & Frierson, D. M. 2001, ApJ, 563, 806
- (7) Bocchino et al. 1999, A&A, 342, 839
- (8) Bocchino, F. et al. 2001, A&A, 369, 1078
- (9) Bucciantini, N. 2002, A&A, 387, 1066
- (10) Chevalier, R. A. 1977, in Astrophysics and Space Science Library, Vol. 66, Supernovae, ed. D. N. Schramm, 53
- (11) Chevalier, R. A. 2005, ApJ, 619, 839
- (12) de Jager, O. C., Slane, P. O., & LaMassa, S. M. 2008, ApJ, 689, 125
- (13) Dubner et al. 1998, AJ, 116, 813
- (14) Fang, J. & Zhang, L. 2010, A&A, 515, A20
- (15) Frail, D. A. et al. 1997, ApJ, 475, 224
- (16) Funk, S., et al. 2007, ApJ, 267, 517
- (17) Gaensler, B. M. et al. 2004, ApJ, 616, 383
- (18) Gaensler, B. M., & Slane, P. O. 2006, ARA&A, 44, 17
- (19) Gelfand, J. D., Slane, P. O., & Zhang, W. 2009, ApJ, 703, 2051
- (20) Giacani, E. et al. 2008, AIPC, 1085, 234
- (21) Green, D. A. & Scheuer, P. A. G. 1992, MNRAS, 258, 833
- (22) Gotthelf, E. V., Helfand, D. J., & Newburgh, L. 2006, ApJ, 654, 267
- (23) LaMassa, S. M., Slane, P. O., & de Jager, O. C. 2008, ApJ, 689, 121L
- (24) Lemiere, A., Slane, P., Gaensler, B. M., & Murray, S. 2009, ApJ, 706, 1269
- (25) Lyubarsky, Y. E. 2002, MNRAS, 329, L34
- (26) Mangano, V. et al. 2005, A&A, 436, 917
- (27) Markwardt & Ögelman 1995, Nature, 375, 40
- (28) Milne, D. K. 1980, A&A, 81, 293
- (29) Markwardt & Ögelman 1997, ApJ, 480, L13
- (30) Pacini, F. & Salvati, M. 1973, ApJ, 186, 249
- (31) Pellizzoni, A., et al. 2010, Sci, 327, 663
- (32) Reynolds, S. P., & Chevalier, R. A. 1984, ApJ, 278, 630
- (33) Rudie, G. C., & Fesen, R. A. 2007, RMxAC, 30, 90
- (34) Shaver, P. A. & Goss, W. M. 1970, AuJPA, 14, 133
- (35) Shibanov, Y. A. 2008, A&A, 486 273
- (36) Slane, P., Helfand, D. J., & Murray, S. S. 2002, ApJ, 571, L45
- (37) Slane, P., Helfand, D. J., van der Swaluw, E., & Murray, S. S. 2004, ApJ, 616, 403
- (38) Slane, P., et al. 2008, ApJ, 676, L33
- (39) Slane, P., et al. 2010, ApJ, 720, 266
- (40) Spitkovsky, A. 2008, ApJ, 682, L5
- (41) Stephenson, F. R., & Green, D. A. 2005, Historical Supernovae and Their Remnants (Oxford University Press, USA)
- (42) Temim, T. et al. 2006, AJ, 132, 1610
- (43) Temim, T., et al. 2009, ApJ, 691, 895
- (44) van der Swaluw, E. 2003, A&A, 404, 939