Gradual Inflation of Active-Region Coronal Arcades Building up to Coronal Mass Ejections
Abstract
The pre-CME structure is of great importance to understanding the origin of CMEs, which, however, has been largely unknown for CMEs originating from active regions. In this paper, we investigate this issue using the wavelet-enhanced EUV Imaging Telescope observations combined with the Large Angle and Spectrometric Coronagraph, Michelson Doppler Imager, and GOES soft X-ray observations. Selected for studying are 16 active-region coronal arcades whose gradual inflation lead up to CMEs. 12 of them clearly build upon post-eruptive arcades resulting from a preceding eruption; the rest 4 are located high in the corona in the first place and/or have existed for days. The observed inflation sustains for h, with the arcade rising from to within the EIT field of view (FOV). The rising speed is less than 5 km s-1 for most of the time. Only at the end of this quasi-static stage, it increases to tens of kilometers per second over tens of minutes. The arcade then erupts out of the EIT FOV as a CME with similar morphology. This pre-CME structure is apparently unaffected by the flares occurring during its quasi-static inflation phase, but is closely coupled with the flare occurring during its acceleration phase. For four events that are observed on the disk, it is found that the gradual inflation of the arcade is accompanied by significant helicity injection from photosphere. In particular, a swirling structure, which is reminiscent of a magnetic flux rope, was observed in one of the arcades over 4 h prior to the subsequent CME, and the growth of the arcade is associated with the injection of helicity of opposite sign into the active region via flux emergence. We propose a four-phase evolution paradigm for the observed CMEs, i.e., a quasi-static inflation phase which corresponds to the buildup of magnetic free energy in the corona, followed by the frequently observed three-phase paradigm, including an initial phase, an acceleration phase and a gradual phase.
1 Introduction
Coronal mass ejections (CMEs) are complex, large-scale magnetized plasma expelled from the Sun, often intertwined with flares and prominence eruptions. A classic, white-light CME displays a three-part structure: a bright expanding loop, followed by a dark void (cavity) embedded with a bright core of dense prominence material (e.g., Illing & Hundhausen, 1986). Typically, it originates from a helmet streamer that has been slowly rising or swelling for days prior to the eruption (see Gibson et al., 2006, and references therein). The helmet streamer also possesses an equivalent three-part structure, corresponding to a filament channel observed on the solar disk. During the eruption, the streamer deforms into the CME frontal structure; the prominence and the cavity underlying the streamer become the bright core and the cavity of the CME, respectively. The prominence is often long-lived and can be tracked on the solar disk for several days, and its activation phase with a gradual rising motion at tens of kilometers per second may precede the CME eruption by tens of minutes or even hours (e.g., Srivastava et al., 1999). Great importance has been rightly attached to these quiescent structures, which provide important clues to the nature of coronal magnetic fields prior to CMEs.
It has long been proposed that there are two dynamical types of CMEs (Gosling et al., 1976; MacQueen & Fisher, 1983; Sheeley et al., 1999): 1) fast CMEs, which are accelerated impulsively at the low corona and decelerated in the coronagraph FOV, preferentially associated with solar flares; and 2) slow CMEs, which are accelerated gradually in the coronagraph FOV over a large height range, preferentially associated with prominence eruptions. However, Vršnak et al. (2005) found that non-flare CMEs show characteristics similar to CMEs associated with flares of soft X-ray class B and C, which is indicative of a “continuum” of events rather than supporting the existence of two distinct classes. A more compelling argument for a one-class continuum view is based on a statistical study of 4315 CMEs by Yurchyshyn et al. (2005), who showed that the speed distributions for both accelerating and decelerating events can be fitted with a single log-normal distribution to a good approximation.
In contrast to CMEs associated with prominence eruptions, not just the pre-CME coronal structure but its physical connection with the subsequent CME is poorly identified for CMEs associated with flares. To establish such a connection may help understand the conditions leading up to the catastrophic release of the magnetic free energy. With the helmet streamer in mind, we assume that a pre-CME structure in general should have a closed magnetic configuration that evolves with a quiescent energy buildup phase, followed by a catastrophic eruption into a CME which bears morphological similarity with the pre-CME structure.
It has been shown that active regions that exhibit forward- or reverse-S shapes in soft X-rays, also termed sigmoids, have a greater tendency to erupt (Canfield et al., 1999), viz., sigmoids often brighten prior to or during the flare impulsive phase, and then transform into arcades or cusped loops as the eruption progresses (Sterling et al., 2000; Moore et al., 2001; Pevtsov, 2002; Liu et al., 2007a). The sigmoidal shape is indicative of the presence of twisted magnetic flux. Hence its formation may be driven by the helicity injection via shearing of photospheric fields or direct emergence of twisted flux. But it is unknown in observation which part of the sigmoidal structure has been expelled as part of the CME, despite that a topological reconfiguration has occurred presumably due to magnetic reconnection.
On the other hand, although coronal loops, especially post-flare loops, are the most prominent closed-field structures in active regions, they usually take a relaxed, bipolar shape, hence are not expected to bear much free energy that necessitates the birth of flares or CMEs. During solar flares, the formation of post-flare loops is associated with the motion of flare ribbons, which are essentially composed of the loop footpoints. The whole arcade of loops is also referred to as the post-eruptive arcade. It is often observed with filters of decreasing temperatures as time progresses, indicative of progressive cooling (e.g., Aschwanden & Alexander, 2001). Tripathi et al. (2004) studied 236 post-eruptive arcades in EIT 195 Å from 1997 to the end of 2002, whose average EUV emission life-time ranged from 2 to 20 h, with an average of 7 h. Li & Zhang (2009) studied the early evolution of TRACE post-flare loops resulting from 190 M- and X-class flares from May 1998 to December 2006. None of these authors reported that any post-eruptive arcade become eruptive again during its lifetime.
In a recent study of coronal loops, to our surprise, we noticed a number of events showing the gradual growth of an EUV post-eruptive arcade leading up to a CME, with the CME front bearing morphological similarities to the arcade. A similar behavior is found for some active-region loops that are located high in the corona in the first place and/or have existed for days prior to the gradual growth, referred to overlying arcades hereafter. In this paper, we study these swelling coronal arcades and explore whether they represent a distinct pre-CME structure. The rest of the paper is organized as follows: we present the observations and data analysis in Section 2. After an overview of the observations (§2.1), a few selected events are studied in more detail. Particularly, the gradual growth and the subsequent eruption of post-eruptive arcades are presented in §2.2, and that of overlying arcades in §2.3. We discuss in Section 3 the implications for CME physics.
2 Observation
2.1 Overview
| No. | Arcade | FlareccFor the event in which the corresponding active region was behind the limb, the associated flare might be occulted, therefore not being detected by GOES (“N/A”). | CME | ||||||||
|---|---|---|---|---|---|---|---|---|---|---|---|
| aaTime duration during which the apex height of the swelling arcade is measured within the EIT FOV; and are measured at and , respectively. | bbSpeed obtained by linear fit of the height-time profile at the quasi-static stage. | Type | Location | GOES | PA/AWddPosition Angle/Angular Width, which are given by the LASCO CME Catalog except that for halo CMEs the position angle refers to that of the fiducial adopted. | ee Linear speed given by the LASCO CME Catalog. | ffAcceleration given by the LASCO CME Catalog. The * symbol indicates that acceleration is uncertain due to either poor height measurement or a small number of height-time measurements. | ||||
| (hr) | (R☉) | (R☉) | (km/s) | (deg) | (km/s) | (m s-2) | |||||
| 1 | 1998-11-23 22:33 | 3.7 | 1.14 | 1.27 | 3.6 | PEA | S29W90 | X1.0 | 220/Halo | 1798 | -12.5 |
| 2 | 2001-02-02 12:00 | 6.5 | 1.27 | 1.38 | 1.7 | OA | N32E74 | C3.3 | 67/153 | 845 | 7.5 |
| 3 | 2001-04-15 00:00 | 8.8 | 1.20 | 1.38 | 1.5 | OA | S20W85 | C6.7 | 330/64 | 301 | -6.9* |
| 4 | 2002-03-23 23:12 | 12.0 | 1.19 | 1.48 | 4.7 | PEA | Occulted? | N/A | 247/62 | 375 | 0.0* |
| 5 | 2003-06-15 19:25 | 4.2 | 1.14 | 1.28 | 5.8 | PEA | S07E80 | X1.3 | 122/Halo | 2053 | -0.9 |
| 6 | 2005-01-15 12:12 | 10.4 | 1.11 | 1.35 | 2.6 | PEA | N15W05 | X2.6 | 323/Halo | 2861 | -127.4* |
| 7 | 2005-01-20 00:00 | 6.6 | 1.22 | 1.41 | 2.3 | PEA | N14W61 | X7.1 | 291/Halo | 882 | 16.0* |
| 8 | 2005-07-13 05:00 | 9.0 | 1.04 | 1.32 | 3.7 | PEA | N11W90 | M5.0 | 300/Halo | 1423 | -14.1 |
| 9 | 2005-07-13 20:36 | 8.2 | 1.09 | 1.38 | 5.4 | PEA | N10W90 | M1.0 | 282/60 | 541 | -3.4 |
| 10 | 2005-07-14 05:00 | 5.4 | 1.19 | 1.41 | 5.1 | PEA | N11W90 | X1.2 | 281/Halo | 2115 | 198.0* |
| 11 | 2005-07-14 22:24 | 11.6 | 1.12 | 1.36 | 3.2 | PEA | Occulted? | N/A | 282/62 | 629 | 39.1 |
| 12 | 2005-08-22 04:00 | 12.8 | 1.10 | 1.30 | 2.0 | PEA | S13W65 | M5.6 | 251/Halo | 2378 | 108.0* |
| 13 | 2005-08-23 02:00 | 12.4 | 1.13 | 1.30 | 1.9 | PEA | S14W90 | M2.7 | 220/Halo | 1929 | 44.2 |
| 14 | 2005-08-23 13:36 | 18.6 | 1.15 | 1.47 | 2.3 | PEA | Occulted? | N/A | 75/24 | 726 | 98.5* |
| 15 | 2006-05-01 10:14 | 4.8 | 1.12 | 1.23 | 2.6 | OA | S12W27 | C1.0 | 180/Halo | 487 | 3.0* |
| 16 | 2006-07-04 14:48 | 4.6 | 1.22 | 1.36 | 4.3 | OA | S13W14 | C1.4 | 199/102 | 308 | 1.6 |
| 8.7 | 1.15 | 1.36 | 3.3 | 1228 | 21.9 | ||||||
| 4.1 | 0.06 | 0.07 | 1.4 | 842 | 69.9 | ||||||
Note. —
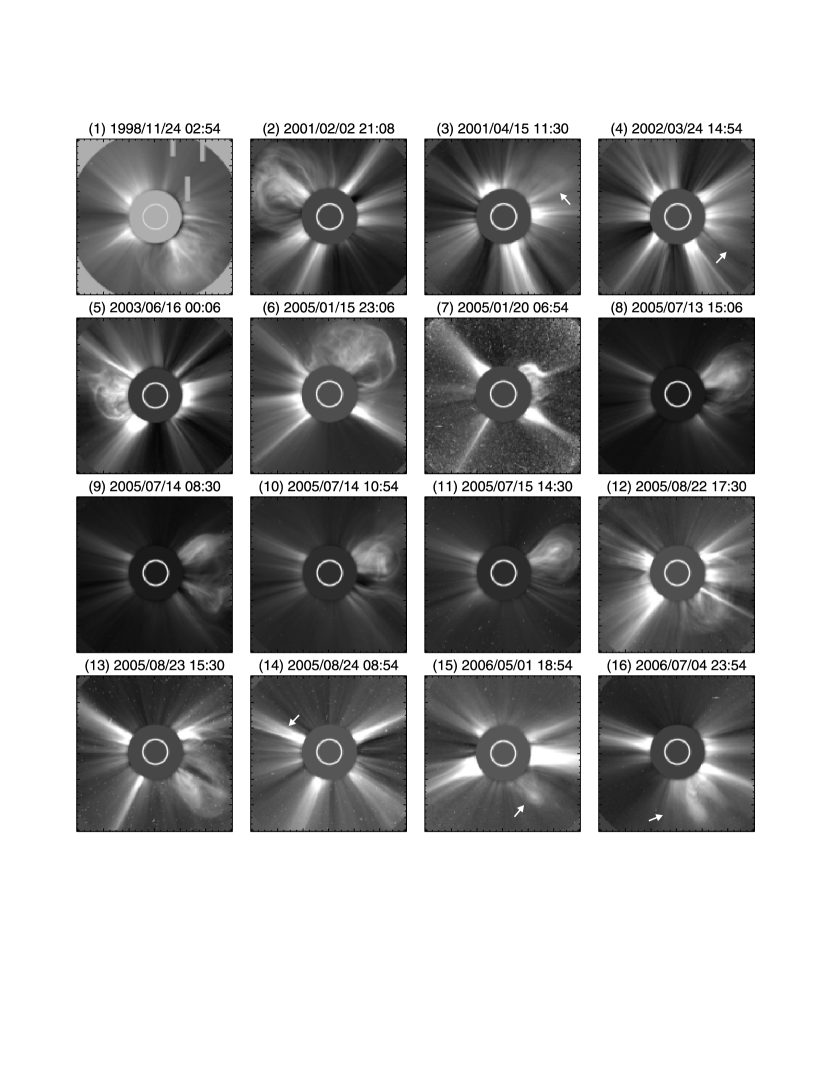
In this study, 16 events are selected as listed below in Table 1, which all feature clearly the gradual expansion of a coronal arcade leading up to a CME. The event selection is based on a survey of the SOHO EIT 195 Å data from January 1997 to October 2006, which is greatly facilitated by the “wavelet” movies (Stenborg et al., 2008)111http://lasco-www.nrl.navy.mil/index.php?p=content/wavelet. These events could have been easily missed in the raw data, but are clearly seen in the wavelet-enhanced images. They are composed of two groups of events, 1) post-eruptive arcades (PEAs; 12 events); and 2) overlying arcades (OAs; 4 events). None of the active regions of interest are of a sigmoidal shape in Yohokoh SXT or GOES SXI soft X-ray images prior to the eruption. Instead, soft X-ray data often show a diffuse arcade similar in morphology to the one observed in EUV during the gradual inflation stage, and a bright flare loop in the wake of the eruption. A note of caveat has to be made that in this study we have left out those events in which one is unable to track the same loop, e.g., a) the arcade expands beyond the EIT FOV during the early stage, which partly accounts for the scarcity of the OA events; b) higher loops of the arcade become too dim to be seen beyond a certain height.
To obtain the hight-time profile of the swelling arcades, we choose a reference point on the solar surface, draw a fiducial along the growing direction of the arcade, and record the highest point that the fiducial intersects the arcade, assuming that the arcade is oriented vertically. The reference point as well as the fiducial is made to rotate with the sun. If the arcade grows in the radial direction, the “true” height of the arcade (in ) is obtained by dividing its projected height with respect to the Sun center by the projected distance of the reference point from the Sun center. However, if the arcade is located on the limb, or its growth obviously deviates from the radial direction, only the projected distance from the arcade apex to the reference point is recorded. The distance after adding by the solar radius is then regarded as the heliocentric distance. The height of the resultant CME with time in the LASCO FOV is readily available from the LASCO CME Catalogue222http://cdaw.gsfc.nasa.gov/CME_list/. Type II radio emission, if existent, can give some idea of the evolution of the CME in the gap between the FOV of EIT and that of LASCO C2 (from to ), since it is generally interpreted as plasma emission near the local electron plasma frequency due to electrons accelerated by shock waves. The height of the supposed shock-front is obtained by examining the slowly drifting bands of emission in the radio dynamical spectra. However, it is often hard to tell not just whether the shock nose or the shock flank is observed, but whether the shock is flare-driven or CME-driven (c.f., Mancuso & Raymond, 2004)
The results of the measurement are listed in Table 1. On average, the arcades grow from R☉ to R☉ during hrs within the EIT FOV. The speed during the linear, quasi-static stage is km s-1. However, the resultant CMEs observed by SOHO LASCO are quite diverse, with a speed of km s-1 from the linear fit, and with an acceleration of m s-2 from the parabolic fit. As shown in 1, one can see that the morphologies of the CMEs are also quite diverse. Some of them, especially Events 8, 9, 10, 11 and 13, are reminiscent of the so-called “flux-rope CMEs” (e.g., Dere et al., 1999), and some of them, especially Events 5 and 6, give an impression of an arcade of loops. Only one narrow jet-like CME (Event 14) is observed for this set of events. It is also interesting that 9 of the 16 events occurred in 2005. In particular, Events 6 and 7 occurred in AR 10720, Events 8–10 in AR 10786, and Events 12 and 13 in AR 10798. This implies that such events may be specific to active region properties.
Despite the limited number of events, interestingly, CMEs building upon PEAs are obviously more energetic than those evolving from OAs, with the former propagating at a much faster speed ( km s-1) than the latter ( km s-1) within the LASCO FOV. Moreover, 8 of the 12 PEA events results in Halo CMEs while only 1 slow Halo CME (Event 15) for the 4 OA events. The PEA events are also associated with larger flares (M- and X-class) than the OA events (C-class). A question remains as to whether PEAs are distinct from OAs. Morphologically speaking, an eruption building upon a PEA often involves a series of loops spreading along the neutral line, while an OA often consists of a bundle of loops sharing compact footpoint regions. The difference may pertain to the energetics. But there is no clear distinction between PEAs and OAs in terms of the dynamical evolution, and it is hard to tell whether an OA actually evolves from a PEA.
Since coronal arcades are preferentially seen against dark background, most of the events are observed above the limb, except Events 6, 7, 12, 15, and 16. In Event 7, however, the east-west oriented arcade is located at about 60 degree to the west of the central meridian, and can only be partially seen. Hence, we will concentrate on Events 6, 12, 15 and 16 in the following subsections. Events 6 and 12 (§2.2) are PEA events, while Events 15 and 16 (§2.3) are of the OA type. Although Event 13 is also a limb event, the arcade is oriented north-south, and most importantly it resulted directly from the eruption in Event 12. Hence we will study Events 12 and 13 together (§2.2.2).
For the four disk events, we utilize MDI magnetograms to estimate the helicity accumulation in the relevant active region. We first apply the local cross-correlation tracking (LCT) method (November & Simon, 1988) to estimate the change rate of relative magnetic helicity in an open volume through a boundary surface (Chae et al., 2004; Chae & Jeong, 2005), viz.,
where is the magnetic field component normal to the surface , is the apparent horizontal velocity field component determined by the LCT technique, and is the vector potential of the potential field under the Coulomb gauge, viz., , , and . can be estimated from the MDI line-of-sight field, , viz., , where is the heliocentric angle. is then calculated from by using the fast Fourier transform method in a usual fashion. We perform LCT for all pixels with an absolute flux density greater than 5 G, but only those with cross correlation above 0.9 are used to obtain (for more details, see Park et al., 2008). The integration is carried out over the entire area of the target active region. After the helicity change rate is determined as a function of time, we integrate it with respect to time to obtain the amount of helicity accumulation,
where and are the start and end time of the helicity accumulation, respectively.
To estimate the uncertainty of helicity corresponding to the MDI measurement error ( G), we carry out a Monte Carlo simulation by adding random noise to MDI magnetograms, i.e., , where is a pseudo-random number generated by the IDL procedure RANDOMN. A series of helicity injection rates can be calculated based on these simulated magnetograms. After repeating the above procedure for 10 times, we take the resultant standard deviation as the uncertainty of the helicity injection rate. The uncertainty of the helicity accumulation is then calculated following the rules of the propagation of uncertainty.
For all of the four disk events, consistently, there is significant helicity injection into the corona prior to the flare associated with the eruption of the arcade. Details will be presented below.
2.2 Eruption of Post-Eruptive Arcades
2.2.1 Post-Eruptive Arcade on 2005 January 15
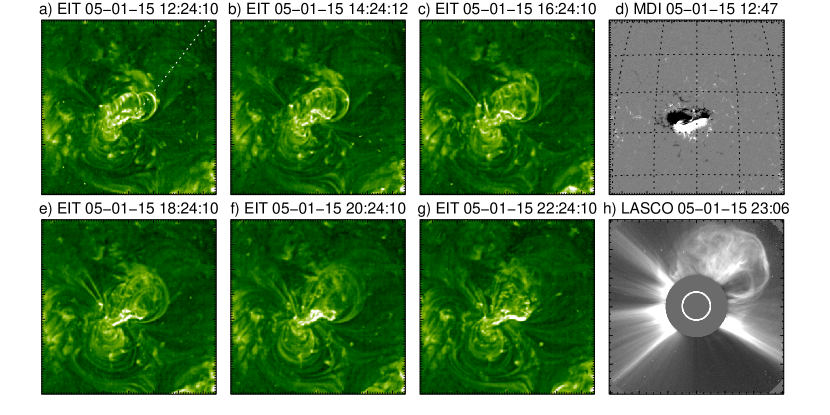
The PEA on 2005 January 15 was located in the active region NOAA 10720 (2). The arcade was produced by a Halo CME associated with a GOES-class M8.6 flare (E04N16), which peaked in soft X-rays at 06:38 UT (3(d)). Its eruption about 16 hrs later resulted in a Halo CME associated with an X2.6 flare with the peak in soft X-rays at 22:25 UT. The arcade formed as early as about 06:24 UT, but we are only interested in its evolution beyond the end of the M8.6 flare at about 12:00 UT, since the early rising of PEAs is largely attributed to the reconnection of magnetic field lines at higher and higher altitudes in the corona (Priest & Forbes, 2002). 2(a) displays a typical PEA which is composed of a series of bipolar coronal loops. The loop footpoints constitute two bright, curved flare ribbons, which are parallel to each other and aligned along the polarity inversion line of the line-of-sight photospheric field (2(d)). The gradual inflation of the arcade is clearly demonstrated in 2(a–c), but as time progressed, most loops got more and more dim. As of 18:24 UT (2(e)), only visible are the loops at the western section of the original arcade, whose height-time evolution is measured along a fiducial as indicated by the dotted line in 2(a).
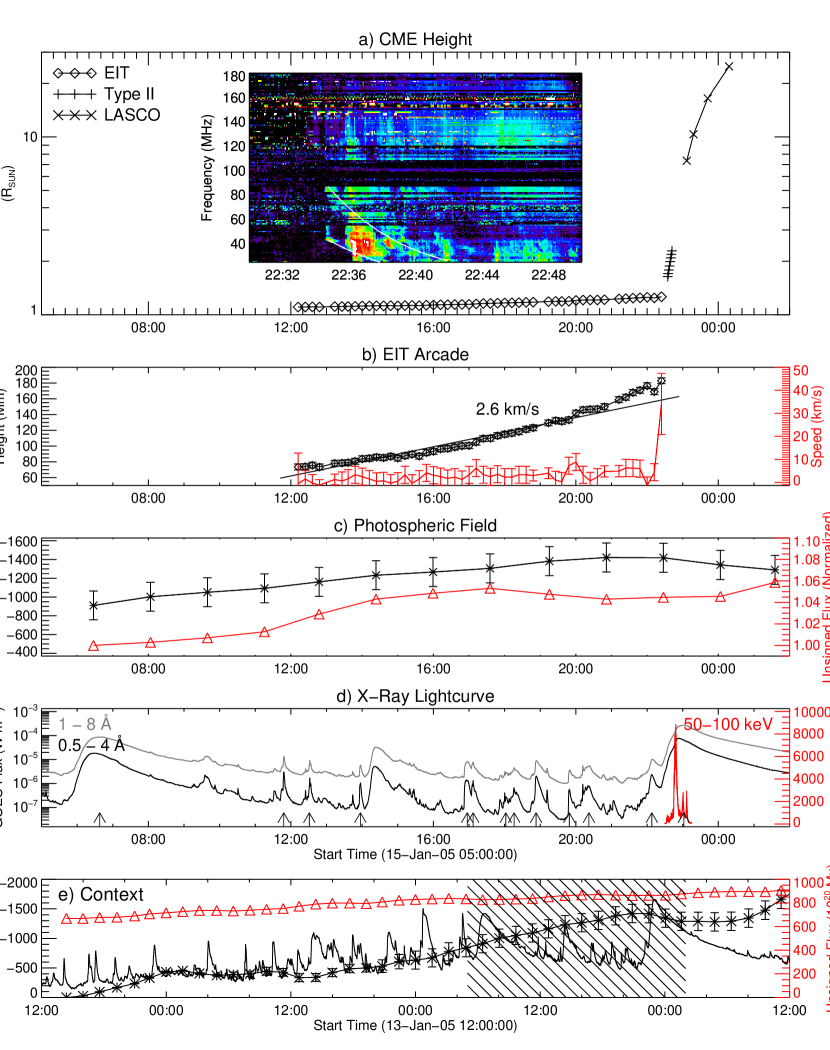
Our measurement starts from the EIT image at 12:12 UT, when one can start to track the loops of interest frame by frame. Moreover, at that time the soft X-ray flux has decreased to the background level (3(d)) so that the effect of reconnection can be reasonably ignored. One can see that despite multiple flares occurring in the same active region (as indicated by arrows at the bottom of 3(d)), the group of loops grew quasi-statically in height, at a speed of 2.6 km s-1, from about 12:12 UT until 22:24 UT when the speed suddenly increased to 50 km s-1, coincidence with the onset of the flare. The inflation process was associated with significant injection of negative helicity but with minimal flux increase (3(c)). It is interesting that the amount of helicity accumulation were apparently “saturated” before the X2.6 flare (3(e); Park et al., 2008). In the next available EIT image at 22:36 UT, the loops became invisible, but coronal dimming can be seen in the remote region close to the east limb (not shown), as a manifestation of the blasted bubble sweeping across the disk. Just prior to the speed jump, the arcade had a lower height at 22:12 UT than at both 22:00 and 22:24 UT. Note that below the arcade, a filament eruption was frustrated, associated with an M1.0 flare peaking in soft X-rays at 22:08 UT (Liu et al., 2010). The contraction of the arcade was probably due to the filament being pulled back to the surface.
2.2.2 Homologous Eruptions of Post-Eruptive Arcades on 2005 August 22 and 23
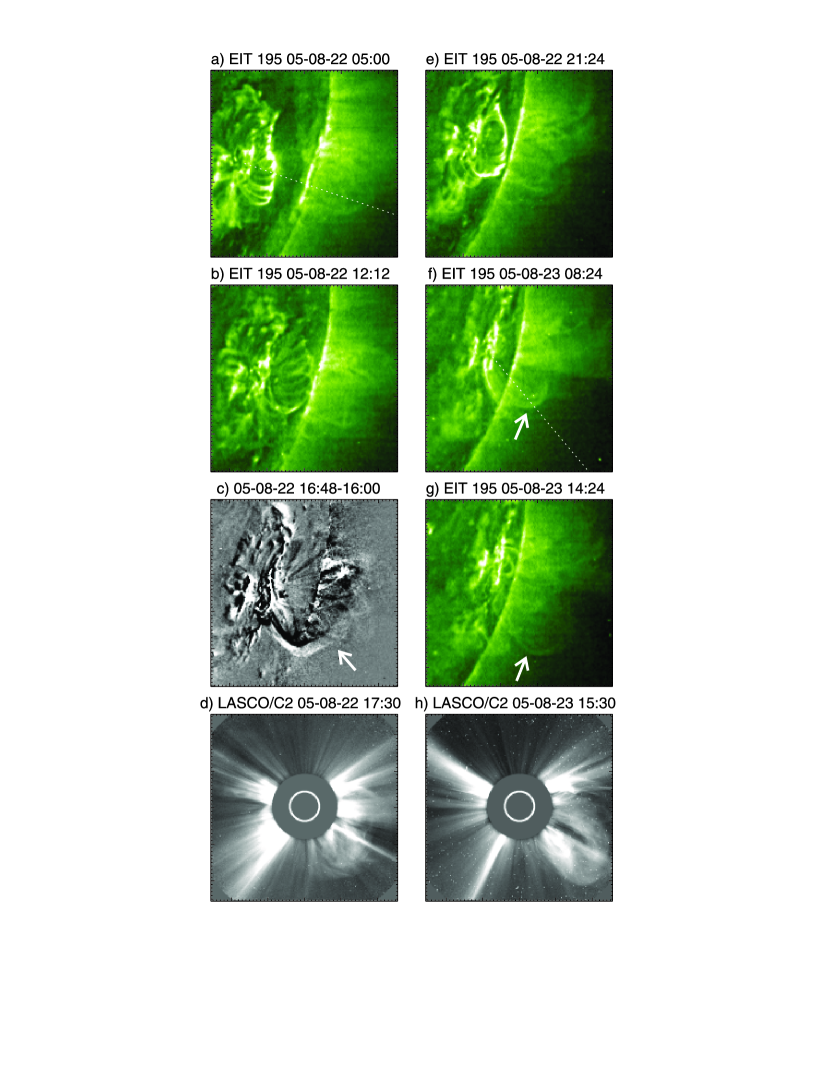
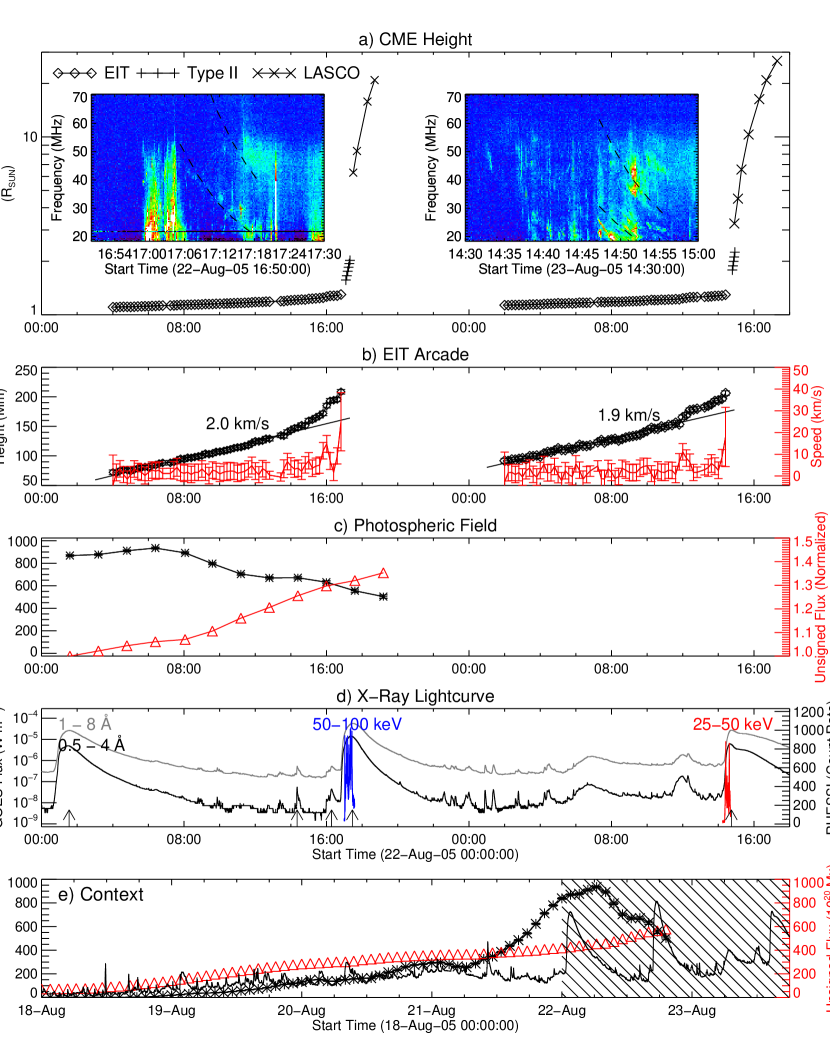
The PEAs on August 22 and 23 were located in the same active region NOAA 10798, and their evolution involved three homologous M-class flares associated with three Halo CMEs. The first PEA was produced by an M2.6 flare (W54S11) and an accompanying Halo CME at about 01:30 UT on August 22. The expansion and subsequent eruption of the arcade was associated with an M5.6 flare (W65S13) and the second Halo CME (4(d)) at about 17:30 UT on August 22 (left column of 4). The eruption yielded the second PEA, whose expansion and subsequent eruption was associated with an M2.7 flare on the limb (W90S14) and the third Halo CME (right column of 4) at about 14:30 UT on August 23. This eruption created the third PEA, which, however, failed to erupt.
The difference between the first two PEAs that subsequently erupted is that, for the earlier arcade, its eruption seems to involve the whole arcade of loops (4(a–c)), while for the later one, the eruption involved only a group of loops which were apparently highly sheared (marked by arrows in 4(f) and (g)), with the loop-plane oriented in a similar north-south direction as the neutral line. In addition, the gradual growth of the earlier arcade started during the decay phase of the M2.6 flare till the subsequent eruption that occurred about six hours after the end of the M2.6 flare; hence it is difficult to differentiate the growth due to reconnections proceeding into higher altitudes, from the growth of the loops themselves. But for the later arcade, the sheared loops only became distinctively visible when the rest of the arcade became too diffuse to be seen at about 04:00 UT on August 23. At that time, the soft X-ray flux had decayed to the background level; hence the contribution to the loop growth from reconnections can be reasonably ignored. Nevertheless, both arcades exhibited quite similar kinematic characteristics (5(a) and (b)). They both ascended slowly from to for about 12 hours at 2 km s-1. Only at the end of the quasi-static stage, for about tens of minutes, the speed increased to tens of kilometers per second. Within one hour, both CMEs were accelerated to 2000 km s-1.
When inspecting the line-of-sight magnetograms, it came to our notice that significant flux emergence was associated with the quasi-static expansion of the first PEA (see 5(c)). Meanwhile, one can see that the amount of positive helicity accumulation has continuously increased for about 4 days (see 5(e)), and only started to decrease during the gradual phase of the first M-class flare, coincident with an enhanced rate of flux emergence. Hence the newly emerged flux must be of opposite sense of helicity to the existing field. This has an important implication for the pre-CME structure, and will be discussed in §3.2. Note that the correction, (§2.1), becomes increasingly inaccurate as the target region moves further away from disk center. Hence we discontinued the calculation of the helicity injection when the center of the active region went beyond 60 degree to the west of the central meridian (2005 August 22 19:11 UT).
2.3 Eruption of Overlying Arcades
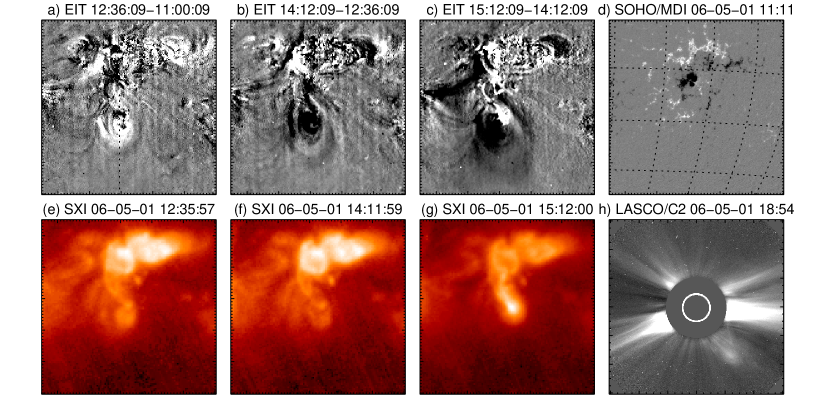
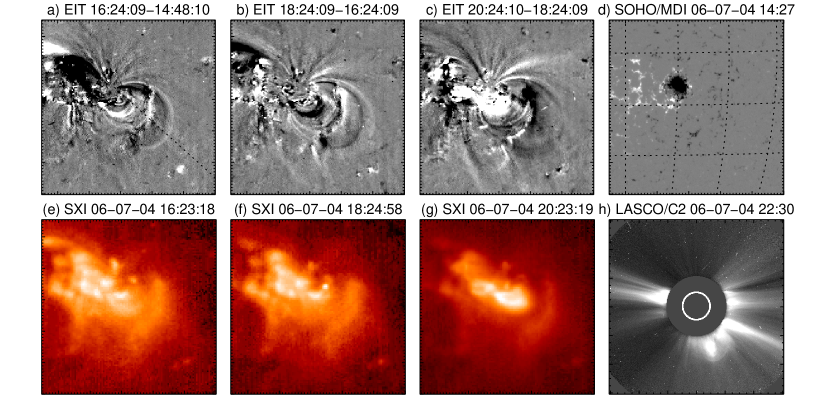
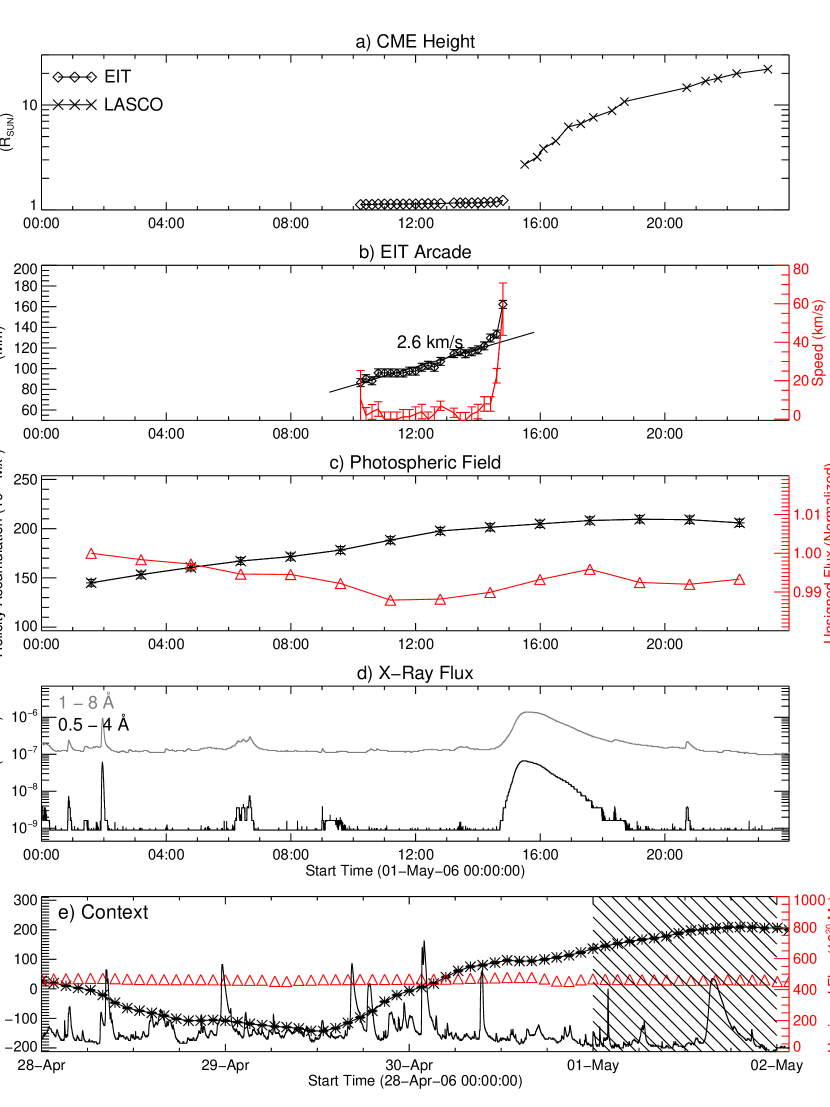
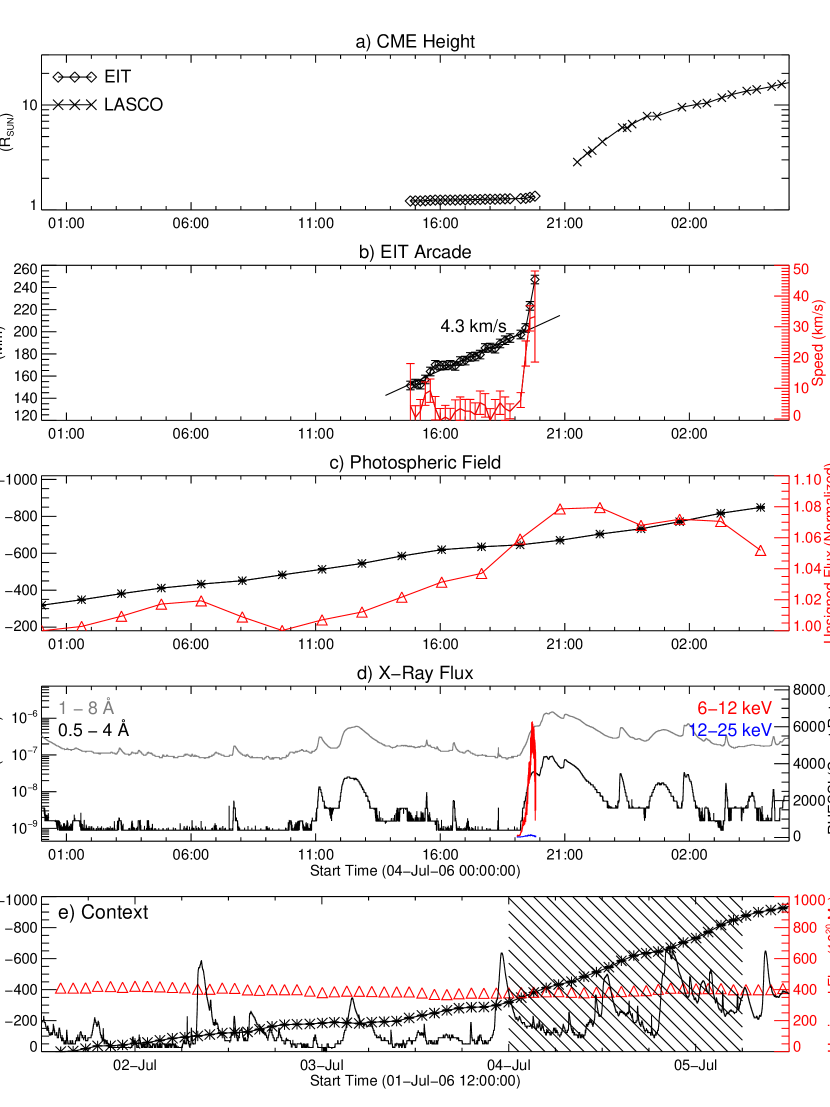
The eruption of the two OAs on the disk, namely, Events 15 (6 and 8) and 16 (7 and 9), were observed on 2006 May 1 and 2006 July 4, respectively. With the solar minimum impending, both events are much less energetic than the earlier ones. Putting side by side, they exhibit quite similar characteristics. Both arcades were overlying a decayed active region, namely, NOAA 10875 (6(d)) and NOAA 10898 (7(d)), respectively. In both events, the gradual inflation of the OA is sustained for about 4.5 hrs, at a speed of 5 km s-1, and the subsequent eruption only resulted in a C-class flare (8(d) and 9(d)). Both flares were associated with slow CMEs, although in the former event a halo CME was produced (6(h)). Like the PEA events, the morphology of the resultant CMEs bear similarities to the inflating arcades.
On the other hand, in the 2006 May 1 event, the arcade can be seen back to as early as 2006 April 28, 4 days prior to its eruption, while in the 2006 July 4 event, the overlying loops of interest only became illuminated at 14:48 UT, and their growth and subsequent eruption were observed henceforth. The loops on 2006 July 4 were located high in the corona from the beginning: the projected half length of the highest loop is about .
One may wonder how these bipolar, potential-like loops became eruptive and resulted in CMEs. GOES soft X-ray images show highly complex loops underlying the inflating arcade in both active regions (6(e–g) and 7(e–g)), but there is no sign of twisted or sheared fields, such as the well-known soft X-ray sigmoids. The quasi-static stage in both events were temporally associated with helicity injection, except that the amount of helicity accumulation flattened after the flare in the 2006 May 1 event (8(c)), while the helicity injection rate displayed no obvious change throughout the flare in the 2006 July 4 event (9(c)).
3 Discussion & Conclusion
3.1 CME Initiation & Kinematics
Zhang et al. (2001) showed a three-phase kinematic evolution for three of four CMEs well observed by LASCO C1, C2 and C3 coronagraphs from 1.1 to : the initiation phase, impulsive acceleration phase, and propagation phase. The initiation phase is characterized by a slow ascension ( 80 km s-1) over tens of minutes, which always occurs before the onset of the associated flare. The impulsive acceleration phase with a rapid acceleration of 100–500 m s-2 coincides very well with the flares’s rise phase lasting for a few to tens of minutes. The acceleration of CMEs ceases near the peak time of the soft X-ray flares. The final phase is a propagation at a constant or slowly decreasing speed. This temporal correlation between the CME velocity and the soft X-ray flux of the flare is further confirmed in CMEs characterized by intermediate and gradual acceleration (Zhang et al., 2004).
CMEs in our observations, however, feature a quasi-static inflation phase of the coronal arcade at 5 km s-1 for about 4–12 hrs, followed apparently by a similar three-phase paradigm as established by Zhang et al. (2001, 2004), during which the arcade evolves into the CME front. The gradual inflation of both PEAs and OAs seems to be a response of coronal magnetic fields to the continued injection of magnetic free energy from below, via flux emergence, or photospheric flows, as demonstrated by the increasing helicity accumulation prior to the eruption. One may argue that for PEA events the preceding eruption might not release all of the free energy available, which makes the subsequent eruption possible. However, since the quasi-static stage lasts for hours, during which the PEA sometimes survives multiple flares, we suppose that the arcade is quite stable, otherwise, a little additional energy supply or disturbance might have triggered its eruption. Therefore, it is reasonable to assume that a significant portion of the energy powering the eruption of the PEA is accumulated during the quasi-static stage. In general, the timescale of the quasi-static stage is dependent on both the stability of the pre-CME structure and the accumulation rate of magnetic free energy in the corona. There may exist a distribution of the timescale spanning from hours (for the events studied in this paper) to days (for helmet streamers). For example, Sheeley & Wang (2007) observed the gradual inflation of much higher coronal loops in the LASCO FOV, which sustains for 1–2 days at 20 km s-1 and ends with the sudden formation of a pair of inward and outward components moving at speeds of 100 km s-1 and 300 km s-1, respectively. Nevertheless, we suppose that a quasi-static stage, which corresponds to the energy accumulation in the corona, is inherent to the kinetic evolution of any CME, no matter if the pre-CME structure has the right temperature and density to be seen in a narrow filter like EIT 195 Å.
3.2 Pre-CME Configuration
While it is generally agreed that the free energy powering CMEs is most likely stored in stressed (twisted or sheared) fields, there has been contentious debate over the nature of the pre-eruption configuration. The debate focuses on two competing models, namely, flux rope models vs. sheared-arcade models. In the sheared-arcade models, a flux rope is formed via magnetic reconnection during the course of the eruption (e.g., Antiochos et al., 1999). Hence it has been argued that a pre-existent flux rope is unnecessary for solar eruptions. On the other hand, the flux rope configuration provides a natural explanation for the three-part structure of CMEs and their quiescent counterparts, i.e., helmet streamers (Low, 1996, 2001). CMEs that exhibit circular intensity patterns have also been interpreted as a manifestation of helical magnetic fields, therefore being termed flux-rope CMEs (e.g., Dere et al., 1999). Recently, Gary & Moore (2004) reported the eruption of a multi-turn helix from within a region of sheared magnetic field. The presence of twisting and kinking motions in eruptive prominences further argues for the existence of flux ropes in the corona (e.g., Alexander et al., 2006; Liu et al., 2007b). While these morphological studies demonstrate that flux ropes are indeed associated with CMEs, it is still unknown whether they are present prior to solar eruptions, although their presence “after” the eruption have been confirmed by in-situ observations of rotating magnetic fields (Burlaga et al., 1981).
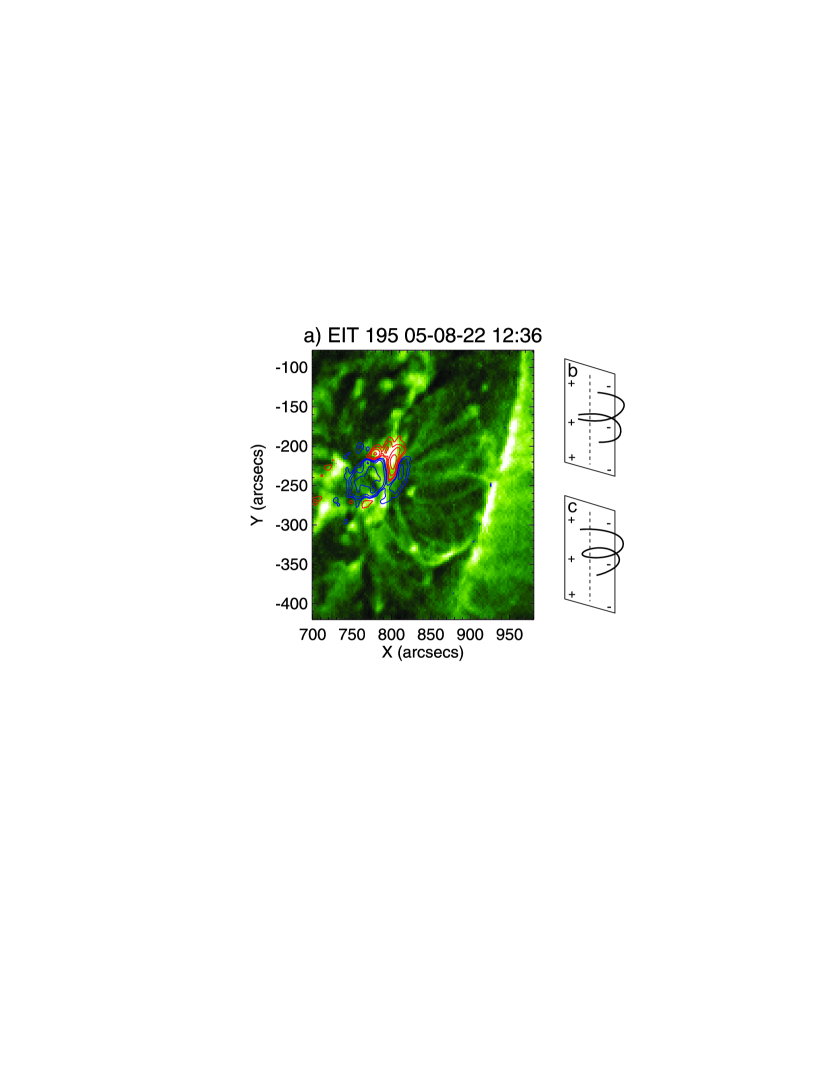
The inflation of coronal fields can be attributed either to the shearing of the magnetic footpoints, or to the emergence of new flux. However, the eruption of the whole PEA such as the 2005 August 22 event (4(a–c)) poses a severe constraint on the energetics of the eruption, since it has been demonstrated that a bipolar force-free field is at its maximum energy when the field is completely “open” (Aly, 1984, 1991; Sturrock, 1991). A multipolar topology as proposed in the break-out model (Antiochos et al., 1999) can help to circumvent the so-called Aly-Sturrock limit, since only one of the bipolar arcades is opened up. Indeed AR 10798 that hosted the 2005 August 22 PEA displays a quadrupolar field topology, as demonstrated by the contours of the SOHO MDI magnetogram (10(a)).
Alternatively, studies have shown that the Aly-Sturrock limit can be bypassed if the coronal field contains a detached flux rope (e.g., Wolfson, 2003; Flyer et al., 2004). Intriguingly, a swirling structure can be seen in the center of the 2005 August 22 arcade as early as 12:12 UT (4(b)), and was most obvious at 12:36 UT (10(a)), over four hours before the onset of the M5.6 flare at about 16:46 UT. Ambiguity in interpreting this structure exists due to the limitation of the two-dimensional observation. It could be composed of two sheared loops as illustrated in 10(b), or a truly twisted structure as in 10(c). The former configuration, however, requires the two loops to be sheared in opposite directions on both sides of the neutral line (denoted by the dashed line). Hence, the latter configuration, namely, a flux rope, offers a more natural explanation. For the 2005 January 15 event (§2.2.1), Cheng et al. (2010) showed that a flux rope was located below the rising arcade via nonlinear force-free-field modeling.
As part of the PEA, the flux rope must be generated in the corona, via three possible ways, viz., a) reconnection of sheared magnetic fields (e.g., van Ballegooijen & Martens, 1989); b) reconnection within the flux rope involved in the preceding eruption, which is therefore a partial eruption (Gilbert et al., 2007); and c) the emergence of a fresh magnetic field of the opposite helicity into a preexisting coronal field, which is observed for the 2005 August 22 event (§2.2.2). Zhang & Low (2003) argued that with the flux emergence reconnection should take place between the two flux systems to take the field to a minimum-energy state, and that this relaxation process that keeps the total helicity conserved may result in the formation of magnetic flux ropes. Thus, the pre-CME structure like the 2005 August 22 PEA may posses a pre-existent flux rope, a magnetic configuration that many suggest for the cavity structure of the helmet streamer. We have noticed that helmet streamers undergo similar slow inflation before erupting into interplanetary space (e.g., Gibson et al., 2006), and that some coronal helmet streamers were reported to be temporarily visible in X-rays, high above the rising post-flare loops (e.g., Svestka et al., 1997).
3.3 Flare-CME Relationship
There is a longstanding debate on the flare-CME relationship in the solar physics community: whether flares are the cause of CMEs or the other way around (Gosling, 1993). Harrison (1995) presented a comprehensive review on the flare-CME relationship before the launch of SOHO, and concluded that they do not drive one another but are closely related. Using SOHO LASCO data, Zhang et al. (2001, 2004) demonstrated that a close temporal correlation exists between the CME velocity and the soft X-ray flux of the flare. Due to the Neupert effect (Neupert, 1968), a similar correlation exists between the CME acceleration and the derivative of soft X-ray flux, suggesting that the CME large-scale acceleration and the flare particle acceleration are strongly coupled. Lin (2004) treated the flare, prominence and CME as integral constituents of a single process within the framework of the catastrophe model, and suggested that the flare-CME correlation depends on the free energy stored in the relevant magnetic structure: the more free energy, the better correlation.
Zhang & Low (2005), alternatively, suggested that flares and CMEs play different roles in the MHD processes driving eruptions. They noticed that although flares can dissipate excessive magnetic free energy, it is CMEs that shed the excessive helicity in the corona. Due to the probable existence of an upper bound on the total magnetic helicity in the corona (Zhang et al., 2006), CMEs could be the consequence of accumulating helicity which is generated by the dynamo and transported through the photosphere into the corona. This physical view is supported by some statistical studies, e.g., Nindos & Andrews (2004) found that, in a statistical sense, active regions producing flares associated with CMEs have a larger quantity of estimated magnetic helicity than those producing flares without any CME.
Our observations show some characteristics in support of Zhang & Low (2005). The quasi-static inflation of the pre-CME arcade sustains for hours, during which multiple flares have usually occurred in the same active region, but fail to affect the evolution of the arcade. Thus, the pre-CME structure, namely, the inflating arcade, is arguably independent of the flares during the quasi-static phase, but is closely coupled with the flare during the acceleration phase. Taken Event 6 for example (3), at least 11 flares, including two M-class flares and nine C-class flares, occurred in the vicinity of the arcade during its quasi-static inflation stage, but none of them has significant effect on the evolution of the arcade. Are flares with and without CMEs distinctly different from each other? Yashiro et al. (2006) reported that the power-law distributions for peak fluxes, fluences and duration are significantly steeper for flares without CMEs than for flares associated with CMEs. Further investigation is desired on the underlying physics leading to the distinctive statistical characteristics.
To summarize, we have identified a group of active-region coronal arcades, which mainly consist of post-eruptive arcades, and whose gradual inflation build up to CMEs. The quasi-static inflation stage sustains for hours at a speed of less than 5 km s-1. It is temporally associated with significant helicity injection from photosphere, and followed by a frequently observed three-phase CME evolution paradigm, as the arcade, which may have survived multiple flares, suddenly erupts as a CME.
References
- Alexander et al. (2006) Alexander, D., Liu, R., & Gilbert, H. R. 2006, ApJ, 653, 719
- Aly (1984) Aly, J. J. 1984, ApJ, 283, 349
- Aly (1991) —. 1991, ApJ, 375, L61
- Antiochos et al. (1999) Antiochos, S. K., DeVore, C. R., & Klimchuk, J. A. 1999, ApJ, 510, 485
- Aschwanden & Alexander (2001) Aschwanden, M. J. & Alexander, D. 2001, Sol. Phys., 204, 91
- Burkepile et al. (2004) Burkepile, J. T., Hundhausen, A. J., Stanger, A. L., St. Cyr, O. C., & Seiden, J. A. 2004, Journal of Geophysical Research (Space Physics), 109, 3103
- Burlaga et al. (1981) Burlaga, L., Sittler, E., Mariani, F., & Schwenn, R. 1981, J. Geophys. Res., 86, 6673
- Canfield et al. (1999) Canfield, R. C., Hudson, H. S., & McKenzie, D. E. 1999, Geophys. Res. Lett., 26, 627
- Chae & Jeong (2005) Chae, J. & Jeong, H. 2005, Journal of Korean Astronomical Society, 38, 295
- Chae et al. (2004) Chae, J., Moon, Y., & Park, Y. 2004, Sol. Phys., 223, 39
- Cheng et al. (2010) Cheng, X., Ding, M. D., Guo, Y., Zhang, J., Jing, J., & Wiegelmann, T. 2010, ApJ, 716, L68
- Dere et al. (1999) Dere, K. P., Brueckner, G. E., Howard, R. A., Michels, D. J., & Delaboudiniere, J. P. 1999, ApJ, 516, 465
- Flyer et al. (2004) Flyer, N., Fornberg, B., Thomas, S., & Low, B. C. 2004, ApJ, 606, 1210
- Gary & Moore (2004) Gary, G. A. & Moore, R. L. 2004, ApJ, 611, 545
- Gibson et al. (2006) Gibson, S. E., Foster, D., Burkepile, J., et al. 2006, ApJ, 641, 590
- Gilbert et al. (2007) Gilbert, H. R., Alexander, D., & Liu, R. 2007, Sol. Phys., 245, 287
- Gopalswamy et al. (2006) Gopalswamy, N., Mikić, Z., Maia, D., Alexander, D., Cremades, H., Kaufmann, P., Tripathi, D., & Wang, Y. 2006, Space Science Reviews, 123, 303
- Gosling (1993) Gosling, J. T. 1993, J. Geophys. Res., 98, 18937
- Gosling et al. (1976) Gosling, J. T., Hildner, E., MacQueen, R. M., Munro, R. H., Poland, A. I., & Ross, C. L. 1976, Sol. Phys., 48, 389
- Harrison (1995) Harrison, R. A. 1995, A&A, 304, 585
- Illing & Hundhausen (1986) Illing, R. M. E. & Hundhausen, A. J. 1986, J. Geophys. Res., 91, 10951
- Li & Zhang (2009) Li, L. & Zhang, J. 2009, ApJ, 690, 347
- Lin (2004) Lin, J. 2004, Sol. Phys., 219, 169
- Liu et al. (2010) Liu, C., Lee, J., Jing, J., Liu, R., Deng, N., & Wang, H. 2010, ApJ, submitted
- Liu et al. (2007a) Liu, C., Lee, J., Yurchyshyn, V., Deng, N., Cho, K., Karlický, M., & Wang, H. 2007a, ApJ, 669, 1372
- Liu et al. (2007b) Liu, R., Alexander, D., & Gilbert, H. R. 2007b, ApJ, 661, 1260
- Low (1996) Low, B. C. 1996, Sol. Phys., 167, 217
- Low (2001) —. 2001, J. Geophys. Res., 106, 25141
- MacQueen & Fisher (1983) MacQueen, R. M. & Fisher, R. R. 1983, Sol. Phys., 89, 89
- Mancuso & Raymond (2004) Mancuso, S. & Raymond, J. C. 2004, A&A, 413, 363
- Moore et al. (2001) Moore, R. L., Sterling, A. C., Hudson, H. S., & Lemen, J. R. 2001, ApJ, 552, 833
- Neupert (1968) Neupert, W. M. 1968, ApJ, 153, L59
- Nindos & Andrews (2004) Nindos, A. & Andrews, M. D. 2004, ApJ, 616, L175
- November & Simon (1988) November, L. J. & Simon, G. W. 1988, ApJ, 333, 427
- Park et al. (2008) Park, S., Lee, J., Choe, G. S., Chae, J., Jeong, H., Yang, G., Jing, J., & Wang, H. 2008, ApJ, 686, 1397
- Pevtsov (2002) Pevtsov, A. A. 2002, Sol. Phys., 207, 111
- Priest & Forbes (2002) Priest, E. R. & Forbes, T. G. 2002, A&A Rev., 10, 313
- Sheeley et al. (1999) Sheeley, N. R., Walters, J. H., Wang, Y.-M., & Howard, R. A. 1999, J. Geophys. Res., 104, 24739
- Sheeley & Wang (2007) Sheeley, Jr., N. R. & Wang, Y. 2007, ApJ, 655, 1142
- Srivastava et al. (1999) Srivastava, N., Schwenn, R., & Stenborg, G. 1999, in ESA Special Publication, Vol. 446, 8th SOHO Workshop: Plasma Dynamics and Diagnostics in the Solar Transition Region and Corona, ed. J.-C. Vial & B. Kaldeich-Schü, 621–626
- Stenborg & Cobelli (2003) Stenborg, G. & Cobelli, P. J. 2003, A&A, 398, 1185
- Stenborg et al. (2008) Stenborg, G., Vourlidas, A., & Howard, R. A. 2008, ApJ, 674, 1201
- Sterling et al. (2000) Sterling, A. C., Hudson, H. S., Thompson, B. J., & Zarro, D. M. 2000, ApJ, 532, 628
- Sturrock (1991) Sturrock, P. A. 1991, ApJ, 380, 655
- Svestka et al. (1997) Svestka, Z., Farnik, F., Hick, P., Hudson, H. S., & Uchida, Y. 1997, Sol. Phys., 176, 355
- Tripathi et al. (2004) Tripathi, D., Bothmer, V., & Cremades, H. 2004, A&A, 422, 337
- van Ballegooijen & Martens (1989) van Ballegooijen, A. A. & Martens, P. C. H. 1989, ApJ, 343, 971
- Vršnak et al. (2005) Vršnak, B., Sudar, D., & Ruždjak, D. 2005, A&A, 435, 1149
- Wolfson (2003) Wolfson, R. 2003, ApJ, 593, 1208
- Yashiro et al. (2006) Yashiro, S., Akiyama, S., Gopalswamy, N., & Howard, R. A. 2006, ApJ, 650, L143
- Yurchyshyn et al. (2005) Yurchyshyn, V., Yashiro, S., Abramenko, V., Wang, H., & Gopalswamy, N. 2005, ApJ, 619, 599
- Zhang et al. (2001) Zhang, J., Dere, K. P., Howard, R. A., Kundu, M. R., & White, S. M. 2001, ApJ, 559, 452
- Zhang et al. (2004) Zhang, J., Dere, K. P., Howard, R. A., & Vourlidas, A. 2004, ApJ, 604, 420
- Zhang et al. (2006) Zhang, M., Flyer, N., & Low, B. C. 2006, ApJ, 644, 575
- Zhang & Low (2003) Zhang, M. & Low, B. C. 2003, ApJ, 584, 479
- Zhang & Low (2005) —. 2005, ARA&A, 43, 103