An Application of a Self-consistent Mean-field Theoretical Model to POPC-PSM-Cholesterol Bilayers
Abstract
The connection between membrane inhomogeneity and the structural basis of lipid rafts has sparked interest in the lateral organization of model lipid bilayers of two and three components. In an effort to investigate anisotropic lipid distribution in mixed bilayers, a self-consistent mean-field theoretical model is applied to palmitoyloleoylphosphatidylcholine (POPC) - palmitoyl sphingomyelin (PSM) - Cholesterol mixtures. The compositional dependence of lateral organization in these mixtures is mapped onto a ternary plot. The model utilizes molecular dynamics simulations to estimate interaction parameters and to construct chain conformation libraries. We find that at some concentration ratios the bilayers separate spatially into regions of higher and lower chain order coinciding with areas enriched with PSM and POPC respectively. To examine the effect of the asymmetric chain structure of POPC on bilayer lateral inhomogeneity, we consider POPC-POPC interactions with and without angular dependence. Results are compared with experimental data and with results from a similar model for mixtures of dioleoylphosphatidylcholine (DOPC) , steroyl sphingomyelin, and Cholesterol.
pacs:
87.16.-b, 87.16.D-, 64.70.Ja, 81.30.Dz, 64.75+gI Introduction
The membranes of cells are composed of a variety of amphipathic lipids that spontaneously form bilayers in the presence of water. In nature, the lipids of typical plasma membranes vary by head-group, chain length, and chain saturation. The exact composition, as well as external factors such as temperature and pressure, strongly affect the properties of the membrane, so many experiments have been aimed at characterizing model lipid bilayers of different compositions as a function of these external factors Veatch and Keller (2005); Haluska et al. (2008); Kahya et al. (2003); Veatch and Keller (2002); Stottrup et al. (2005); Aittoniemi et al. (2007); Zhang et al. (2007); de Almeida et al. (2007); Lindblom et al. (2006); Zhao et al. (2007a); Collins and Keller (2008); Heberle et al. (2005); Moore et al. (2006); Zheng et al. (2007); Zhao et al. (2007b); Filippov et al. (2007, 2003); Cicuta et al. (2007); Castro et al. (2007); Bakht et al. (2007); Frazier et al. (2007); Ursell et al. (2009); Veatch et al. (2007); Pokorny et al. (2006); Bunge et al. (2008); Halling et al. (2008); de Almeida et al. (2003); Tsamaloukas et al. (2006). In particular, the lateral organization of ternary-component mixtures has been of recent interest because they contain essential ingredients for the formation of lipid rafts, under the right conditions. Lipid rafts have been the subject of a number of reviews Lingwood and Simons (2010); Simons and Ikonen (1997); Edidin (2003); Jacobson et al. (2007); Hancock (2006); Pike (2003, 2004) where they are described as nanometer-scale sphingolipid and cholesterol-enriched domains whose importance ranges from signal transduction to organization of bioactivity in cell membranes.
Bilayers composed of a single lipid type can undergo a main-chain phase transition between a liquid disordered phase, , and a gel phase, , as a phase transition temperature, , unique to the lipid type, is traversed. The phase is characterized by highly mobile lipids with disordered chains, while in the state the lipids are much less mobile and their chains are more ordered.
A side-by-side comparison of two bilayers of nearly identical composition, with only a minor difference such as the presence of a double bond in one of the lipid chains, can underscore the complex nature of real cell membranes. For example, dioleoylphosphatidylcholine (DOPC) has two mono-unsaturated 18-carbon fatty acid chains, while in palmitoyloleoylphosphatidylcholine (POPC) one of those is replaced by a 16-carbon saturated chain. As a result, the DOPC main-chain phase transition temperature is lower than that of the POPC temperature by 26. Additionally, the area per lipid of POPC bilayers, 65 Å2 Yeagle (1993), is significantly lower than that of DOPC bilayers, 72 Å2 Lantzsch et al. (1994). The presence or absence of the double bond clearly plays a role in how well neighboring lipids pack with each other, which in turn determines the physical properties of the bilayer.
Binary mixtures of low phosphatidylcholines and high phosphatidylcholines or sphingomyelin (SM) can exhibit phase separation between the phase and phase at temperatures intermediate to their respective melting points de Almeida et al. (2003); Veatch and Keller (2005, 2003); Korlach et al. (1999). The phase coexistence depends upon the relative concentrations of each lipid type, and can be observed directly in fluorescence microscopy experiments Veatch and Keller (2005, 2003).
Cholesterol (CHOL), another major membrane lipid, has a strong and complex effect on bilayer properties. CHOL has a tendency to induce order in the chains of -phase lipid bilayers and increase mobility of -phase lipid bilayers. When the CHOL concentration is above about 15% the resulting structural state is sometimes called the liquid ordered phase, , and is characterized by highly ordered, yet mobile chains. The phase behavior of binary mixtures of CHOL and other membrane lipids has been studied extensively Vist and Davis (1990); McMullen and McElhaney (1995); de Almeida et al. (2003); Mateo et al. (1995); Khelashvili et al. (2005); Pandit et al. (2007). Pan et al. Pan et al. (2009) find that CHOL-lipid interactions depend on the number of saturated chains present, affecting physical properties such as bending modulus, area per lipid, and order parameter. Other studies Ramstedt and Slotte (2006); Tsamaloukas et al. (2006); Halling et al. (2008); Aittoniemi et al. (2007) indicate that CHOL has a higher affinity for one lipid type over another, for example dipalmitoyl phosphatidylcholine (DPPC) or di-saturated sphingomyelin (SM) over POPC. CHOL shows a unique level of specificity in inducing order because the two “faces” of CHOL are structurally distinct. Here, “face” refers to the sides of the flat fused ring structure of CHOL, one of which has protruding methyl groups (rough face), while the other does not (smooth face). Pandit et al. Pandit et al. (2008) utilize atomic-level simulations of lipid-CHOL mixtures to reveal that the effective molecular area of CHOL is smaller in POPC than in DOPC and even in DPPC. They attribute this effect to a combination of the anisotropic chain structure of POPC and the anisotropic faces of CHOL.
This differential behavior of CHOL in lipids must have a strong effect on the lateral organization of ternary component mixtures consisting of a high lipid, a low lipid, and CHOL. Experiments Veatch and Keller (2005); Frazier et al. (2007); de Almeida et al. (2003); Bunge et al. (2008); Pokorny et al. (2006); Baumgart et al. (2007); Morales-Penningston et al. (2010) consistently indicate that these ternary component mixtures have a complex lateral structure that is highly dependent on the relative abundance of components and external parameters such as temperature and pressure. In particular, at certain concentration ratios, the liquid phases and are known to coexist and are the basis for the concept of “lipid rafts” which are believed to exist in biological plasma membranes Jacobson et al. (2007); Marsh (2009); Pike (2003, 2004), and are implicated in a number of biologically important cellular functions (See e.g. Hancock (2006); Simons and Ikonen (1997)).
A number of experimental treatments of ternary mixtures have been published Haluska et al. (2008); Kahya et al. (2003); Veatch and Keller (2002); Stottrup et al. (2005); Aittoniemi et al. (2007); Zhang et al. (2007); de Almeida et al. (2007); Lindblom et al. (2006); Zhao et al. (2007a); Collins and Keller (2008); Heberle et al. (2005); Moore et al. (2006); Zheng et al. (2007); Zhao et al. (2007b); Filippov et al. (2007, 2003); Cicuta et al. (2007); Castro et al. (2007); Bakht et al. (2007); Frazier et al. (2007); Ursell et al. (2009); Veatch et al. (2007); Lichtenberg et al. (2005), but the details on the formation of rafts in POPC-SM-CHOL mixtures remains a subject of debate. A number of experimental studies have treated specifically this system Marsh (2009); Pokorny et al. (2006); Bunge et al. (2008); Halling et al. (2008); de Almeida et al. (2003); Frazier et al. (2007); Tsamaloukas et al. (2006). Veatch and Keller Veatch and Keller (2005) report liquid-liquid phase coexistence in giant unilamellar vesicles using fluorescence microscopy. Zhao et al. Zhao et al. (2007b) do not observe liquid-liquid phase separation in POPC-SM-Chol mixtures at the micron level. They do observe and phase coexistence and suggest that domains may exist in smaller sub-micron clusters. Overall, current experimental studies underscore a need to carefully probe subtle atomic level effects in the POPC-SM-CHOL ternary system.
Several recent theoretical models have been published that describe bilayer phase behavior in three-component systems. Putzel et al. Putzel and Schick (2008, 2009) have proposed a phenomenological model intended to elucidate the mechanism for phase separation in ternary lipid systems by examining phenomenological free energy functions for mixtures consisting of saturated-chain lipids, unsaturated-chain lipids and CHOL. They were able to reproduce ternary phase diagrams that are consistent with those proposed by experiment. Elliot et al. Elliott et al. (2006, 2005) have proposed a self-consistent mean-field theoretical (SCMFT) model of a three-component system that treats chain interactions at an atomic level. The model employs equilibrium statistical mechanical analysis to construct ternary diagrams with phase boundaries whose presence and location are modulated by interaction parameters. We recently published a model for ternary lipid mixtures that we applied specifically to DOPC-Steroyl sphingomyelin (SSM)-CHOL bilayers Tumaneng et al. (2010). The model projected three-dimensional lipid bilayer leaflets onto two-dimensional fields of chain order over which CHOL could diffuse. This model, based on a combination of equilibrium statistical mechanics and Langevin plus Cahn-Hilliard dynamics, described temporal organization of the mixed bilayer. Results were displayed on a triangle diagram that agreed well with experiment for DOPC-SM-CHOL mixtures.
In this paper we present a model of ternary-component lipid bilayers that builds on our previous modeling work Tumaneng et al. (2010); Khelashvili et al. (2005); Pandit et al. (2007); Pandit and Scott (2009) to include lipids with non-identical chains. This model differs from other computational and theoretical models Putzel and Schick (2008, 2009); Shi and Voth (2005); Idema et al. (2009); Elliott et al. (2006, 2005); Fattal and Ben-Shaul (1994); Ben-Shaul et al. (1985); Gruen (1985); Müller et al. (2006); McConnell (2009); Risselada and Marrink (2008) in that it utilizes atomistic molecular dynamics (MD)-generated data as input to a self-consistent mean-field theoretical (SCMFT) model that is used to characterize the structure and temporal evolution of ternary phase diagrams. We apply the model to POPC - Palmitoyl sphingomyelin (PSM) - CHOL mixtures, but the methodology can be generalized to include any two-chain lipid ternary mixture. To account for the asymmetric chain structure of the POPC molecule, an orientational component for POPC is added to the interaction energy function. We show below that the effect of including orientational dependence is to slightly amplify the separation of lipids into regions rich in PSM separated from regions rich in POPC. Comparison with our SCMFT simulations of DOPC-SSM-CHOL Tumaneng et al. (2010) reveals that the degree of lateral organization in POPC-PSM-CHOL mixtures is reduced, and differences between order parameters in separated domains is more subtle. In the next section, the POPC-PSM-CHOL ternary system is described. Subsequent sections present our results and discussion.
II Theoretical Model
In our SCMFT model, Tumaneng et al. (2010); Khelashvili et al. (2005); Pandit et al. (2007); Pandit and Scott (2009), a three-dimensional lipid bilayer leaflet is cast as a two-dimensional field of weighted, chain-averaged order parameters:
| (1) |
where the weighting fraction represents the fraction of dihedrals in a trans configuration () along a single chain to the number of dihedrals along that chain (). is the angle between the C-H bond vector and the bilayer normal for carbon m for the chain at the position . CHOL molecules are treated as two-dimensional ‘rods’ that are free to diffuse through the order parameter field. Coupled to this order parameter field is a composition field whose purpose is to identify the concentration of lipid type at any point. Both fields are discretized onto an underlying lattice for computation. The overall model methodologies are as follows: Langevin dynamics are used to propagate CHOL molecules over the two dimensional fields, and to locally reorient POPC molecules. Cahn-Hilliard dynamics are used to model the evolution of lateral compositional order in the composition field. Mean field statistical mechanics is employed to recalculate the order parameter field after each dynamical timestep. These methods are described in the following subsections.
II.1 The POPC-PSM-CHOL Ternary System
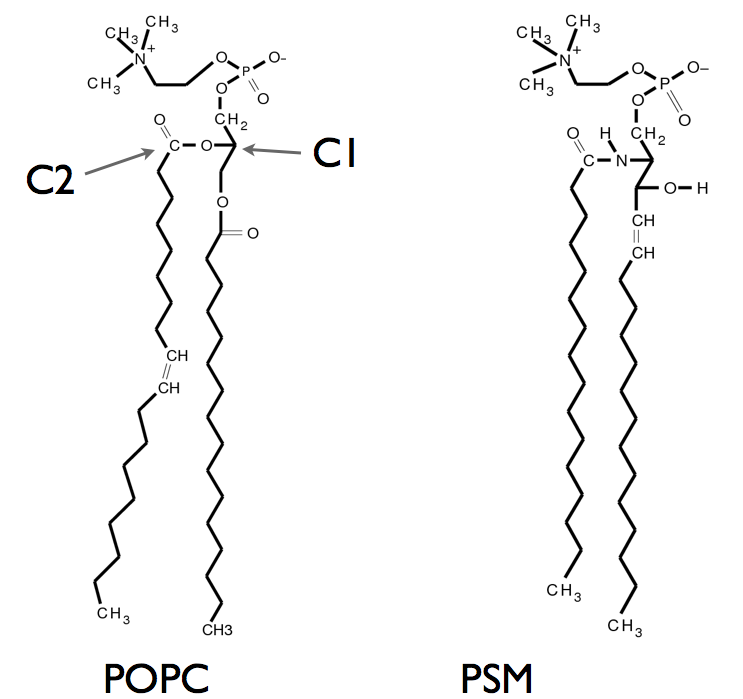
The structures of POPC and PSM are shown in Fig 1. POPC has two non-identical hydrocarbon chains; one saturated palmitoyl (16:0) chain and one unsaturated oleoyl (18:1) chain. PSM ((16:0)SM) consists of a palmitoyl chain attached to a sphingosine backbone. PSM has a higher main-chain phase transition temperature (40) Maulik and Shipley (1996) than POPC (-3). For this model, we focus on the temperature range intermediate to the two phase transition temperatures, namely 30∘ C.
In contrast to our previous implementation of the SCMFT model Tumaneng et al. (2010) for DOPC-SSM-CHOL mixtures, we now consider a case where the low melting point lipid, POPC, has nonequivalent acyl chains. To address the nonequivalence of POPC chains, we consider the effect of adding an orientation degree of freedom to each POPC molecule, as we describe below. Modifications to the previous model Tumaneng et al. (2010) include redefining the order parameter, making adjustments to the Hamiltonian and mean-field free energy, and modifying the method of updating time steps. The modifications are summarized in the following subsections.
II.2 Order Parameter Field and Angle Field
The SCMFT model Tumaneng et al. (2010); Khelashvili et al. (2005); Pandit et al. (2007); Pandit and Scott (2009) we previously applied to binary and ternary mixtures of lipids with two chains of identical structure projected single chain order parameters onto a two dimensional lattice. Lattice grid sites were spaced at a distance calculated from MD simulations as the average distance between two neighboring chains. To incorporate the asymmetric structure of POPC molecules, we now define a ‘whole-molecule’ order parameter for each site as an average:
| (2) |
where and are the order parameters for the two chains on each molecule, as defined in Eq 1. In this work, we take the lattice spacing to be the average nearest neighbor center of mass distance between molecules. Although the two chains in PSM do not differ appreciably in order parameter value, PSM moleular order parameters are also calculated using Eq 2 to keep the model internally consistent.
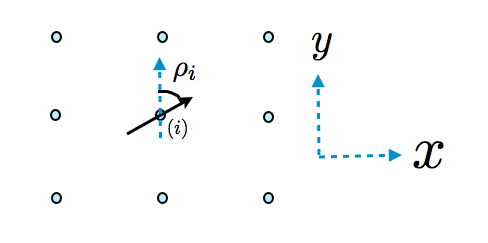
In order to incorporate the asymmetric structure of POPC molecules, a molecular orientation variable, , is introduced and is associated with each lattice point that contains all or part of a POPC in the local concentration field. For a POPC molecule, is calculated as the angle made between a vector which points from the atom labeled ‘c1’ towards the atom labeled ‘c2’ in Fig 1 and a fixed direction in the plane of the bilayer (Fig 2)
The angle field is assumed to evolve dynamically according to a Langevin equation:
| (3) |
is the mobility of the angle as it diffuses azimthally at the site and is related to the diffusion constant by . is the free energy, shown below, and is a stochastic noise component that satisfies fluctuation and dissipation relations.
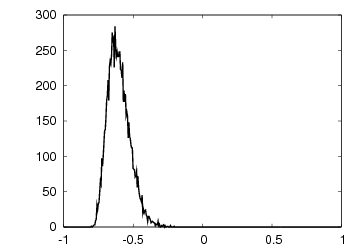
The diffusion constant is found by performing statistical analysis on measurements of the angle calculated directly from molecular dynamics simulations. This angle is recalculated after a nanosecond of simulation has passed. Fig 3 shows a distribution plot of trajectory-averaged changes in the orientation angle after one nanosecond intervals for all of the POPC molecules in a MD simulation (details of the simulation are discussed below),
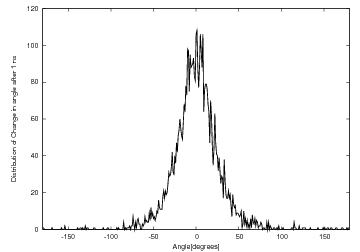
The gaussian-like shape of the change in angle over time allows us employ an Einstein relation to extract the orientational diffusion constant from MD simulations:
| (4) |
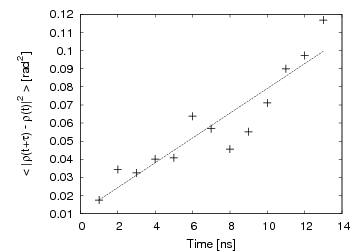
over a short time giving us a diffusion constant in units of . A best-fit line of a plot of vs. , shown in Fig 4, yields twice the diffusion constant. The numerical value of and other parameters used in this work are given in table 1.
II.3 Concentration Field
To model two different types of lipids in our mixtures, we include a concentration field, which describes the compositional makeup of site i at time t. As in our earlier work, Tumaneng et al. (2010), is the concentration of PSM at site , and is the concentration of POPC at site , both of which range from 0 to 1. Therefore, varies continuously from to with the representing pure POPC and representing pure PSM. Locally, may vary but the total number of lipids present in the system remains constant and so the sum over all sites, , is fixed at each time. The concentration field evolves at each lattice point through the Cahn-Hilliard equation Chaiken and Lubensky (1995):
| (5) |
is the free energy and is a conserved stochastic noise component. is the lipid mobility and is related to the lipid diffusion constant by . The value of is unchanged from earlier work, and is given in Table 1. Eq 5 ensures that, while local lipid concentration field values may vary in time in response to thermal fluctuations and tendency towards free energy minimization, the total lipid concentrations in the system are conserved.
II.4 Hamiltonian
The system Hamiltonian contributions arise from lipid-lipid chain interactions, lipid chain-CHOL interactions, and CHOL-CHOL interactions:
| (6) |
The Hamiltonian couples the order parameter and concentration fields to each other and to the overlying CHOLs. Due to the anisotropic nature of the POPC molecules, the first term in Eq 6 differs from our previous model Tumaneng et al. (2010) and is explained in detail below. The second and third terms in Eq 6 have not been altered from Tumaneng et al. (2010), but are also briefly summarized below.
II.4.1 Lipid-Lipid, Interaction Term,
Lipid-lipid interactions are calculated following the model first proposed by Marc̆elja Marc̆elja (1974), defined in terms of order-parameter based pairwise interactions between chains. The model was originally applied to DPPC-CHOL mixtures Khelashvili et al. (2005); Pandit et al. (2007); Tumaneng et al. (2010), and produced heat capacities and a phase diagram that agreed quite well with experiment Vist and Davis (1990). In this application, we consider two model scenarios: (i) a model that contains no orientational dependence for POPC-POPC interactions, and (ii) a model that includes explicit orientation dependence for POPC-POPC interactions.
If we include no orientation-dependent interactions between neighboring POPC molecules, the lipid-lipid Hamiltonian for a pure POPC bilayer is written
| (7) |
where the angled brackets indicate that the sum is taken over nearest neighbor pairs and the coupling constant, , is a phenomenological parameter that is tuned in such a way that the calculated phase transition temperature of pure POPC matches the experimental value. To accomplish this, the average order parameter is calculated in a system of pure POPC for a range of temperatures with a given value of . A plot of order parameter against temperature reveals a curve that exhibits a sharp increase in order as temperature is decreased below a threshold temperature, which identifies as the phase transition temperature. is phenomenologically adjusted so that the simulated phase transition temperature is in agreement with the experimentally-calculated value. The numerical value for for this case is shown in table 1.
With two identical saturated chains, PSM is not expected to interact in an angular dependent fashion among nearest neighbors. Therefore, PSM:PSM interactions are written as:
| (8) |
is the coupling constant tuned in pure PSM mixtures to obtain a main chain phase transition temperature that is identical to experiment.
For the case where we include an orientational degree of freedom for POPC molecules, we alter the POPC chain-chain interaction Hamiltonian as follows. We first recall that the concentration field variable can range continuously from representing pure POPC to representing pure PSM. To incorporate the asymmetric nature of POPC-POPC interactions proposed above, we include an angular dependence to this term in proportion to the amount of POPC present between interacting nearest neighbors:
| (9) |
Here, is a function of fraction of POPC, , and the fraction of PSM, , present in the entire system:
| (10) |
As the fraction of POPC at site is , the local normalized fraction of POPC at neighboring sites and is
| (11) |
We model the angular contribution between nearest neighbor POPC pairs by the function of the relative POPC orientational angles and for molecules at sites and
| (12) |
The angles and are defined in Figure 5 and discussed in more detail in the next paragraph. The second term in Eq 9 couples the order parameter field to the concentration field and the third term couples concentrations at neighboring sites. As described in Tumaneng et al. (2010), and are estimated directly from MD simulations. The concentration dependence in the first term of Eq 9 (also see Eq 11) ensures that interactions have an angular dependence only in proportion to the amount of POPC at each site.
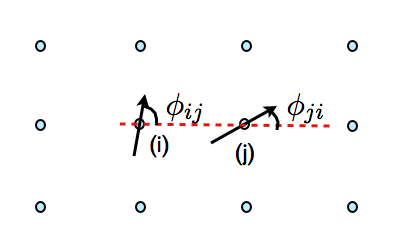
In order to model the condition that a lipid interacts more favorably with a nearest neighbor if its saturated chain points towards that neighbor and less favorably if its unsaturated chain points towards that neighbor, the orientation function in Eq 12 is used. For this function, the orientations of POPC lipids at site and are illustrated with black arrows in Fig 5 which point from the top of the unsaturated chain towards the top of the saturated chain. and represent the orientation of those vectors relative to a line between site to site (the red line in Fig 5). The angle is related to the orientation angle , defined above and illustrated in Fig 2, by a constant that depends on the location of site relative to site . If the two black arrows in Fig 5 point towards each other we interpret this as a saturated chain of a molecule pointing towards the saturated chain of the neighboring molecule and and . This configuration is optimal and no energy penalty is imposed. However, if the two black arrows are pointed away from each other(), we interpret this as two unsaturated chains pointing towards each other, and we impose the maximum energy penalty. The constant represents the strength of the angular dependence. In this model, if is greater than 1, the total energy interaction can include a repulsion between two, nearest neighbor chains. Since steric repulsions are implicitly present in this model through mean field statistical mechanical calculations and conformation sampling, it is not necessary or correct to include them in the Hamiltonian.
II.4.2 Lipid-CHOL Interaction Term,
As discussed above and described in previous publications Tumaneng et al. (2010); Khelashvili et al. (2005); Pandit et al. (2007), lipid-CHOL interactions have an angular dependence in the plane of the bilayer because the “smooth” face has a tendency to induce more order in chains than the “rough” face does. The second term in the Hamiltonian accounts for this asymmetric interaction dependence:
| (13) |
The sums are over all lipid chains and nearest neighbor CHOL molecules. Each CHOL ‘rod’ has a body coordinate system with a -axis along the length of the rod starting at the center of mass, and an -axis extending from the center of mass in the direction perpendicular to the rod on the ‘rough’ side. is defined as the angle between the -axis of CHOL and vector connecting the center of mass of CHOL and the position of lipid on the latticePandit et al. (2007). The coupling constant, , is found from from MD trajectories by linear regression analysis of CHOL-lipid chain interactions as a function of order parameter, as described in previous papers Khelashvili et al. (2005); Pandit et al. (2007). The parameter was introduced in earlier work Pandit et al. (2007) as a means to incorporate the fact that lipid chains are more energetically attracted to the the smooth side of CHOL Pandit et al. (2007). Thus, it serves to represent the asymmetry of lipid-CHOL interactions in the x-y plane of the bilayer. Numerical values for and are the same as used earlier in Pandit et al. (2007).
II.4.3 CHOL-CHOL Interaction Term ,
As in previous work, CHOL molecules are cast as two-dimensional rods that diffuse through the order parameter and concentration fields according to a Langevin equation Khelashvili et al. (2005); Pandit et al. (2007); Tumaneng et al. (2010). As in earlier work we take
| (14) |
where sums are taken over all neighboring CHOL molecules Tumaneng et al. (2010); Khelashvili et al. (2005); Pandit et al. (2007). Here, is the distance between two close CHOLs, with indices and . and are angles made between a fixed direction on the lattice and a fixed direction on the body coordinates of the and CHOLs and is the difference between the two. From MD simulations and the success of previous models Tumaneng et al. (2010); Khelashvili et al. (2005); Pandit et al. (2007), it can be surmised that a simple repulsive interaction is sufficient to model CHOL-CHOL interactions:
where and is the rod length Khelashvili et al. (2005); Pandit et al. (2007).
II.5 Mean Field Analysis
After each time step, new configurations of CHOL positions and orientations and a new concentration field are generated. Assuming that lipid chain order relaxes rapidly between timesteps, the new order parameter field is found in the mean-field approximation. The underlying statistical mechanical partition function is:
| (15) |
where is given in Eq 6 and described in detail above. Sums are over all possible configurations, represented by the order parameter in Eq 1, over all lipids in the system. It is not possible or practical to specify all single chain configurations, so we make use of a representative library of configurations relevant to a bilayer environment that we obtain from MD simulations Khelashvili et al. (2005); Pandit et al. (2007).
For a given set of concentration field values, , the mean molecular field at site due to neighboring lipids, CHOL molecules, and the concentration field has the form:
| (16) |
where is the number of nearest neighbors to ( on a square lattice). Once is calculated at each site, it is used to solve the self-consistent equations for the local order parameter values, within the mean-field approximation:
| (17) |
and to find the mean-field free energy:
| (18) |
II.6 CHOL Diffusion
The rotational and translational diffusion of CHOL molecules over the order parameter and concentration fields are modeled by Langevin equations:
| (19) |
and
| (20) |
where and are stochastic noise components and and are CHOL mobilities. defines the x,y position of the center of the CHOL and is the orientation of the CHOL body axes introduced above. and are thermal fluctuations modeled as random variables that obey fluctuation-dissipation theorems. and , the CHOL mobilities, are related to MD-extracted diffusion constant, , and the rotational diffusion constant, , by and Khelashvili et al. (2005); Pandit et al. (2007). Numerical values for constants are shown in Table 1.
II.7 Simulation
The system is initially given a random set of order parameter and concentration field values at each lattice site and a random distribution of CHOLs at the relevant concentration. The system of self-consistent equations is solved and the mean-field free energy is calculated. Following this, the angle field, concentration field, and CHOL molecules are updated by one time step. The self-consistent equations are solved again and the process is repeated for a total time of at least 1 microsecond.
III Results
In the application to POPC-PSM-CHOL mixtures, we consider a 100 by 100 square lattice with each lattice site representing a whole molecule order parameter. Molecular order parameters are averaged over both chains, so the field is constructed to represent 10,000 lipid molecules to which CHOL molecules are added. POPC:PSM concentrations were simulated between either 5%to 95% or 10% to 90%, depending on CHOL concentration, in increments of 10%. Mixtures including CHOL were simulated at CHOL concentrations ranging from 0-50% in increments of 5%. All simulated concentrations have been run for at least 1 microsecond at a temperature of K. To observe the effects of the addition of angular dependence, simulations were ran with values of equal to 0.0, 0.3, 0.5, 0.7, and 1.0. Table 1 lists the numerical values for all input parameters in the model. While our goal in this modeling work was to obtain as many of the model parameters from MD simulations as possible, in some cases the mapping process involved the use of simulation properties (e.g. molecular energies) that were quite noisy. Thus the model interaction parameters that we used are not necessarily unique, but they are representative of the set of model parameters that should be used in this type of coarse grained modeling. In addition to interaction parameters, the Mean Field model we use requires that the order parameters be symmetric about zero, whereas the MD library order parameter values are not symmetrically distributed due to the bilayer environment. As discussed in earlier work, we introduce order parameter offsets Khelashvili et al. (2005); Pandit et al. (2007), , and which are the mean values of the weighted chain order parameters found from MD simulations of pure POPC and PSM bilayers, respectively. These offsets are subtracted from each value of order parameter in the library, a necessary step to observe a temperature dependent phase transition in the mean field approximation, in the absence of a symmetric library of chain configurations Khelashvili et al. (2005); Pandit et al. (2007).
| Parameter | Value | Method of Estimation | Comment |
|---|---|---|---|
| 143, 160 KJ/mol | P | calibrated for each | |
| 63 KJ/mol | P | ||
| .111 | MD | see Khelashvili et al. (2005); Pandit et al. (2007) | |
| .283 | MD | see Khelashvili et al. (2005); Pandit et al. (2007) | |
| 20 KJ/mol | REG | see Tumaneng et al. (2010) | |
| 100 KJ/mol | REG | see Tumaneng et al. (2010) | |
| 3.0 KJ/mol | REG | see Khelashvili et al. (2005); Pandit et al. (2007) | |
| 2.0 | REG | anisotropy factor see Pandit et al. (2007) | |
| 0.94 nm | MD | hardcore repulsive CHOL-CHOL cutoff | |
| APPROX | |||
| APPROX | see Khelashvili et al. (2005); Pandit et al. (2007) | ||
| APPROX | see Khelashvili et al. (2005); Pandit et al. (2007) | ||
| .07 | REG | ||
| 0.0, 1.0 | P | dimensionless |
For the MD-based parameters in Table 1 and chain configuration libraries we used the following simulation protocols: The GROMACS simulation package Berendsen et al. (1995); Lindahl et al. (2001) was used to simulate a 200-lipid bilayer with compositions 37.5% POPC, 37.5%PSM and 25% CHOL, solvated in 7211 SPC-E water molecules. The LINCS algorithm Hess et al. (1997) was used for bond constraints with an integration time step of 2 fs. Periodic boundary conditions were used in all three dimensions. Long range electrostatics were calculated using the PME algorithm Essmann et al. (1995) with a real space cutoff of 10 Å. Van der Waals interactions were cut off at 16 Å. The NPT ensemble was employed, allowing the volume to fluctuate and the Parinello-Rahman pressure couling scheme Nose and Klein (1983); Parrinello and Rahman (1981) was used with a constant pressure of 1 atm. Systems were simulated for 100 ns at a temperature of 313 K.
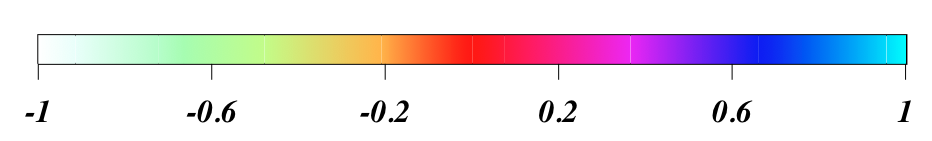
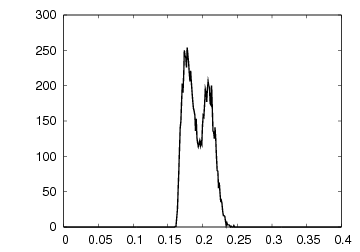
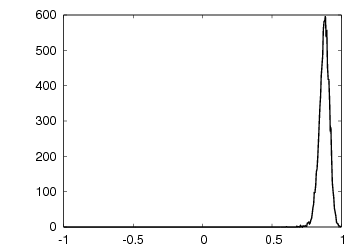
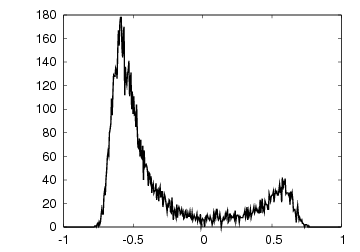
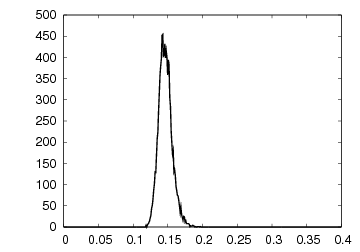
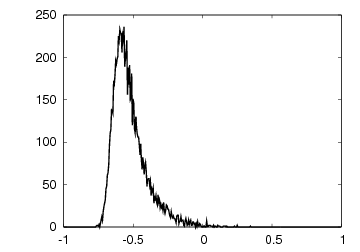
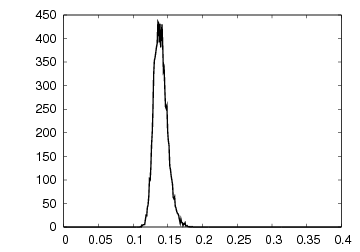
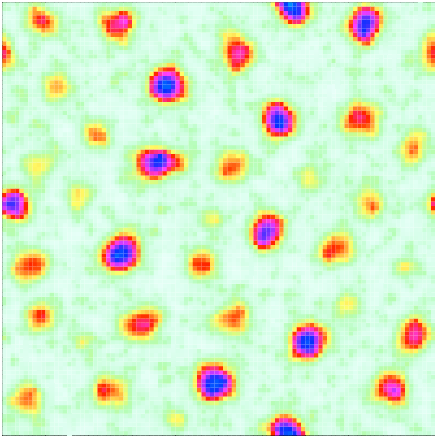
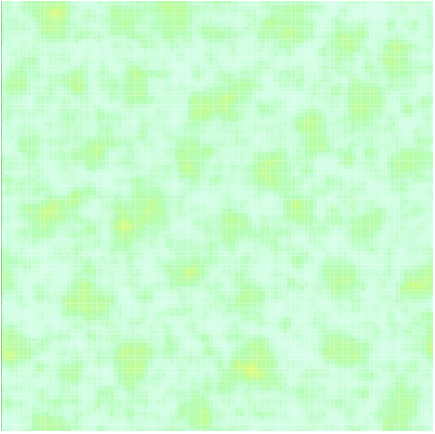
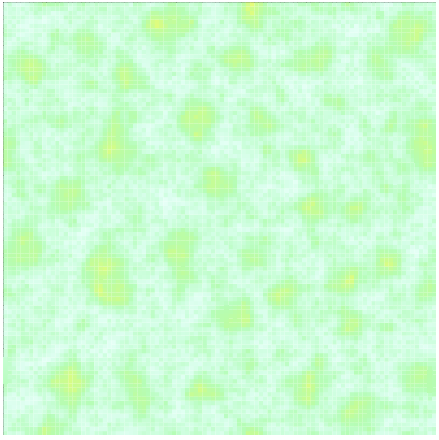
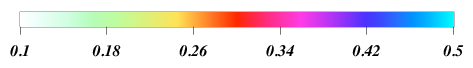
The simulated results can be qualitatively visualized through two dimensional color density plots of concentration and order parameter fields. For quantitative analysis of the lateral organization we calculate binned distributions of order and concentration averaged over many snapshots. Examples are shown in Fig 6. The concentration field plot for the POPC:PSM:CHOL concentration triplet 45:40:15 after 1 microsecond with (no angular dependence), Fig 6(a), exhibits a bimodal pattern of concentration with field value represented by a color scheme shown in the key in 6(c). The order parameter field snapshot for the same concentration after 1 microsecond is shown in Fig 6(b). This field exhibits a pattern that is similar to the pattern of the concentration field, with higher order parameter values associated with higher concentrations of PSM and lower order parameter values associated with higher concentrations of POPC. Figs 6(e) - 6(f) are plots of the distribution of values of the concentration and order fields over the lattice, respectively. This distribution, and others we describe here, was made by placing the 10,000 lattice composition field values into bins ranging in value from from -1 to +1(concentration) or 0 to 0.5 (order) with width 0.01, for a single snapshot after 1s of simulation. However, we note that, based on both the color code for Fig 6(b) and the narrowness of the distribution in Fig 6(f), the variation of order over the lattice at this concentration is reduced compared to the variation in concentration over the lattice.

To study the effect of POPC-POPC interaction angular dependence in the model, we have run simulations with values between 0.0 and 1.0. The effect of increasing is to very slightly increase the magnitude of lateral organizational patterns in the order parameter field at low CHOL concentration. Fig 7 illustrates the effect of for two mixtures, POPC:PSM:CHOL 50:50:0 (Figs 7(b) and 7(b)) and 40:40:20 (Figs 7(c) and 7(d)). In both cases, leads to a slightly higher degree of lateral segregation in the order parameter field. Generally, we find that the incorporation of angular dependence leads to minor changes in the properties of the mixtures for CHOL concentrations less that about 20%. At CHOL concentrations closer to 50%, snapshots with and are indistinguishable.
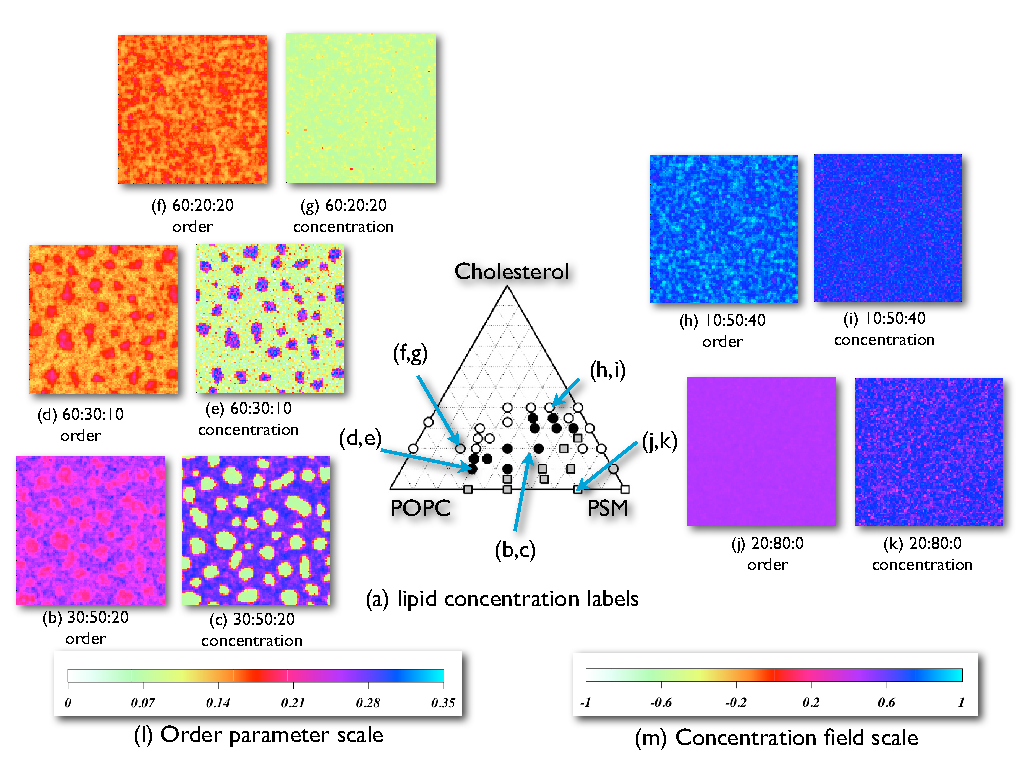
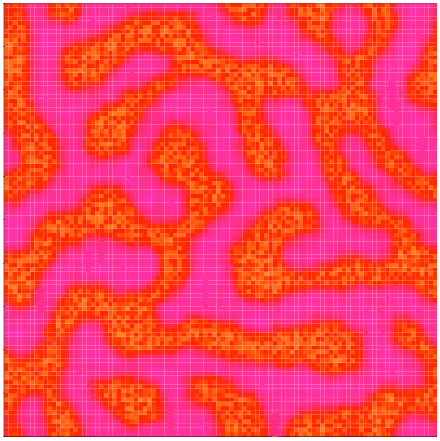
By examining order parameter and concentration field distributions, and snapshots, we can locate points on a ternary triangle diagram where the model predicts bimodal distributions of order and concentration, which we then relate to experimental ternary bilayer triangle diagram regions. Fig 8(a) is a ternary plot published by Veatch and Keller Veatch and Keller (2005), based on fluorescence microscopy for the temperature of 23. Superimposed over their plot are arrows linking simulated concentration points on the diagram to system snapshots in figures 8(b)- 8(k), for simulations carried out with . In comparing our model to experimental data based on fluorescence microscopy, it is important to note that the simulation time scale, on the order of 1 , is much smaller than experimental time scales. Lateral inhomogeneities in this model as well as those in other models based on the Cahn-Hilliard Chaiken and Lubensky (1995); Peng et al. (2000) equation, tend to increase in size over time under favorable conditions.
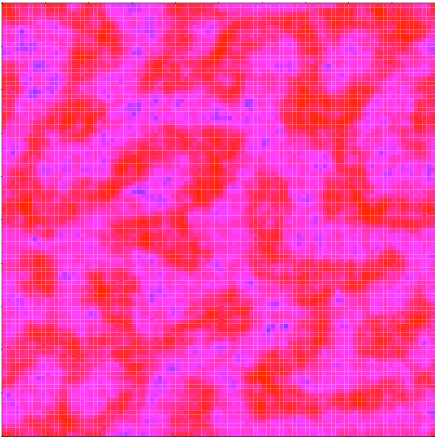
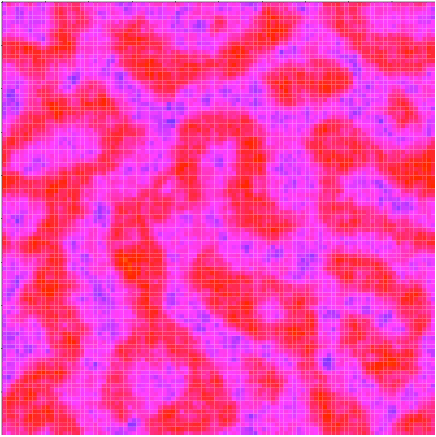
Fig 8(b) shows the final order parameter snapshot for the POPC:PSM:CHOL concentration 30:50:20 and Fig 8(c) shows the final concentration field snapshot the same concentration. This concentration corresponds to the point labeled (b,c) with an arrow in Fig 8(a). We can see in the concentration field rounded regions of light green color, indicating they are enriched with POPC. They are embedded in a background of a dark blue color, indicating enrichment in PSM. The order parameter field color plot for this mixture, Fig 8(b), has a pattern that is similar to the concentration field plot, but note that the difference in the magnitude of the order parameters, the color scale difference, is reduced.
On the triangle diagram, experimental data points surrounding the point (b,c) are black circles, which denote coexisting high and low order domains. In the ternary plot of the same POPC-PSM-Chol system published by de Almeida et al. de Almeida et al. (2003), this concentration point is considered to be within a three-phase region of coexisting gel, liquid disordered and liquid ordered phases. Zhao et al. Zhao et al. (2007a), argue that in some cases micron-sized separated regions may be light induced Zhao et al. (2007a), but they do not rule out their existence on a smaller size scale.
In Fig 8(d) we show the final order parameter field snapshot and in Fig 8(e) we show the final concentration field snapshot for the 60:30:10 mixture. The corresponding point on the triangle diagram is labeled (d,e) by an arrow. Again, we see the formation of higher ordered regions in the order parameter field coinciding with PSM-rich regions in the concentration field and regions of lower order coinciding with POPC-rich regions. The experimental data points on the triangle diagram in Fig 8(a) shows black dots at regions surrounding this concentration point, representing the coexistence of liquid ordered and liquid disordered phases.
In Figs 8(f) and 8(g), we show the final order parameter and concentration field snapshots at the concentration triplet 60:20:20, labeled (f,g) with an arrow on the triangle diagram. For this point, where the POPC concentration is high, there are no clear bimodal patterns in either field. However, CHOL does have an effect on the order, raising the values of chain order without forming large-scale lateral inhomogeneity. At similar POPC:PSM ratios (3:1), but in the absence of CHOL (not shown in this figure) we find that the order parameter field is quite uniform with an average value of 0.15, with a very narrow distribution. However, Figs 8(f) and 8(g) show that 20 % CHOL increases the order into the range 0.16-0.17 with a wider distribution. In the order parameter field color density plot, there are diffuse regions that are more heavily populated by higher order and diffuse regions that are more heavily populated by lower order, but sharp demarcation between regions is absent. The experimental data points near point (f,g) are white circles that represent a single liquid phase region. De Almeida et al. de Almeida et al. (2003) and Pokorny et al. Pokorny et al. (2006) find evidence for coexistence of liquid ordered and liquid disordered phases at this point on their POPC-PSM-CHOL triangle diagram.
The concentration triplet 10:50:40 is shown in Fig 8(h) and 8(i) and labeled (h,i) on the triangle diagram. At this concentration there are no significant inhomogeneities in either the order parameter or the concentration fields. In this case there is a greater presence of PSM and the result is a uniformly higher order parameter field and a uniform concentration field. The presence of CHOL at this point has the effect of inducing order on all of the chains. The experimental data points surrounding the simulated concentration are white circles that represent the presence of a single liquid. Pokorny et al. Pokorny et al. (2006) and de Almeida et al. de Almeida et al. (2003) also identify this region as a single liquid disordered phase.
Figs 8(j) and 8(k) show order parameter and concentration field final snapshots for 80% PSM and 20% POPC in the absence of CHOL. The corresponding concentration is labeled (j,k) on the experimental diagram. There is no discernible separation of order parameter and concentration field values between high and low values. Both order parameter and concentration field distributions for this ratio are quite uniform. At this same concentration, the experimental data point shown in Fig 8(a) is a white square, indicative of a single highly ordered gel phase. In our simulations, along the 0% CHOL concentration axis, as POPC concentration increases from 10% to 90%, the order parameter field evolves smoothly (within the resolution the number of simulations) from a high value, to low value with increasing POPC. Bimodalities in order are seen as shoulders rather than separated peaks, and one can discern subtle variations in snapshots, as seen for example in Fig 7. In the concentration field, however, there is a region of coexistence between PSM concentrations of 0.30 and 0.75 at 0% CHOL. At 50:50:0, the domains in the model are no longer circular, but percolate across the simulation box (see Fig 7). The triangle diagram published by de Almeida et al. de Almeida et al. (2003) exhibits bimodal behavior along the 0% CHOL concentration line, with a gel phase at the high PSM end, liquid disordered phase at the high POPC line, and a broad coexistence region between.
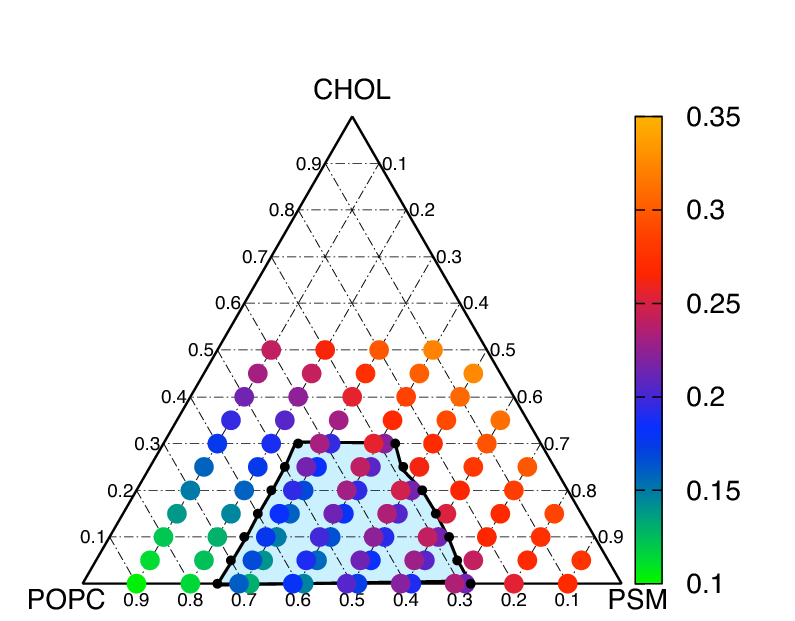
In Fig 9, we collect all of the results of 1 simulations onto a triangle diagram based on order parameters for . The triangle diagrams for other values of are not qualitatively different. The colored dots represent the average value of molecular order parameters, with the color of the dots denoting the magnitudes. Within the shaded region, there are two dots at each simulated mixture point representing the respective values at each peak in order parameter distributions which show bimodality. The bimodal region itself is outlined by a boundary contour that was approximated by fitting distribution peaks to gaussians and interpolating where single peaks would branch into double peaks. The resolution of this boundary is limited by the number of simulations carried out. As expected, Fig 9 shows that increasing CHOL concentration has the effect of increasing the order parameter for the full system.
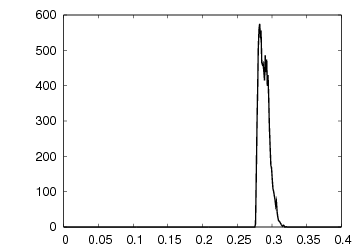
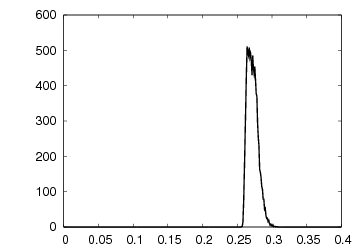
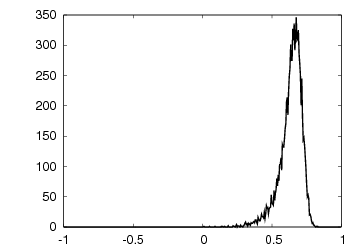
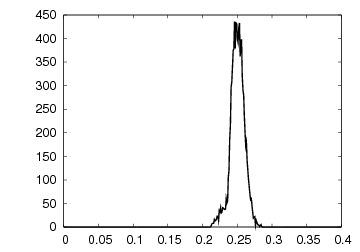
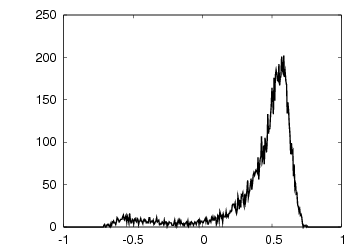
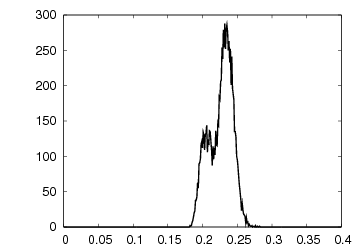
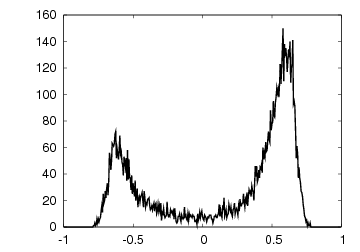
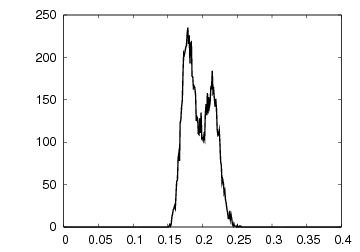
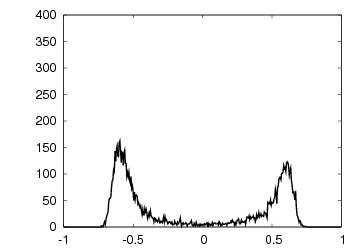
As can be seen in the ternary figure, the patterns of the colored dots exhibit a shift from high order parameter value (orange, yellow) in PSM-rich regions to low order parameter (green, blue) in POPC-rich regions. At concentrations of CHOL below about 0.3, the order parameter and concentration fields separate into regions rich in POPC and regions rich in PSM, as was discussed above. To quantitatively analyze this behavior, we consider the 15% CHOL concentration line in the ternary plot, whose distributions of order parameter and concentration fields are shown in Figs 10(a)-10(p). At low POPC concentration, 5:80:15 (Figs 10(a) and 10(b)), the order fields have a single peak and the average value occurs at approximately 0.28 (a yellow dot in Fig 9). As we move toward higher POPC concentrations, the order parameter value is reduced. At the concentration 35:60:15 (Figs 10(c) and 10(d)), we start to see the emergence of a second peak in concentration around 0.2. Moving further into the bimodal region, this concentration field peak grows and eventually dominates the distribution. Above 55:30:15 (Figs 10(k) and 10(l)), again, only a single peak is visible in the distribution. Note that in all cases the order parameter field exhibits a much more subtle level of bimodality, through shoulders in a single peak rather than separated peaks. The addition of angular dependence does not change the distributions significantly.
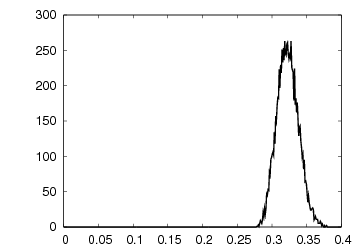
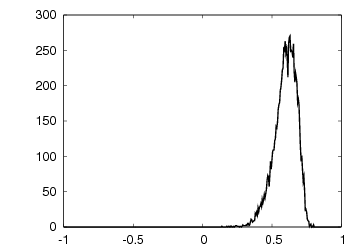
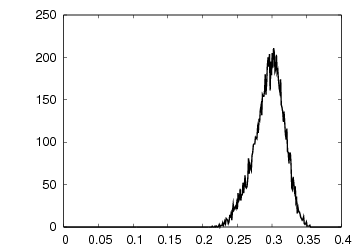
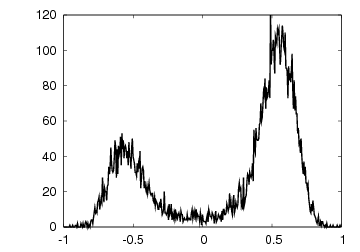
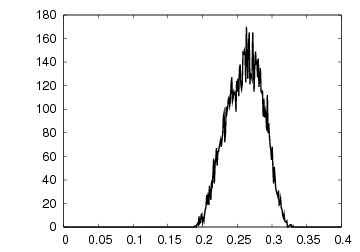
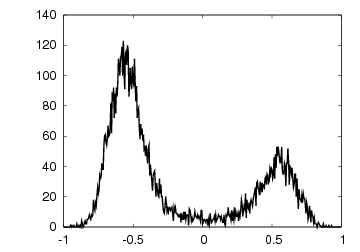
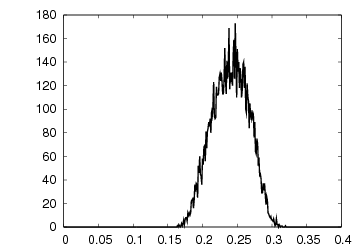
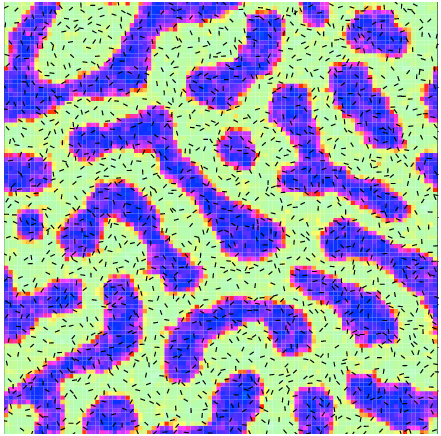
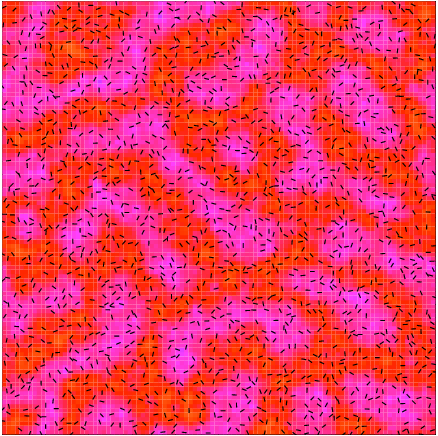
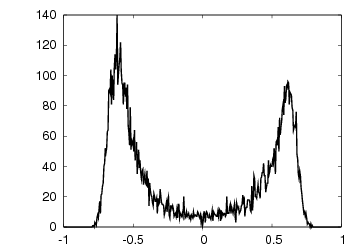
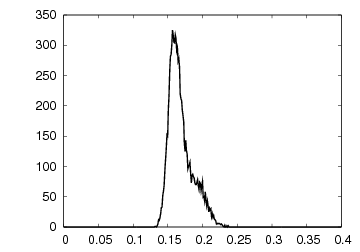
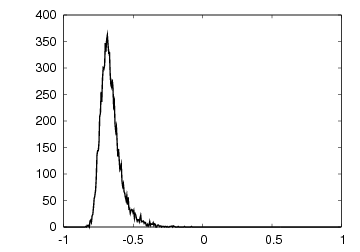
As CHOL increases above 15% we find that the order parameter bimodal peaks begin to merge, while the concentration field distribution remains bimodal. The distributions of the order and concentration fields at 50% CHOL are shown in Fig 11. At high PSM concentrations, 10:40:50 (Figs 11(a) and 11(b)) there is a single peak in both the concentration field and the order parameter field. This is also true at high POPC concentrations, 40:10:50 (Figs 11(g) and 11(h)). However, between these two extremes, (Figs 11(c) and 11(d) and Figs 11(e) and 11(f)), the concentration field distributions split into two clearly separate peaks, but the order parameter distributions still show just a single peak. In this model, we find that the presence of CHOL at moderate to high concentration (above 30% CHOL concentration) has the effect of ordering lipid chains of both PSM and POPC to such a degree that we are unable to distinguish between POPC and PSM by chain order.
IV Discussion
We have presented a quantitative model for ternary mixtures of POPC, PSM, and CHOL. The model represents a high level of coarse graining that allows us to simulate many different mixtures on relatively large lattices for relatively long times. The results presented in the form of distributions of order and concentrations, and in the form of final snapshots, fit well with existing experimental data. The degree of phenomenology is necessarily greater than our earlier work Tumaneng et al. (2010) but every effort was made to use input from MD simulations where possible. As we found in earlier work, the order parameter field and concentration field distributions vary according to the mean field approximation, and are expected to provide an accurate description of the system as long as one is not near a critical point. In the model, as relative concentrations of POPC, PSM, and CHOL are changed, bimodalities in the concentration distributions can be found over a portion of the triangle diagram as illustrated in Fig 9. For intermediate CHOL concentrations, bimodalities in order parameter field distributions tend to parallel those found in concentration field distributions. However, in the POPC-PSM-CHOL results, differences in chain order between adjacent domains are generally smaller in magnitude when compared to results from the same model applied to DOPC-SSM-CHOL Tumaneng et al. (2010). At higher CHOL concentrations (above about 30%) order parameter bimodality is not found even for mixtures that exhibit concentration field bimodality.
A key difference between the results of this paper and our previous implementation of the SCMFT model for DOPC-SSM-CHOL mixtures Tumaneng et al. (2010) is the reduced area occupied by the bimodal regions the POPC-PSM-CHOL ternary plot (see Tumaneng et al. (2010)),compared to the bimodal regions in the DOPC-SSM-CHOL ternary plots. In the DOPC system, the bimodal region is wider, implying that the DOPC system can more readily separate in to high/low order regions and the inclusion of a saturated chain in POPC reduces the size of the regions over which separated domains can form. Fig 12 illustrates this comparative difference 60:30:10 mixtures (Fig 12(a)). In the DOPC mixture, small rounded domains have formed that are rich in ordered SSM and are surrounded by a DOPC background with a lower order parameter value. In the POPC mixtures, the color density plot shows that the difference in the order parameters between the regions is practically zero. Therefore, a prediction of this model is that molecular chain order differences may be quite subtle and even undetectable whereas concentration field distributions still exhibit bimodality, or phase separation.
We note that, while the inclusion of an orientational interaction for asymmetrical POPC molecules is a reasonable addition to the model, the results in our work are only weakly dependent on this interaction. The interaction function that included POPC orientation, Eq. 9, was chosen as a simple way to express this interaction. It is possible that a different choice for the orientational energy expression could produce different results when the concentration of POPC is large.
In summary, our extended model for ternary component lipid bilayers of POPC-PSM- CHOL shows good agreement with experiment, and provides possible new insights into the atomic level compositional and order distributions. This SCMFT model can be utilized to describe any system consisting of two long-chain lipids in a ternary mixture with CHOL, independent of chain type, length, or level of unsaturation, while also taking into account any angular dependencies.
Acknowledgements.
SP thanks Gerald Feigenson for helpful discussions. PT, GZ, and HLS acknowledge support from NIH Grant Number PHS 2 PN2 EY016570B from the through the NIH Roadmap for Medical Research. Author SAP acknowledge support from NIH grant 1R01GM086707-01A1.References
- Veatch and Keller (2005) S. L. Veatch and S. L. Keller, Phys. Rev. Lett. 94, 148101 (2005).
- Haluska et al. (2008) C. K. Haluska, A. P. Schröder, P. Didier, D. Heissler, G. Duportail, Y. Mély, and C. Marques, Biophys. J. 95 (2008).
- Kahya et al. (2003) N. Kahya, D. Scherfeld, K. Bacia, B. Poolman, and P. Schwille, J. Biol. Chem. 278, 28109 (2003).
- Veatch and Keller (2002) S. L. Veatch and S. L. Keller, Phys. Rev. Lett. 89, 268101 (2002).
- Stottrup et al. (2005) B. Stottrup, D. Stevens, and S. Keller, Biophys. J. 88, 269 (2005).
- Aittoniemi et al. (2007) J. Aittoniemi, P. S. Niemelä, M. T. Hyvönen, M. Karttunen, and I. Vattulainen, Biophysical Journal 92, 1125 (2007).
- Zhang et al. (2007) Z. Zhang, S. Y. Bhide, and M. L. Berkowitz, The Journal of Physical Chemistry 111, 12888 (2007).
- de Almeida et al. (2007) R. F. M. de Almeida, J. Borst, A. Fedorov, M. Prieto, and A. J. W. G. Visser, Biophysical Journal 93, 539 (2007).
- Lindblom et al. (2006) G. Lindblom, G. Orädd, and A. Filippov, Chemistry and Physics of Lipids 141, 179 (2006).
- Zhao et al. (2007a) J. Zhao, J. Wu, F. A. Heberle, T. T. Mills, P. Klawitter, G. Huang, G. Costanza, and G. W. Feigenson, Biochimica et Biophysica Acta 1768, 2764 (2007a).
- Collins and Keller (2008) M. D. Collins and S. L. Keller, PNAS 105, 124 (2008).
- Heberle et al. (2005) F. A. Heberle, J. T. Buboltz, D. Stringer, and G. W. Feigenson, Biochimica et Biophysica Acta 1746, 186 (2005).
- Moore et al. (2006) D. J. Moore, R. G. Snyder, M. E. Rerek, and R. Mendelsohn, J. Phys. Chem. 110, 2378 (2006).
- Zheng et al. (2007) L. Zheng, C. M. McQuaw, A. G. Ewing, and N. Winograd, J. Am. Chem. Soc. 129, 15730 (2007).
- Zhao et al. (2007b) J. Zhao, J. Wu, H. Shao, F. Kong, N. Jain, G. Hunt, and G. Feigenson, Biochimica et Biophysica Acta 1768, 2777 (2007b).
- Filippov et al. (2007) A. Filippov, G. Orädd, and G. Lindblom, Biophysical Journal 93, 3182 (2007).
- Filippov et al. (2003) A. Filippov, G. Orädd, and G. Lindblom, Biophysical Journal 84, 3079 (2003).
- Cicuta et al. (2007) P. Cicuta, S. L. Keller, and S. L. Veatch, The Journal of Physical Chemistry B 111, 3328 (2007).
- Castro et al. (2007) B. M. Castro, R. F. M. de Almeida, L. C. Silva, A. Fedorov, and M. Prieto, Biophysical Journal 93, 1639 (2007).
- Bakht et al. (2007) O. Bakht, P. Pathak, and E. London, Biophysical Journal 93, 4307 (2007).
- Frazier et al. (2007) M. L. Frazier, J. R. Wright, A. Pokorny, and P. F. F. Almeida, Biophysical Journal 92, 2422 (2007).
- Ursell et al. (2009) T. S. Ursell, W. S. Klug, and R. Phillips, PNAS (2009).
- Veatch et al. (2007) S. L. Veatch, O. Soubias, S. L. Keller, and K. Gawsrisch, PNAS 104, 17650 (2007).
- Pokorny et al. (2006) A. Pokorny, L. E. Yandek, A. I. Elegbede, A. Hinderliter, and P. F. F. Almeida, Biophysical Journal 91, 2184 (2006).
- Bunge et al. (2008) A. Bunge, P. M. Müller, M. Stöckl, A. Herrmann, and D. Huster, Biophys. J. 94, 2680 (2008).
- Halling et al. (2008) K. K. Halling, B. Ramstedt, J. H. Nuström, J. P. Slotte, and T. K. M. Nyholm, Biophysical Journal 95, 3861 (2008).
- de Almeida et al. (2003) R. de Almeida, A. Feorov, and M. Prieto, Biophys. J. 85, 2406 (2003).
- Tsamaloukas et al. (2006) A. Tsamaloukas, H. Szadkowska, and H. Heerklotz, Biophysical Journal 90, 4479 (2006).
- Lingwood and Simons (2010) D. Lingwood and K. Simons, Science 327, 46 (2010).
- Simons and Ikonen (1997) K. Simons and E. Ikonen, Nature 387, 569 (1997).
- Edidin (2003) M. Edidin, Annu. Rev. Biophys. Biomol. Struct 32, 257 (2003).
- Jacobson et al. (2007) K. Jacobson, O. G. Mouritsen, and R. G. W. Anderson, Nature Cell Biology 9, 7 (2007).
- Hancock (2006) J. Hancock, Nature Rev. Mol. Cell Biol. 7, 456 (2006).
- Pike (2003) L. J. Pike, Journal of Lipid Research 44, 655 (2003).
- Pike (2004) L. J. Pike, Biochemical Journal 378, 281 (2004).
- Yeagle (1993) P. Yeagle, The Membranes of Cells – 2nd. ed. (Academic Press, Inc., 1993).
- Lantzsch et al. (1994) G. Lantzsch, H. Binder, and H. Heerklotz, Journal of Fluorescence 4, 339 (1994).
- Veatch and Keller (2003) S. Veatch and S. Keller, Biophys. J. 85, 3074 (2003).
- Korlach et al. (1999) J. Korlach, P. Schwille, W. W. Webb, and G. W. Feigenson, PNAS 96, 8461 (1999).
- Vist and Davis (1990) M. R. Vist and J. H. Davis, Biochemistry 29, 451 (1990).
- McMullen and McElhaney (1995) T. P. W. McMullen and R. N. McElhaney, Biochimica et Biophysica Acta 1234, 90 (1995).
- Mateo et al. (1995) C. R. Mateo, A. U. Acuña, and J. C. Brochon, Biophys. J. 68, 978 (1995).
- Khelashvili et al. (2005) G. A. Khelashvili, S. A. Pandit, and H. L. Scott, J. Chem. Phys. 123, 024910 (2005).
- Pandit et al. (2007) S. A. Pandit, G. A. Khelashvili, E. Jakobsson, A. Grama, and H. L. Scott, Biophys. J. 92, 440 (2007).
- Pan et al. (2009) J. Pan, S. Tristram-Nagle, and J. F. Nagle, Physical Review E 80, 021931 (2009).
- Ramstedt and Slotte (2006) B. Ramstedt and J. P. Slotte, Biochimica et Biophysica Acta 1758, 1945 (2006).
- Pandit et al. (2008) S. A. Pandit, S. Chiu, E. Jakobsson, A. Grama, and H. L. Scott, Langmuir 24, 6858 (2008).
- Baumgart et al. (2007) T. Baumgart, G. Hunt, E. R. Farkas, W. W. Webb, and G. W. Feigenson, Biochimica et Biophysica Acta 1768, 2182 (2007).
- Morales-Penningston et al. (2010) N. F. Morales-Penningston, J. Wu, E. R. Farkas, S. L. Goh, T. M. Konykhina, J. Y. Zheng, W. W. Webb, and G. W. Feigenson, BBA - Biomembranes (2010).
- Marsh (2009) D. Marsh, Biochimica et Biophysica Acta 1788, 2114 (2009).
- Lichtenberg et al. (2005) D. Lichtenberg, F. M. Goñi, and H. Heerklotz, Trends in Biochemical Sciences 8, 430 (2005).
- Putzel and Schick (2008) G. G. Putzel and M. Schick, Biophysical Journal 95, 4756 (2008).
- Putzel and Schick (2009) G. G. Putzel and M. Schick, Biophysical Journal 96, 4935 (2009).
- Elliott et al. (2006) R. Elliott, I. Szleifer, and M. Schick, Phys. Rev. Lett. 96, 098101 (2006).
- Elliott et al. (2005) R. Elliott, K. Katsov, M. Schick, and I. Szleifer, The Journal of Chemical Physics 122, 044904 (2005).
- Tumaneng et al. (2010) P. W. Tumaneng, S. A. Pandit, G. Zhao, and H. L. Scott, The Journal of Chemical Physics 132, 065104 (2010).
- Pandit and Scott (2009) S. A. Pandit and H. L. Scott, Biochim. Biophys. Acta 1788, 136 (2009).
- Shi and Voth (2005) Q. Shi and G. A. Voth, Biophys. J. 89, 2385 (2005).
- Idema et al. (2009) T. Idema, J. M. J. van Leeuwen, and C. Storm, Phys. Rev. E 80, 041924 (2009).
- Fattal and Ben-Shaul (1994) D. R. Fattal and A. Ben-Shaul, Biophysical Journal 67, 983 (1994).
- Ben-Shaul et al. (1985) A. Ben-Shaul, I. Szleifer, and W. M. Gelbart, J. Chem. Phys. 83, 3597 (1985).
- Gruen (1985) D. W. R. Gruen, J. Phys. Chem 89, 146 (1985).
- Müller et al. (2006) M. Müller, K. Katsov, and M. Schick, Physics Reports 434, 113 (2006).
- McConnell (2009) H. McConnell, The Journal of Chemical Physics 130, 165103 (2009).
- Risselada and Marrink (2008) H. J. Risselada and S. J. Marrink, PNAS 105, 17367 (2008).
- Maulik and Shipley (1996) P. R. Maulik and G. G. Shipley, Biophys. J. 70, 2256 (1996).
- Chaiken and Lubensky (1995) P. M. Chaiken and T. C. Lubensky, Principles of Condensed Matter Physics (Cambridge University Press, 1995).
- Marc̆elja (1974) S. Marc̆elja, Biochim. Biophys. Acta 367, 156 (1974).
- Berendsen et al. (1995) H. Berendsen, D. van der Spoel, and R. van Drunen, Comp. Phys. Comm 91, 43 (1995).
- Lindahl et al. (2001) E. Lindahl, B. Hess, and D. van der Spoel, J. Mol. Mod. 7, 306 (2001).
- Hess et al. (1997) B. Hess, H. Bekker, H. J. C. Berendsen, and J. G. E. M. Fraaige, J. Comp. Chem. 18 (1997).
- Essmann et al. (1995) U. Essmann, L. Perera, M. L. Berkowitz, T. Darden, H. Lee, and L. G. Pedersen, J. Chem. Phys. 103, 8577 (1995).
- Nose and Klein (1983) S. Nose and M. L. Klein, Mol. Phys. 50, 1055 (1983).
- Parrinello and Rahman (1981) M. Parrinello and A. Rahman, J. Appl. Phys 52, 7182 (1981).
- Peng et al. (2000) G. Peng, F. Qiu, V. Ginzburg, D. Jasnow, and A. Balazs, Science 288, 1802 (2000).